[cnxvideo id=”625482″ placement=”ros”]Americans take into consideration a number of factors when deciding where to live, including the quality of schools, the strength of the local economy and job market, the area’s safety and culture, as well as its climate. Cities that perform well by these measures are more likely to attract new residents, and those that do not tend to drive residents away.
Comparing entire cities to each other can be problematic, particularly since living conditions can vary from one neighborhood to the next. Still, as much as a city can be judged on the whole, some cities face widespread problems that detract from residents’ overall quality of life.
American cities are often held to the standards of national averages, or against all of the other cities in a country. However, for the residents that actually live in these places, a more appropriate point of comparison are those cities that can be found nearby, in the same state.
To determine America’s worst cities to live in each state, 24/7 Wall St. reviewed data on the largest U.S. cities. Based on a range of variables, including crime rates, employment growth, access to restaurants and attractions, educational attainment, and housing affordability, 24/7 Wall St. identified the worst city to live in each state.
Click here to see the worst city to live in every state.
Click here to see our detailed findings and methodology.
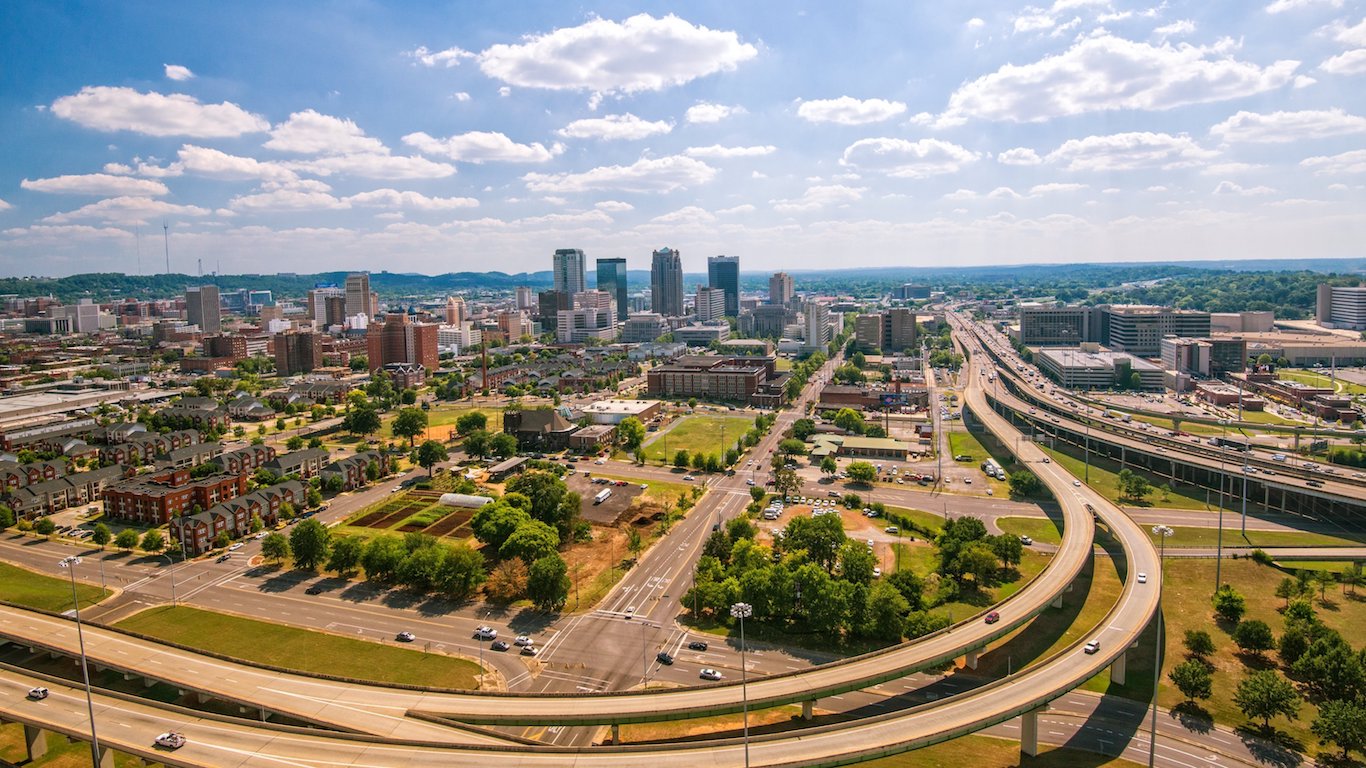
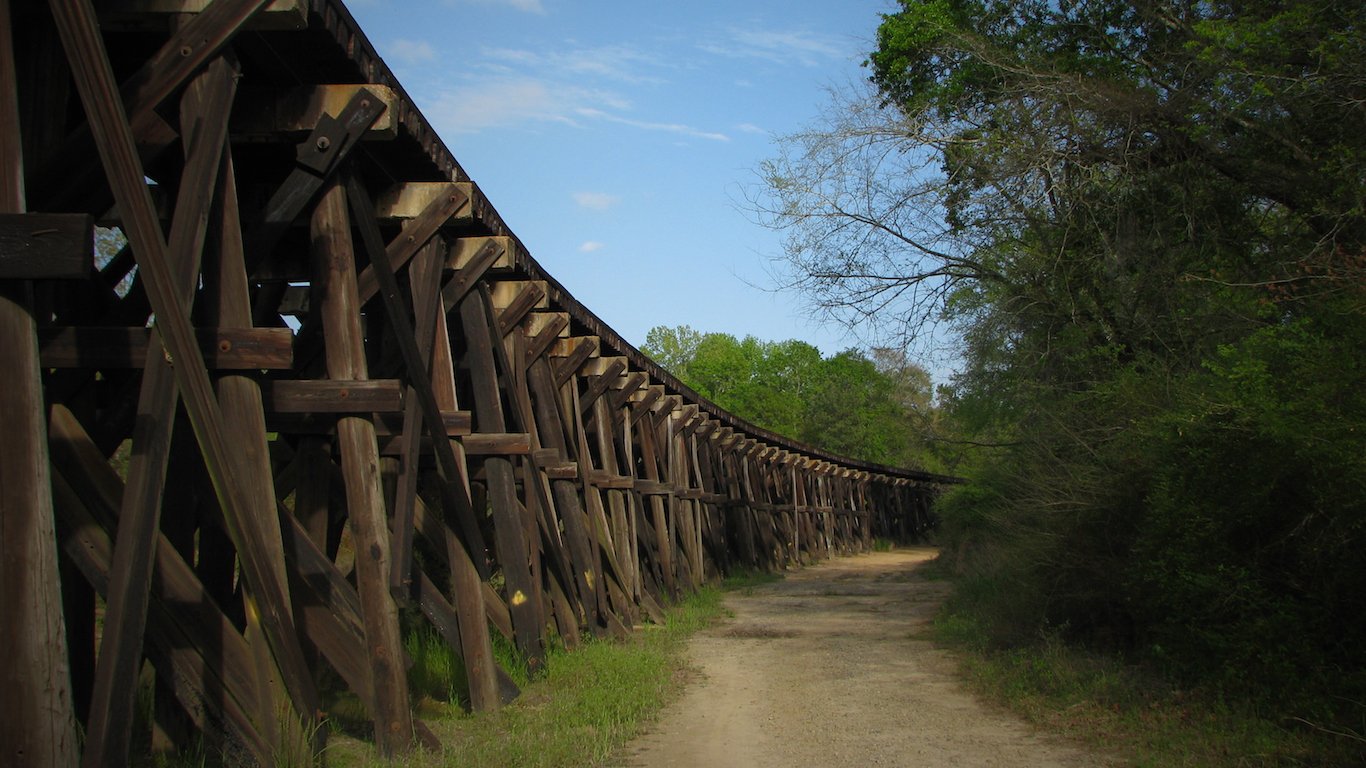
1. Alabama
> Worst city to live: Birmingham
> Population: 214,911
> Median home value: $93,000
> Poverty rate: 29.2%
> Adults with at least a bachelor’s degree: 25.3%
Declining population and declining jobs in a city is indicative of a struggling economy, particularly when the vast majority of major cities are growing. Of the hundreds of major cities reviewed, the population fell in only 42 over the past decade, and annual employment declined in less than 30 over the last two years. Birmingham is one of those cities in both cases, with a 3.3% 10-year population loss and a 0.9% employment decline between 2013 and 2015.
Birmingham is the poorest large city in Alabama and one of the poorest cities in the United States. About 29.2% of the city’s population lives in poverty, roughly double the 14.7% U.S. poverty rate, and the typical household earns just $32,378 a year, over $23,000 below the national median household income.
[in-text-ad]
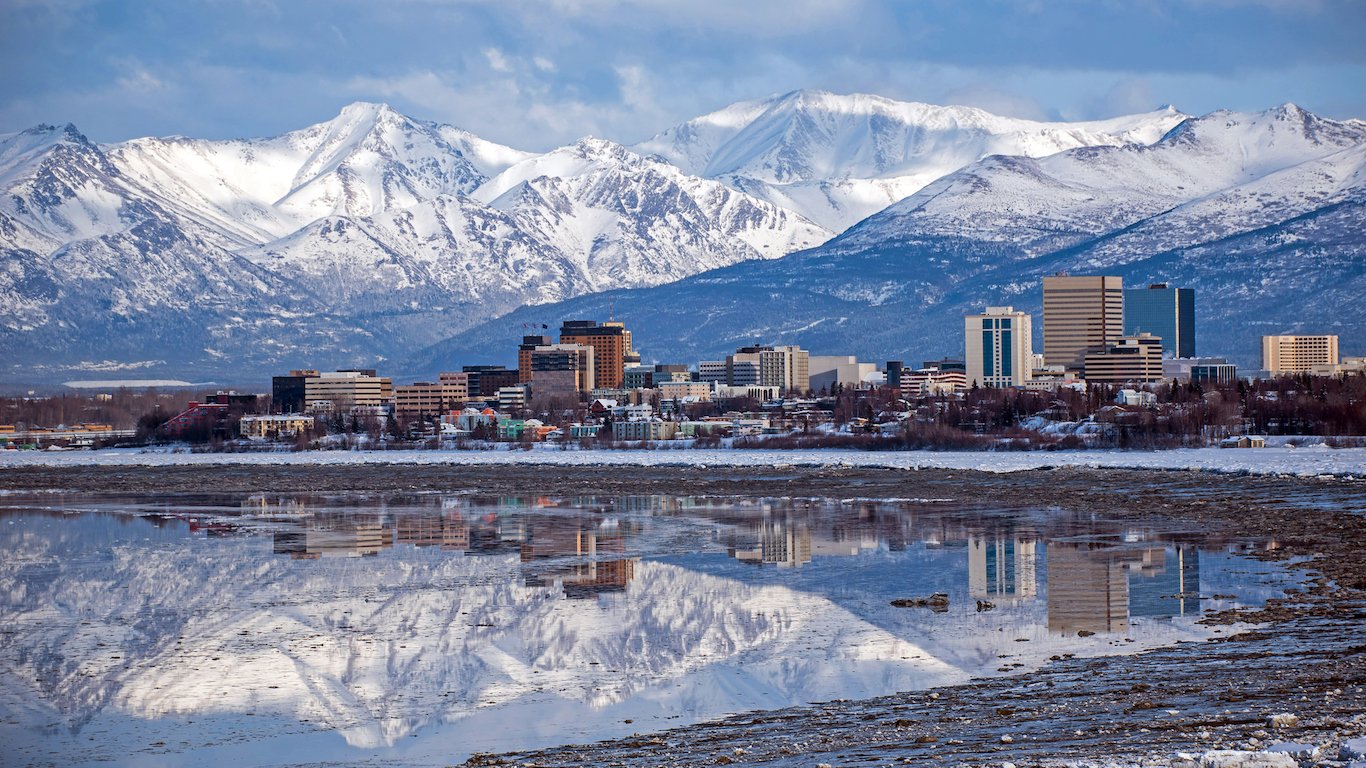
2. Alaska
> Worst city to live: Anchorage
> Population: 298,695
> Median home value: $302,500
> Poverty rate: 8.4%
> Adults with at least a bachelor’s degree: 35.6%
There were 730 violent crimes in Alaska for every 100,000 residents in 2015, more than in any other state in the country. Anchorage, the largest city in Alaska, is even more dangerous. There were 1,071 violent crimes in Anchorage for every 100,000 residents in 2015 — nearly three times the comparable U.S. violent crime rate.
Job growth in the city has also been relatively stagnant in recent years. The city netted no new jobs between 2013 and 2015. In comparison, employment climbed by 4.0% nationwide over the same period. For those with a job in the area, commute times tend to be relatively long. The average commuter in Anchorage spends about 20 minutes getting to work — compared to only 15 minutes in Juneau and 12 minutes in Fairbanks.
[recirclink id=405812]
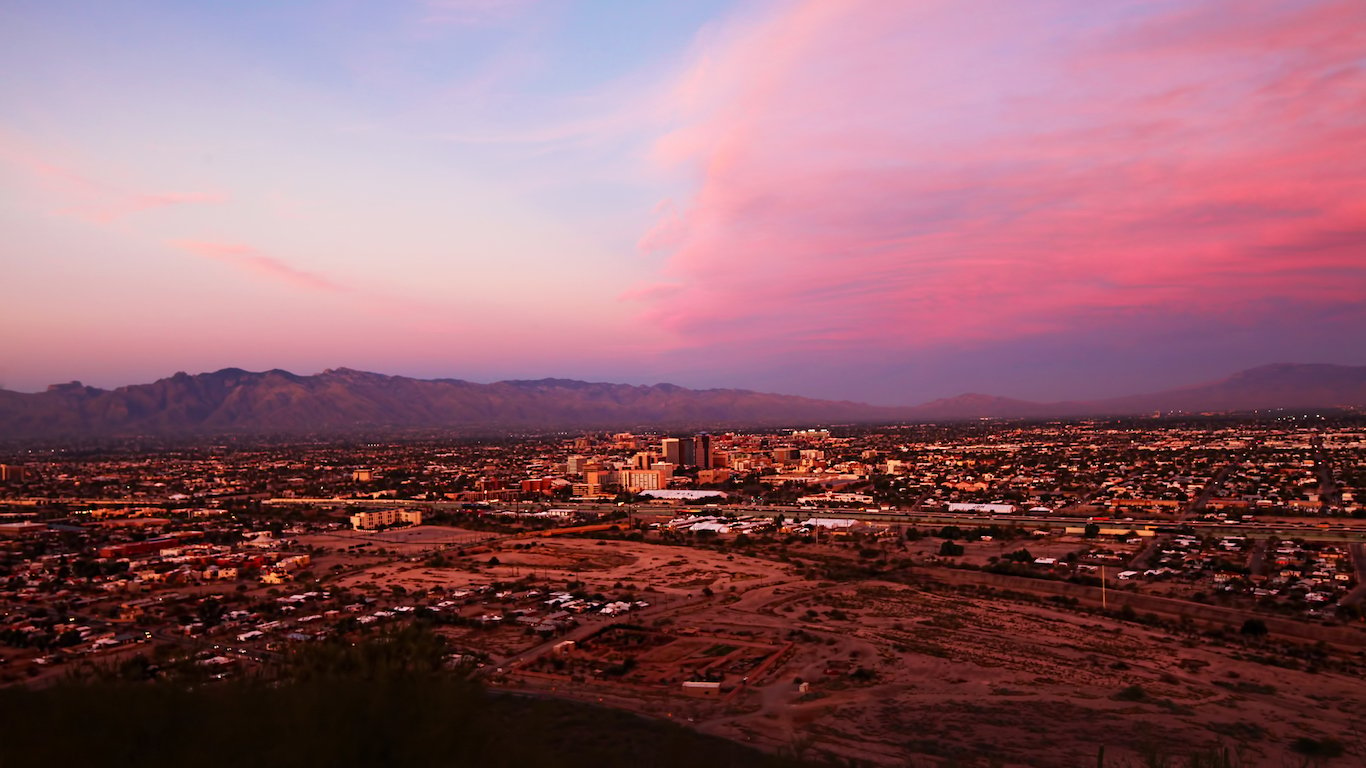
3. Arizona
> Worst city to live: Tucson
> Population: 531,674
> Median home value: $139,400
> Poverty rate: 25.2%
> Adults with at least a bachelor’s degree: 26.5%
Tucson’s poverty rate of 25.2% is the highest of any large city in Arizona and far higher than the 14.7% national poverty rate. Tucson’s economy has grown slower than that of most cities in recent years, and unemployment in the area remains slightly above the national rate. The number of jobs in Tucson rose by just 2.1% from 2013 to 2015, roughly half the national employment growth over the same period.
Tucson also struggles with one of the highest property crime rates in the country. There were 6,643 property crimes reported per 100,000 Tucson residents in 2015, more than double the national rate of 2,487 incidents per 100,000 Americans. According to one local criminologist, the high prevalence of property crime may be due to the transient nature of many Tucson residents. While the average American moves every 5.2 years, the average Tucson resident moves every 3.5 years. The population mobility makes it difficult to establish a strong community, which is one of the best defenses against property crime.
4. Arkansas
> Worst city to live: Fort Smith
> Population: 88,195
> Median home value: $116,300
> Poverty rate: 29.8%
> Adults with at least a bachelor’s degree: 19.0%
The typical Fort Smith household earns just $33,534 a year, far less than the $41,995 statewide median income and national median household income of $55,775. Additionally, 29.8% of Fort Smith residents live in poverty, well above Arkansas’ 19.1% poverty rate and nearly double the 14.7% U.S. poverty rate. One factor contributing to low earnings in Fort Smith may be the low educational attainment among city residents. Just 19.0% of adults in Fort Smith have a bachelor’s degree, the smallest share of any large Arkansas city and well below the 30.6% of adults nationwide.
Fort Smith is also relatively dangerous. There were 804 violent crimes and 5,893 property crimes per 100,000 city residents in 2015, well more than double the corresponding national rates of 373 violent crimes and 2,487 property crimes per 100,000 Americans.
[in-text-ad-2]

5. California
> Worst city to live: Merced
> Population: 82,440
> Median home value: $204,400
> Poverty rate: 35.1%
> Adults with at least a bachelor’s degree: 19.5%
Merced is located about 75 miles east of San Jose. While it does not face the same level of risk as those cities closer to the San Andreas fault, a serious earthquake is not out of the question for the California city. More tangible difficulties making the city a less than desirable place to live include an annual unemployment rate of 10.7%, one of the worst in both California and the nation as a whole. In addition, Merced’s poverty rate of 35.1% is the worst of any large California city and more than double the national rate of 14.7%.
Relative to the size of its population, Merced is generally lacking in amenities, including below average numbers of restaurants, bars, libraries, and museums per capita.
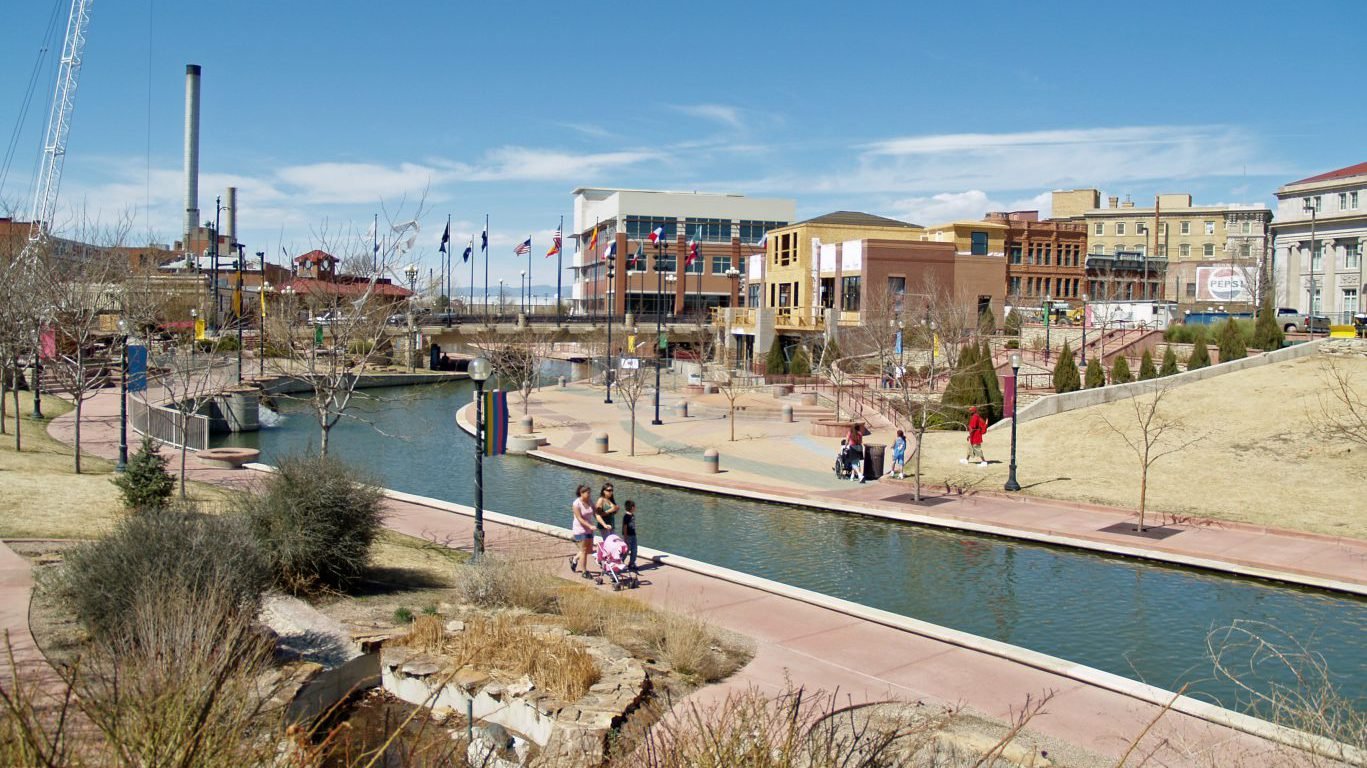
6. Colorado
> Worst city to live: Pueblo
> Population: 109,419
> Median home value: $124,700
> Poverty rate: 25.1%
> Adults with at least a bachelor’s degree: 18.4%
The presence of institutions of higher education — colleges and universities — can create employment opportunities and often results in greater regional educational attainment. There are just two colleges or universities in Pueblo County, among the least of any county when adjusted for population.
Just 18.4% of the adults living in Pueblo have a bachelor’s degree, far less than the 39.2% statewide college attainment rate. Lower education attainment rates often result in lower incomes, and Pueblo is no exception. One in four of Pueblo’s 109,000 residents live in poverty, the largest share of any large city in the state. Additionally, the typical household in the city earns only about $36,300 a year, or $27,600 less than the median household income across Colorado.
[in-text-ad]
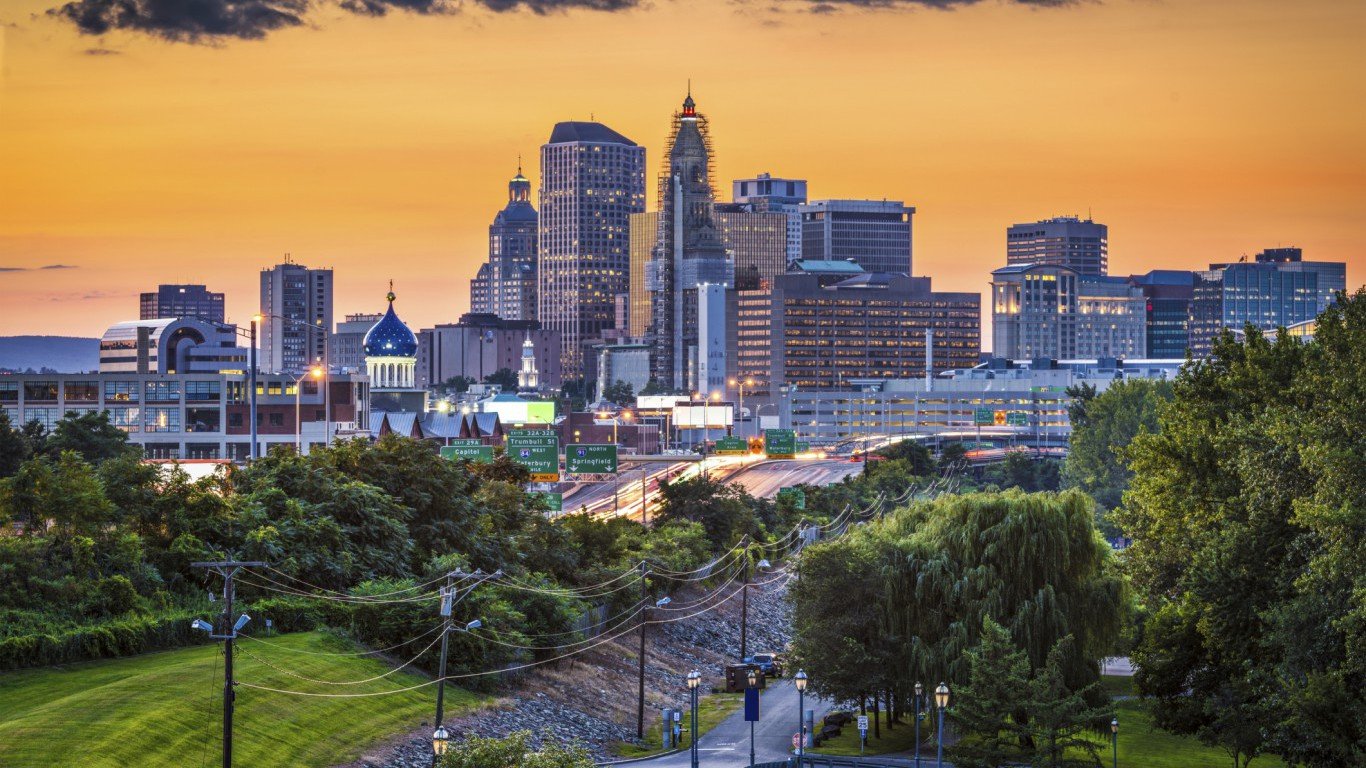
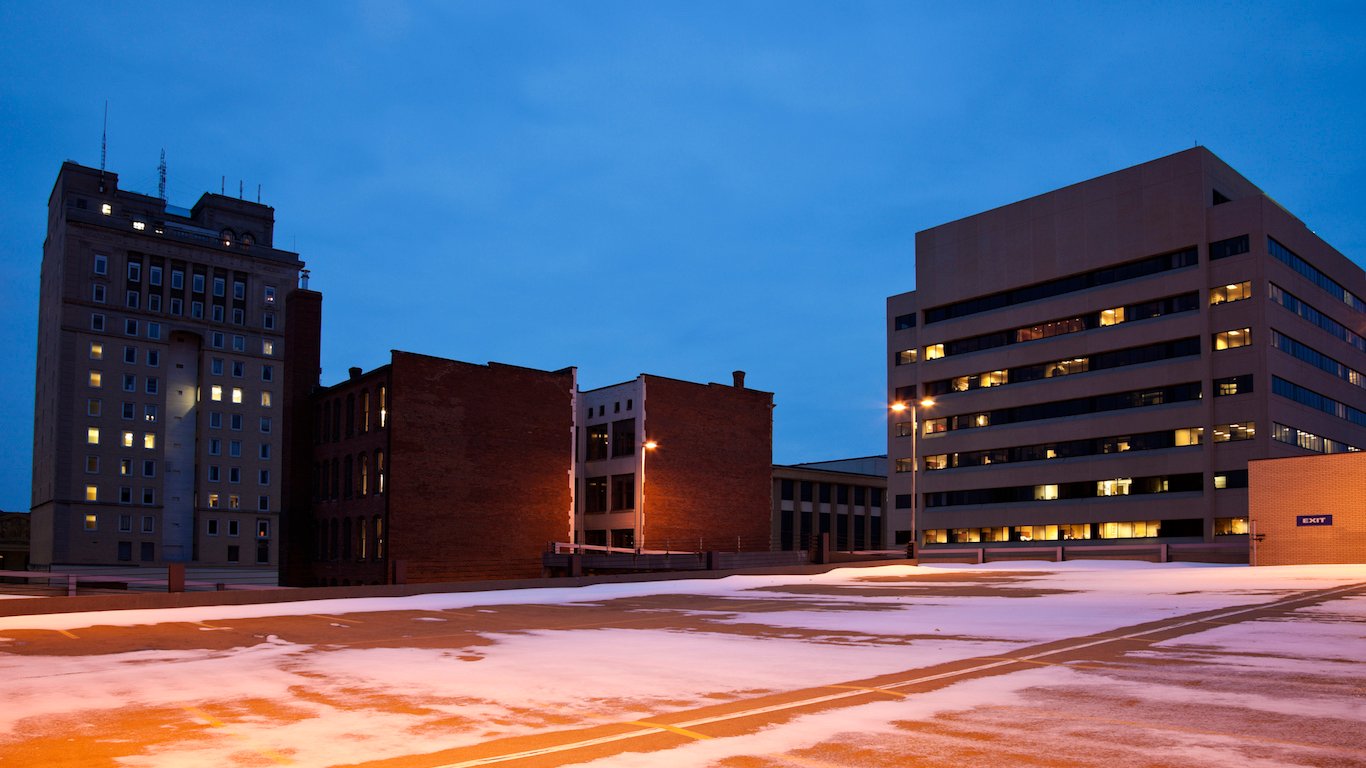
7. Connecticut
> Worst city to live: Hartford
> Population: 124,014
> Median home value: $159,200
> Poverty rate: 28.3%
> Adults with at least a bachelor’s degree: 16.9%
The population of many New England cities is shrinking as residents move south in favor of a low cost of living and good job market. Hartford is one such city. With goods and services costing 17 cents more on the dollar in Hartford than they do nationwide, the city is one of the most expensive in the country. Hartford also has one of the highest unemployment rates among major cities, comparable with Flint, Michigan and Compton, California. An estimated 10.4% of the Hartford labor force was unemployed in 2015, nearly double the 5.3% national figure. While the U.S. population grew 3.9% in the last five years, Hartford’s population declined by 0.7%.
Hartford’s economic decline has led to widespread crime and poverty. Some 28.3% of Hartford residents live below the poverty line, far more than the 10.5% statewide poverty rate. Additionally, there were 1,141 violent crimes per 100,000 Hartford residents in 2015, by far the most of any large Connecticut city and five times the corresponding statewide violent crime rate.
[recirclink id=427661]
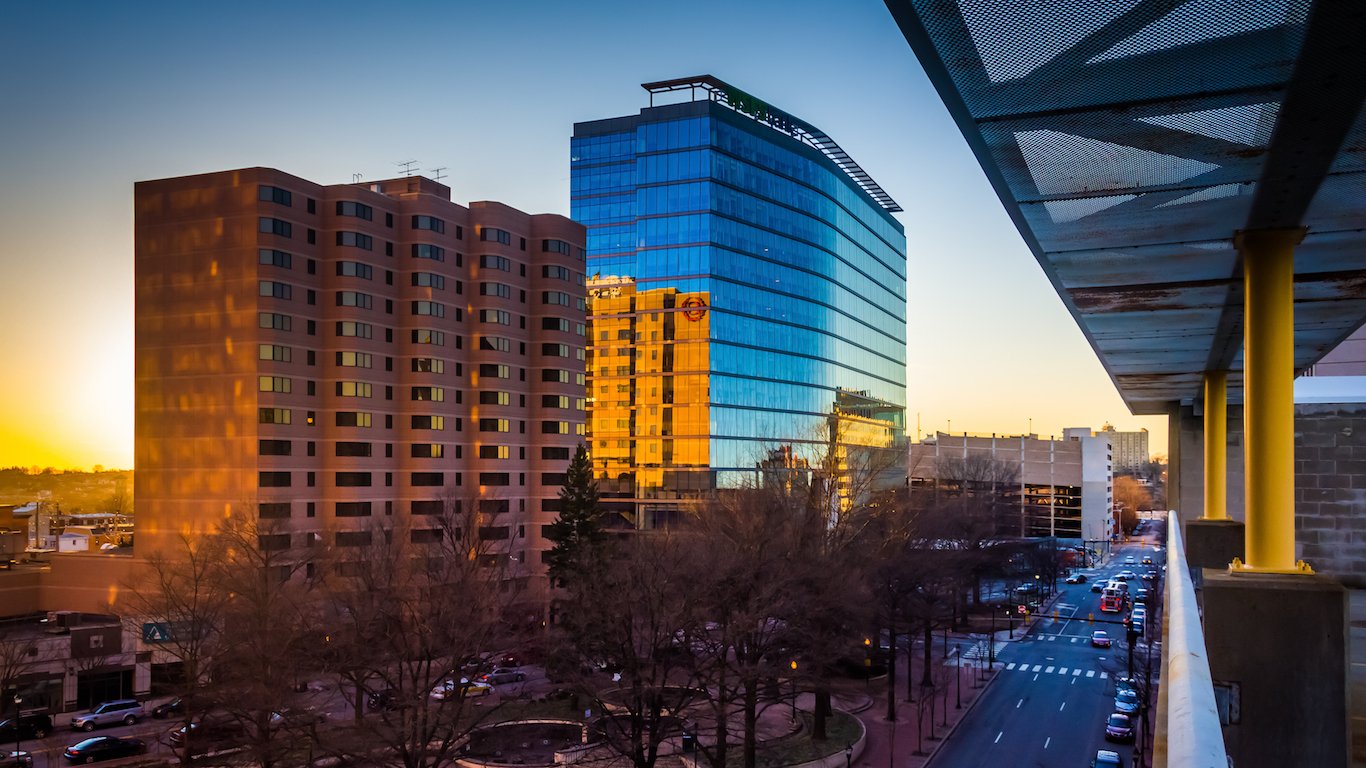
8. Delaware
> Worst city to live: Wilmington
> Population: 71,957
> Median home value: $160,300
> Poverty rate: 26.0%
> Adults with at least a bachelor’s degree: 25.4%
The typical Wilmington household earns $41,035 a year, far less than the median income statewide of $61,255. Adjusted for the city’s high cost of living — groceries cost 10% more in Wilmington than they do nationwide, housing costs 26% more, and utilities cost 37% more — real area incomes are even lower.
Poor cities with tough job markets tend to have the most crime, and Wilmington, where 26.0% of the population lives in poverty and 6.9% of the labor force is unemployed, is no exception. There were 1,708 violent crimes reported per 100,000 Wilmington residents in 2015, the fifth highest violent crime rate of any U.S. city.
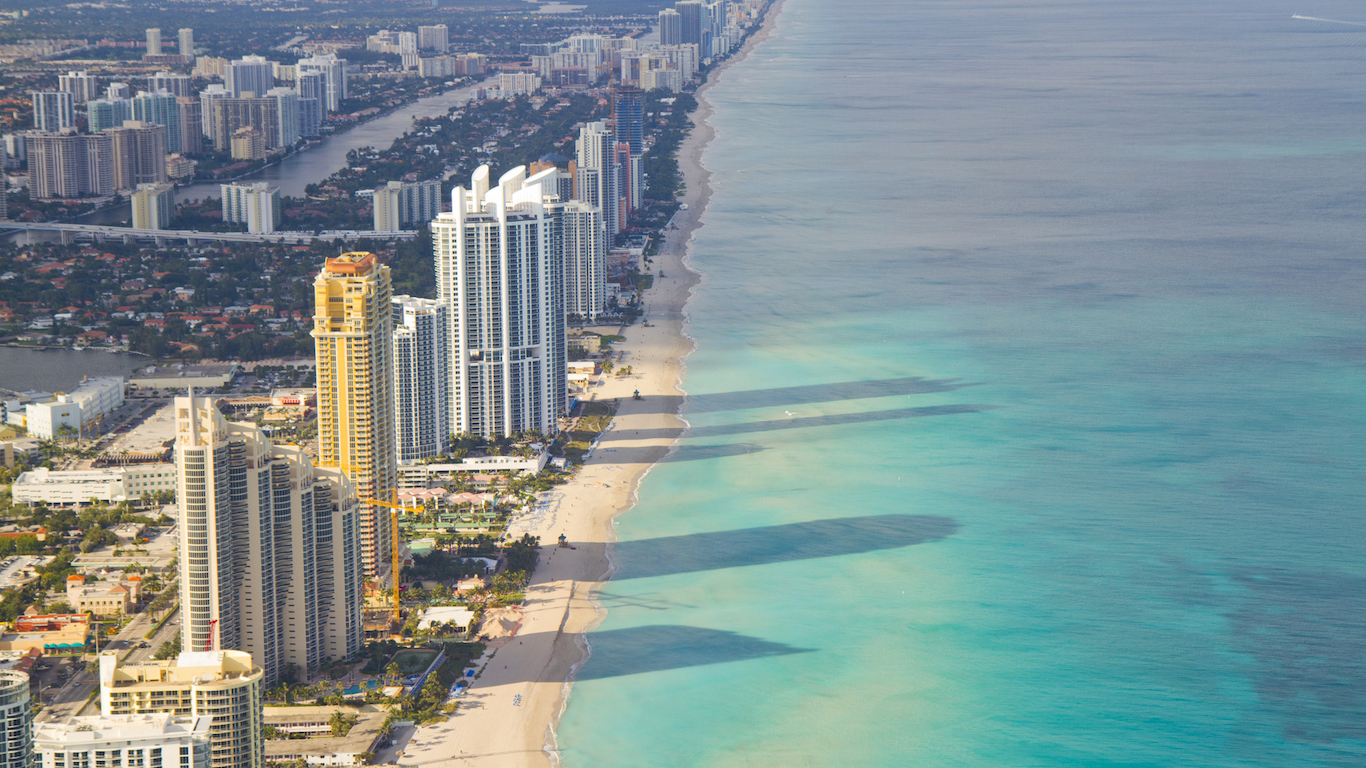
9. Florida
> Worst city to live: Miami Beach
> Population: 92,311
> Median home value: $460,000
> Poverty rate: 15.1%
> Adults with at least a bachelor’s degree: 48.1%
While Miami Beach has some of the most expensive homes in country, a large share of city residents earn poverty wages. Miami Beach has a long history of segregation, which has contributed to income inequality throughout the city. While 9.9% of households in Miami Beach earn less than $10,000 annually, 13.7% of households earn at least $200,000 — each larger than the corresponding national shares.
The typical household in Miami Beach earns $50,937 annually, slightly less than the $55,775 national figure. Adjusted for the city’s high cost of living, however, area incomes are far lower. The typical home in Miami Beach costs $460,000, nine times the city’s median household income. In addition to being one of the least affordable cities in Florida and the U.S., Miami Beach is one of the most dangerous. There were 1,077 violent crimes per 100,000 residents in 2015, among the most of any city and more than double the statewide violent crime rate. There were also 9,717 property crimes per 100,000 Miami Beach residents, the highest property crime rate among large cities nationwide.
[in-text-ad-2]
10. Georgia
> Worst city to live: Albany
> Population: 71,109
> Median home value: $92,600
> Poverty rate: 32.0%
> Adults with at least a bachelor’s degree: 19.0%
Population trends are indicative of the desirability of a city. New residents are often attracted by a healthy economy and job market, while residents tend to desert areas with a poor economy, a high crime rate, and widespread poverty. As the national population expanded by 3.9% over the last five years, Albany’s population declined by 10%, the steepest drop of any large city in Georgia.
This decline appears to reflect some of the problems the southern Georgia city faces. The city’s annual unemployment rate is 7.9%, the highest in the state, and well above the 5.3% national unemployment rate. Additionally, 32% of the city’s population lives in poverty, well above the 17% statewide poverty rate.
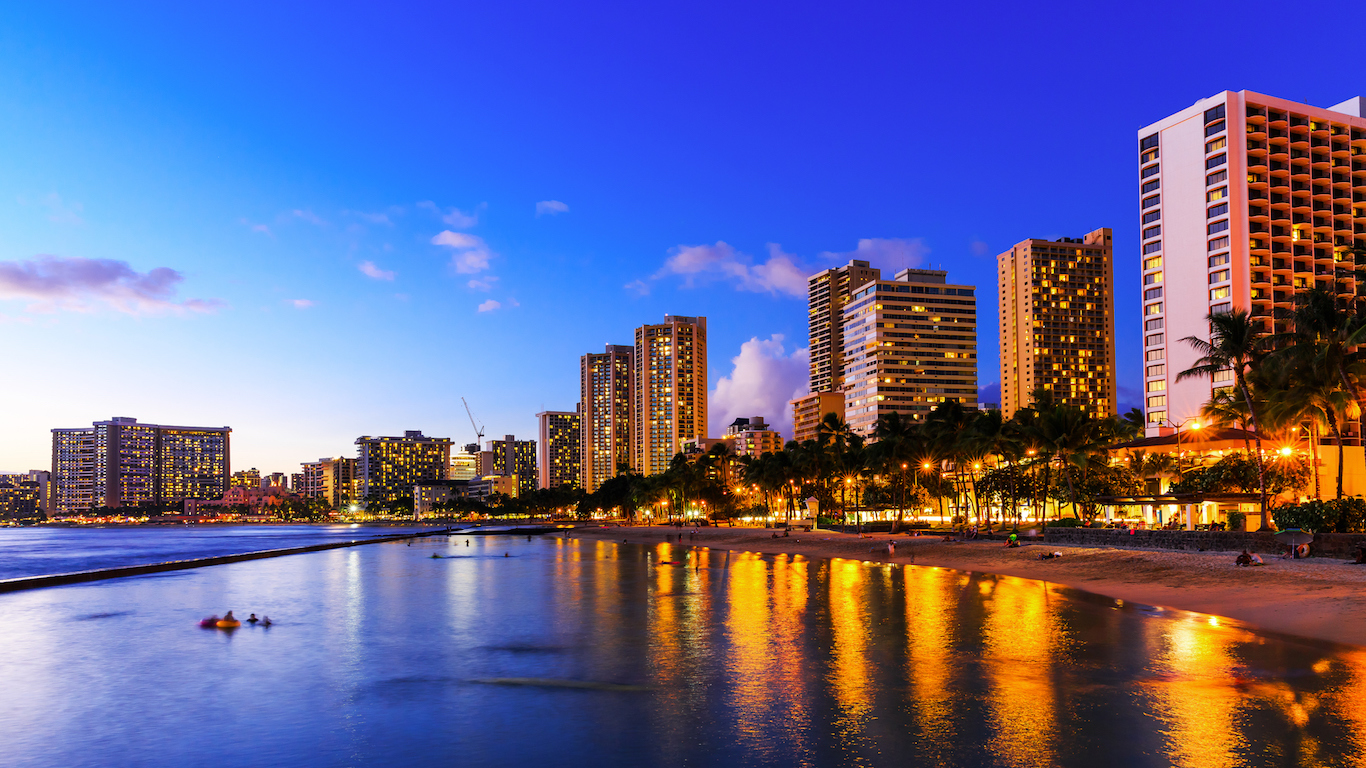
11. Hawaii
> Worst city to live: Urban Honolulu
> Population: 347,973
> Median home value: $584,200
> Poverty rate: 12.0%
> Adults with at least a bachelor’s degree: 35.2%
Urban Honolulu is the least affordable city in Hawaii and one of the least affordable in the country. The typical area home is worth $584,200 — or 9.5 times the median household income in the area. In comparison, homes in nearby Pearl City are worth about 6.9 times the area’s median household income. Nationwide, the median home value is only 3.5 times the typical income.
Despite ranking as the worst city in Hawaii, the broader Urban Honolulu metro area is safer than the state as a whole. There were 244 violent crimes for every 100,000 Honolulu residents in 2015, compared to 293 violent crimes per 100,000 residents across the state.
[in-text-ad]

12. Idaho
> Worst city to live: Nampa
> Population: 89,850
> Median home value: $132,900
> Poverty rate: 17.4%
> Adults with at least a bachelor’s degree: 18.2%
A larger share of Nampa residents face financial hardship than elsewhere in Idaho. The typical household in Nampa earns only $40,884 a year — about $14,000 less than the median income in nearby Meridian, and $7,400 less than the median income across Idaho. Additionally, 17.4% of Nampa’s population lives in poverty, the highest share of any large Idaho city, and well above the 15.1% statewide poverty rate.
As is the case with many cities on this list, Nampa is also relatively dangerous. There were 351 violent crimes for every 100,000 people in the city in 2015, compared to 216 statewide.
[recirclink id=405297]
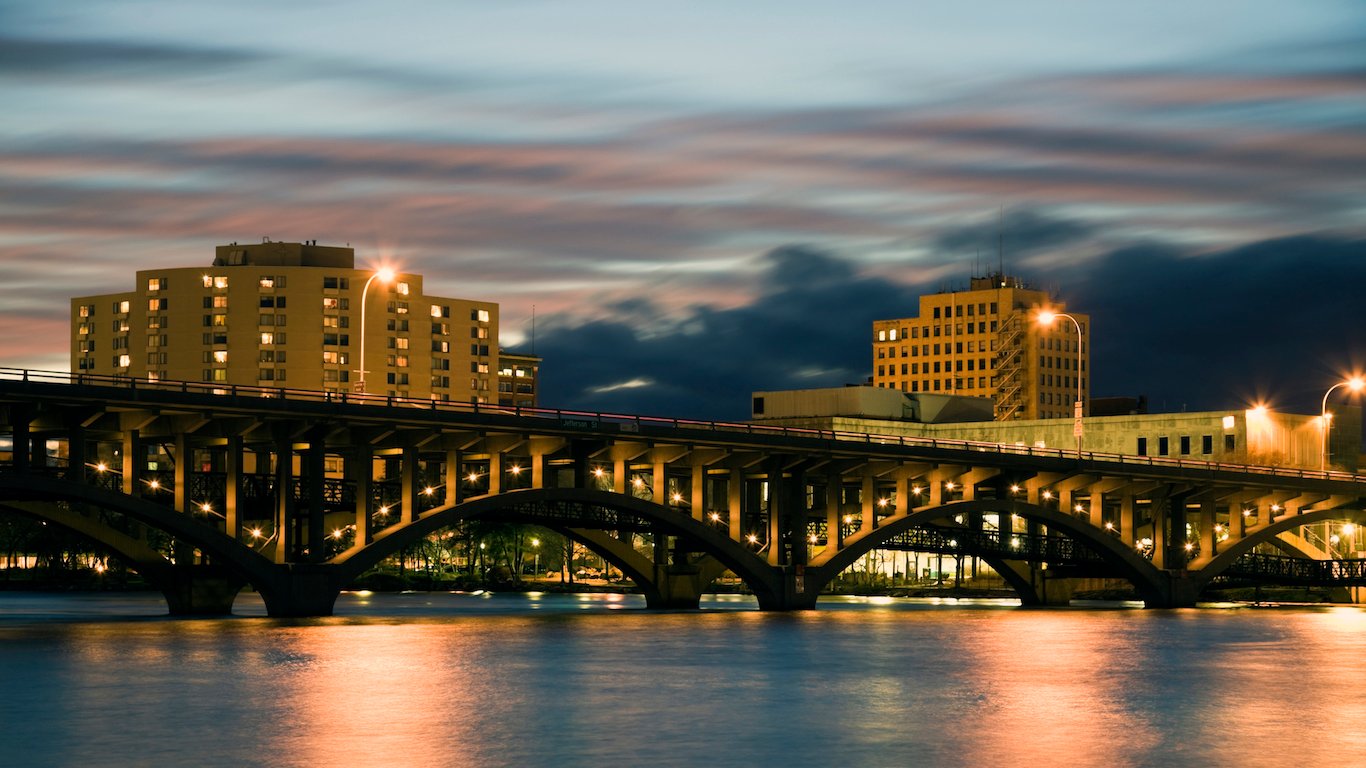
13. Illinois
> Worst city to live: Rockford
> Population: 149,346
> Median home value: $87,200
> Poverty rate: 22.4%
> Adults with at least a bachelor’s degree: 20.9%
Property is very inexpensive in Rockford, Illinois. The typical home is worth just $87,200, well below the statewide median home value of $180,300. While affordable housing can be positive for residents looking to buy a home, as demonstrated in Rockford, it is often indicative of economic and social difficulties. Some 8.3% of the city’s workforce is out of a job, and 22.4% of area residents live below the poverty line — each well above the corresponding 5.9% and 12.6% statewide shares.
Like many of the cities on this list, Rockford also struggles with crime. The northern Illinois city’s annual violent crime rate of 1,585 incidents for every 100,000 residents is the worst in the state and over four times the national violent crime rate.

14. Indiana
> Worst city to live: Gary
> Population: 77,354
> Median home value: $68,000
> Poverty rate: 29.8%
> Adults with at least a bachelor’s degree: 12.6%
A the typical home in Gary, Indiana is worth only $68,000, the lowest median home value of any large city in the state and eighth lowest in the country. The low property values are likely the result, in part, of the city’s dwindling population. Over the past decade, Gary’s population has fallen by 20.3%, the steepest drop of any U.S. city over that period.
A stagnant job market is not helping economic conditions in Gary. Nearly one in every 10 workers in the city are out of a job, more than double the 4.8% statewide unemployment rate. The bleak economic picture is underscored by the relative lack of small businesses such as restaurants, bodegas, and cafes. There are only about 80 of these establishments for every 100,000 city residents, one of the smallest concentrations of any large city and well below the 165 per 100,000 nationwide concentration.
[in-text-ad-2]

15. Iowa
> Worst city to live: Des Moines
> Population: 210,317
> Median home value: $119,500
> Poverty rate: 16.6%
> Adults with at least a bachelor’s degree: 26.1%
The cost of living in Des Moines is relatively low. Goods and services cost only about 81% of what they do nationwide on average. In contrast to the relatively low price of groceries, transportation, and utilities, however, the area has high property taxes. The typical homeowner pays 2.1% of their home value in taxes — more than any other major city in the state and well above the 1.2% effective statewide rate.
Iowa’s capital city also suffers from high crime rates. There were 714 violent crimes and 4,011 property crimes in Des Moines for every 100,000 residents in 2015, well above the comparable crime rates of 373 nationally and 286 statewide.
16. Kansas
> Worst city to live: Kansas City
> Population: 151,261
> Median home value: $87,600
> Poverty rate: 22.2%
> Adults with at least a bachelor’s degree: 16.3%
While low property values can help make homeownership a reality for lower income individuals, cheap housing is also indicative of a weak economy and poor living conditions — and this appears to be the case in Kansas City. The typical home in the city is worth just $87,600, far less than the $141,200 median home value in Kansas.
Relative to the size of its population, Kansas City has very few amenities and attractions that might enrich the lives of residents. There are fewer bars, libraries, recreational centers, museums, and hotels per capita in Kansas City than there are in the U.S. as a whole. There are just 120 restaurants per 100,000 Kansas City residents, among the lowest concentrations of food establishments of any large U.S. city.
[in-text-ad]
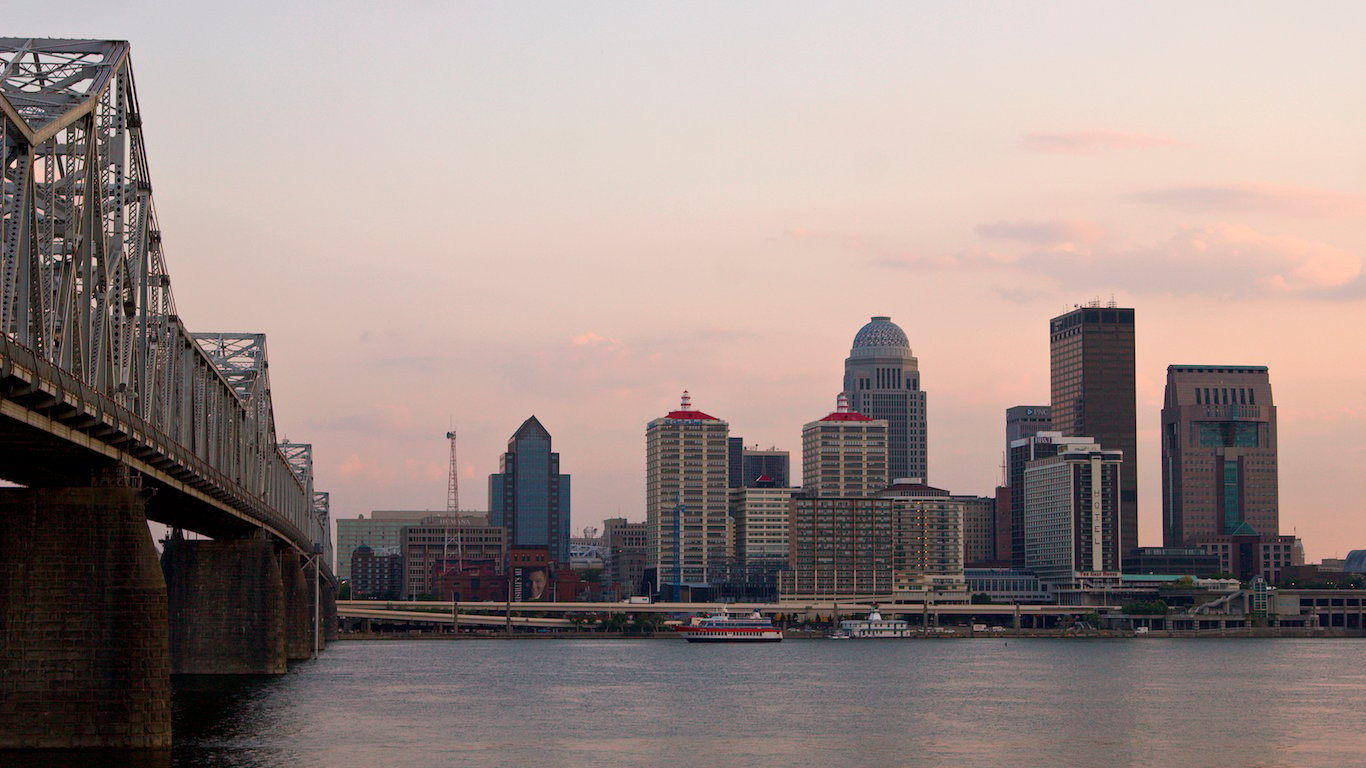
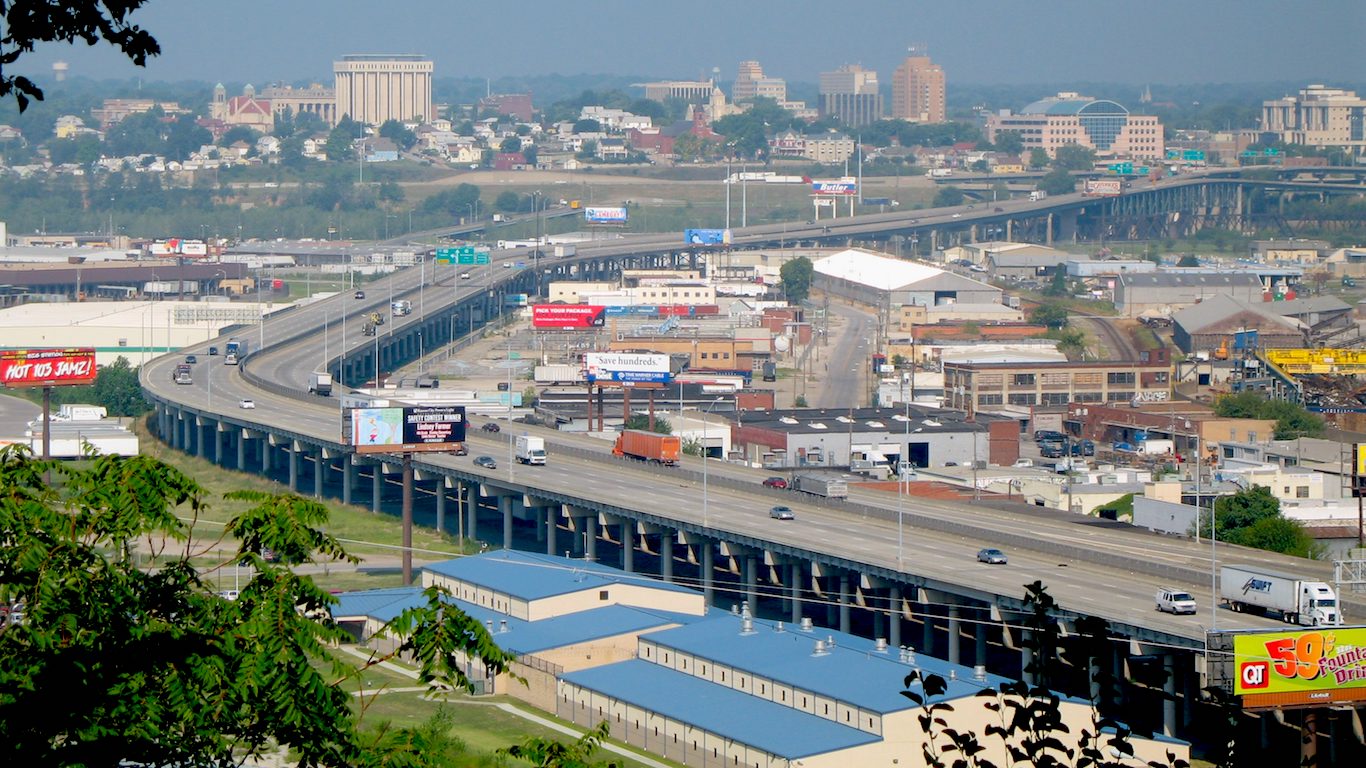
17. Kentucky
> Worst city to live: Louisville/Jefferson County
> Population: 615,389
> Median home value: $145,000
> Poverty rate: 16.7%
> Adults with at least a bachelor’s degree: 30.1%
Although Louisville’s 4.9% 2015 unemployment rate is lower than the state’s 5.4% rate, it may not remain that way for long. The city lost 1.3% of its jobs between 2013 and 2015 — a steeper employment decline than in all but a few major U.S. cities. High crime rates in the area may be taking a toll on the local economy. There were 632 violent crimes — murder, rape, robbery, and aggravated assault — for every 100,000 Louisville residents in 2015, nearly triple the state’s violent crime rate that year.
Louisville residents also cope with more air pollution than most Americans. Air quality is considered hazardous for at least part of about 8.8% of days a year, compared to an average of 5.9% of days nationwide.
[recirclink id=427661]
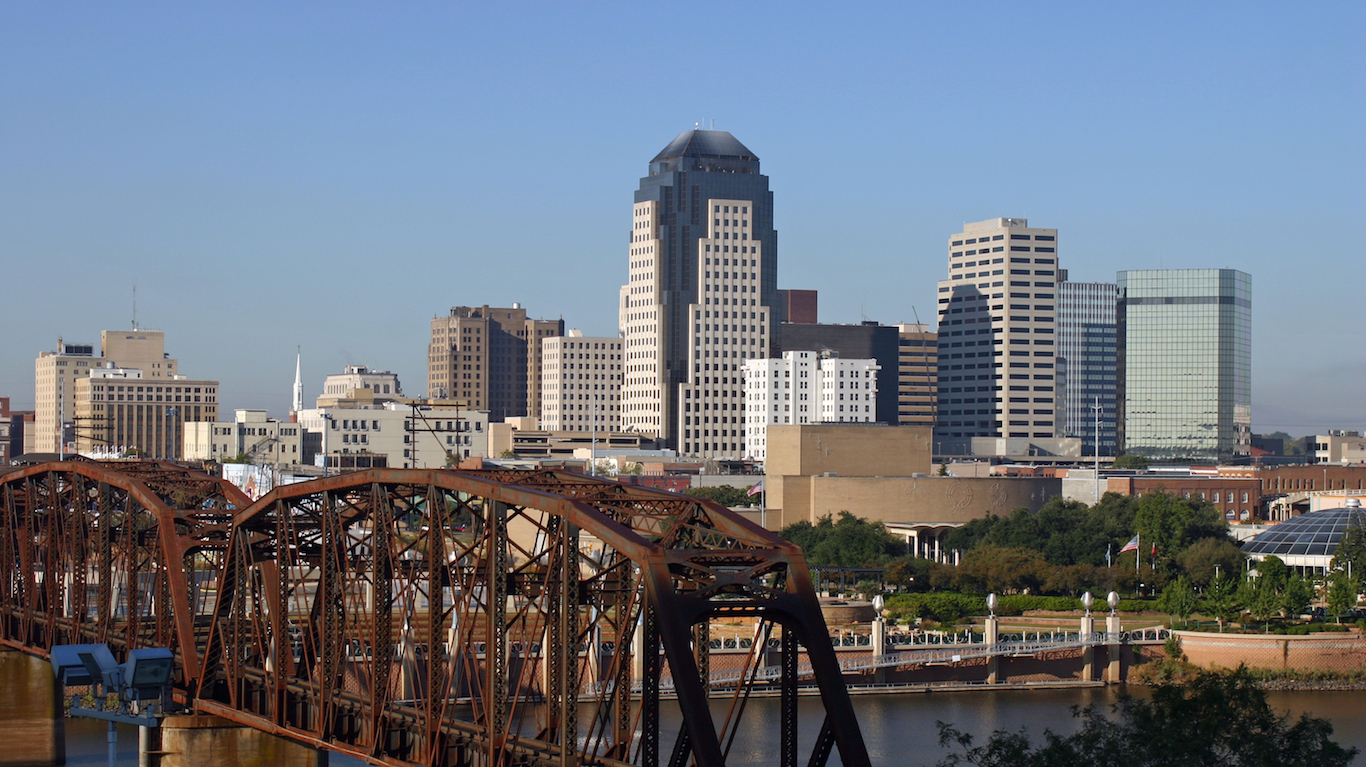
18. Louisiana
> Worst city to live: Shreveport
> Population: 196,994
> Median home value: $141,000
> Poverty rate: 23.4%
> Adults with at least a bachelor’s degree: 24.9%
By many measures of quality of life, Shreveport is the worst large city to live in Louisiana and among the worst nationwide. While the city’s economy thrived in the first half of the 20th century due to an active oil industry, today Shreveport’s economy is largely service-based and is battling high unemployment. The city’s 2015 unemployment rate of 7.1% is far higher than the state’s unemployment rate of 6.3% and the national rate of 5.3%.
In addition to high unemployment, Shreveport struggles with high crime and widespread poverty. There were 819 violent crimes reported per 100,000 residents in Shreveport in 2015, more than twice the national crime rate of 373 incidents per 100,000 Americans. Also, 23.4% of Shreveport residents live in poverty compared to 14.7% of Americans nationwide.

19. Maine
> Worst city to live: Lewiston
> Population: 36,356
> Median home value: $144,300
> Poverty rate: 23.1%
> Adults with at least a bachelor’s degree: 16.3%
Higher educational attainment rates are tied to higher incomes and better overall economic conditions. In Lewiston, only 16.3% of adults have at least a bachelor’s degree — well below the 30.1% rate across the state. Similarly, some 23.1% of the Lewiston population lives below the poverty line, compared to only 13.4% of Maine’s total population.
Lewiston is also slightly more dangerous than the state as a whole. There were 188 violent crimes for every 100,000 city residents in 2015, compared to only 130 per 100,000 residents across the state.
[in-text-ad-2]

20. Maryland
> Worst city to live: Baltimore
> Population: 621,849
> Median home value: $155,600
> Poverty rate: 22.9%
> Adults with at least a bachelor’s degree: 29.9%
Baltimore is far and away the most dangerous large city in Maryland and one of the most dangerous in the United States. The city’s murder rate hit an all time high in 2015. That year, there were 1,536 violent crimes in the city for every 100,000 residents, the eighth highest violent crime rate of any U.S. city and more than triple Maryland’s violent crime rate of 457 incidents per 100,000 people. The violence may have been partly fueled by the influx of drugs on the street following the looting of pharmacies during the unrest sparked by the police killing of Freddie Gray.
The record year in crime in the city may also be due in part to economic and social disparities. Some 22.9% of Baltimore’s population lives below the poverty line, more than double the 9.7% poverty rate across Maryland.

21. Massachusetts
> Worst city to live: Springfield
> Population: 154,336
> Median home value: $146,700
> Poverty rate: 27.3%
> Adults with at least a bachelor’s degree: 17.5%
Springfield is one of the poorest cities in Massachusetts. A typical city household earns just $38,398 a year, about $32,200 less than the typical Massachusetts household. The city’s poverty rate of 27.3% is the highest in the state and nearly double the national poverty rate.
Springfield also has one of the worst job markets in the country. The city’s two-year job growth is below average, and its unemployment rate of 9.3% is tied for 16th highest out of the 551 U.S. cities reviewed.
[in-text-ad]
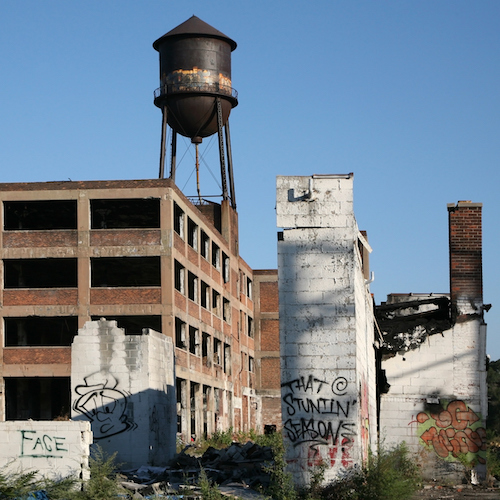
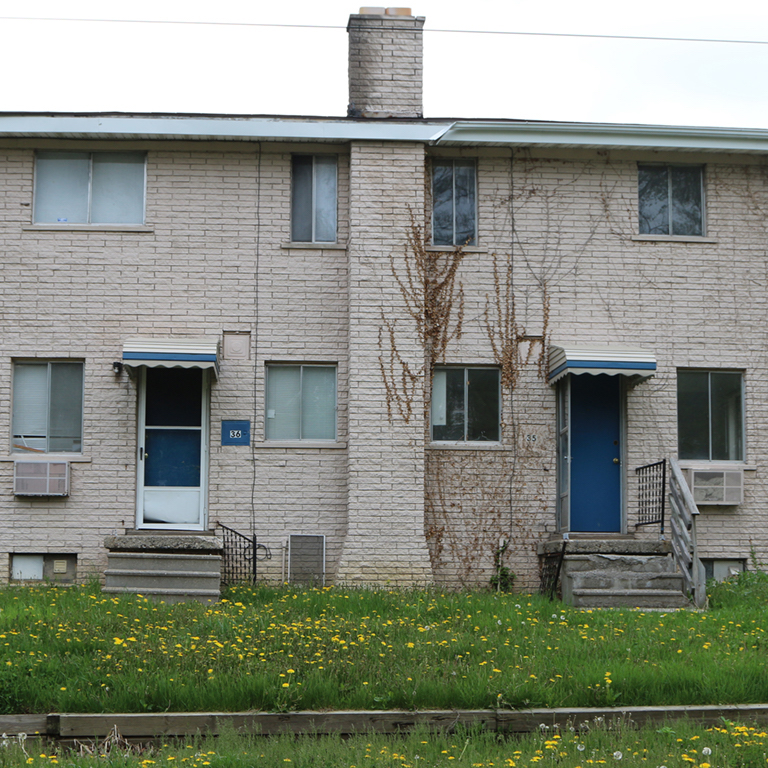
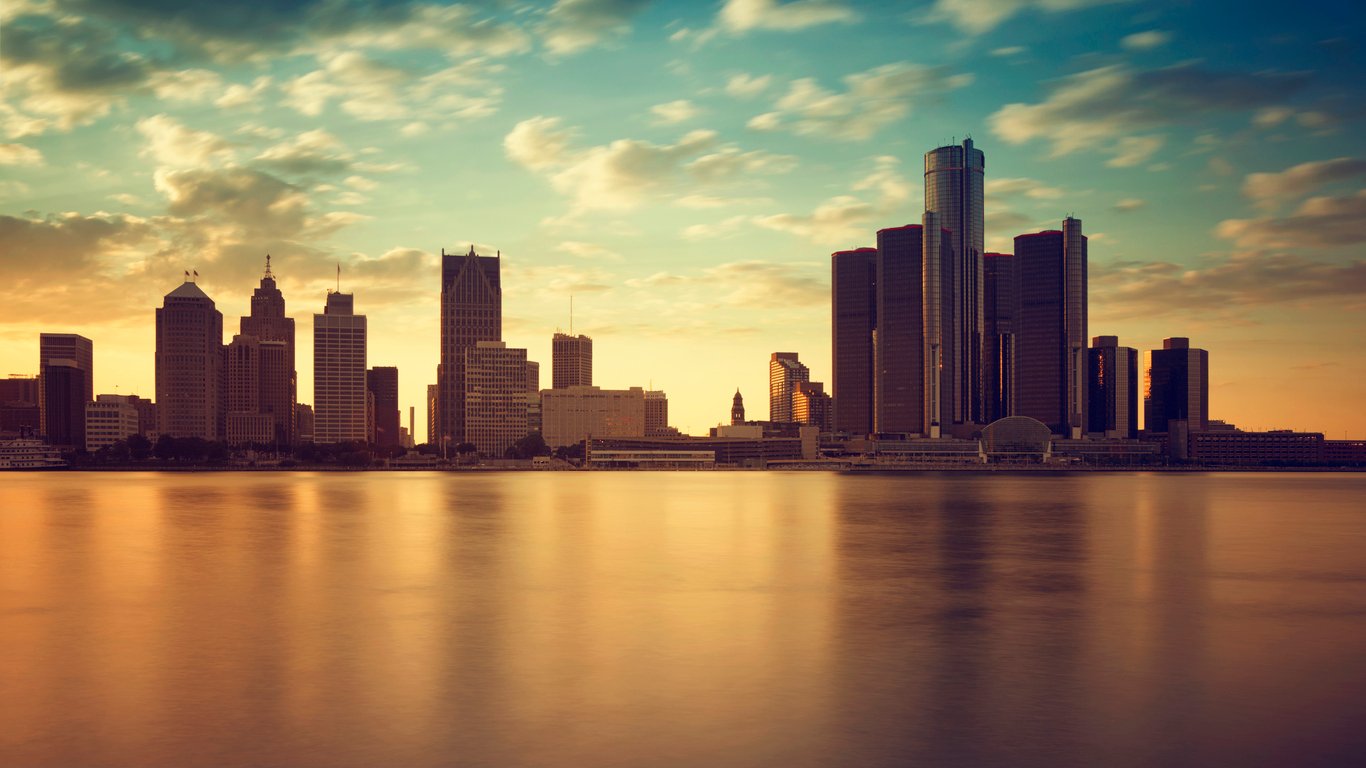
22. Michigan
> Worst city to live: Detroit
> Population: 677,124
> Median home value: $42,600
> Poverty rate: 39.8%
> Adults with at least a bachelor’s degree: 14.2%
Once the fourth largest city by population and wealthiest by income per capita, Detroit’s economic decline over the past several decades may be the largest of any U.S. city. Detroit’s population is a fraction of what it was at its 1950 peak of 1.8 million people, and it continues to decline at a near nation-leading pace. The number people living in Detroit fell 19% over the past 10 years to just 677,124 today, the largest population decline of any city in the state. The typical Detroit household earns just $25,980 a year, about half the $51,084 national median household income.
There were 1,760 violent crimes reported per 100,000 Detroit residents in 2015, the highest violent crime rate in Michigan and the second highest of any U.S. city. Crime and overall urban decay have depressed real estate prices in the city to a fraction of their former value. The typical occupied home in Detroit is worth just $42,600, the lowest median home value of any city other than nearby Flint, Michigan.
[recirclink id=404837]
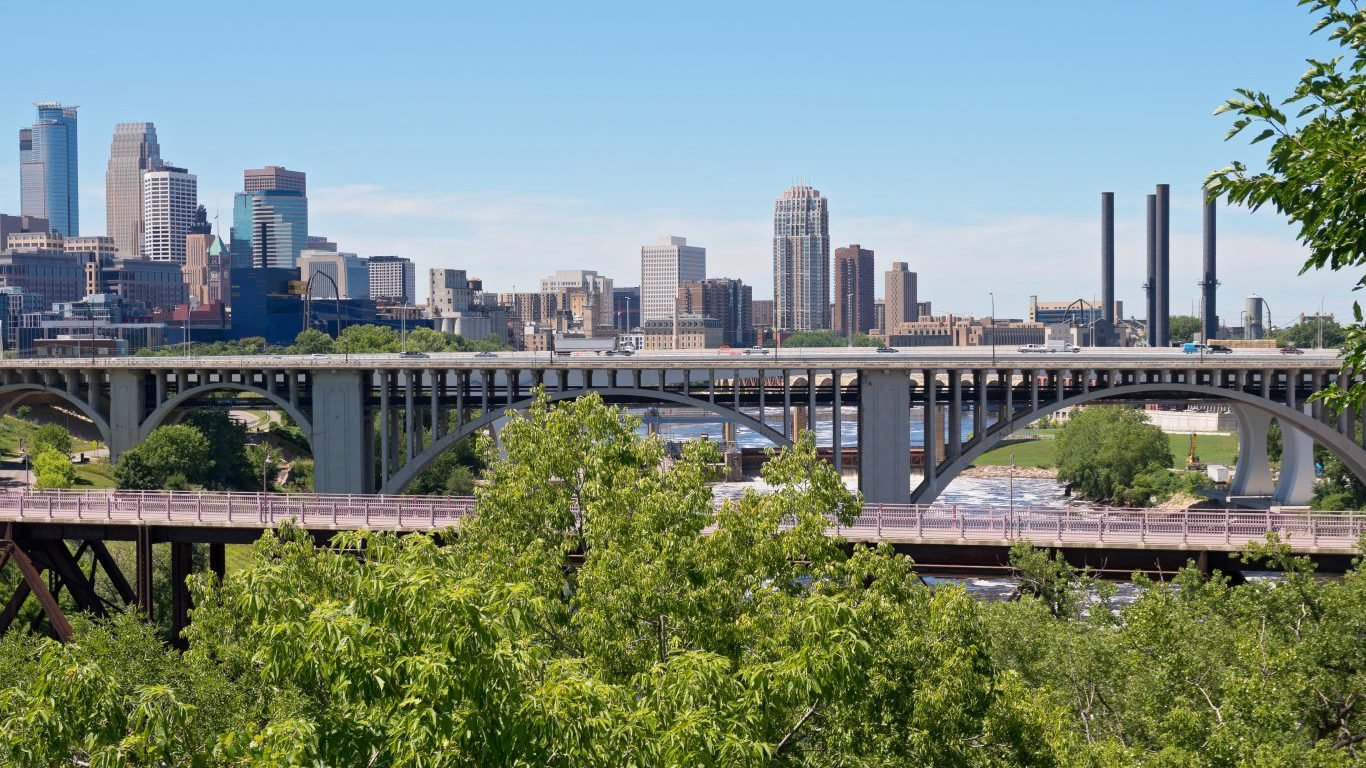
23. Minnesota
> Worst city to live: Minneapolis
> Population: 410,935
> Median home value: $227,500
> Poverty rate: 19.5%
> Adults with at least a bachelor’s degree: 48.3%
Some 19.5% of Minneapolis residents live below the poverty line, nearly double the 10.2% statewide rate. A high cost of living puts greater strain on the city’s poorest residents. Goods and services in Minneapolis are about 4.3% more expensive than they are on average nationwide.
Perhaps the biggest factor undermining quality of life in Minneapolis, however, is the prevalence of crime. There were 1,063 violent crimes in the city for every 100,000 people in 2015 — by far the most of any major city in the state and more than quadruple the violent crime rate across Minnesota.
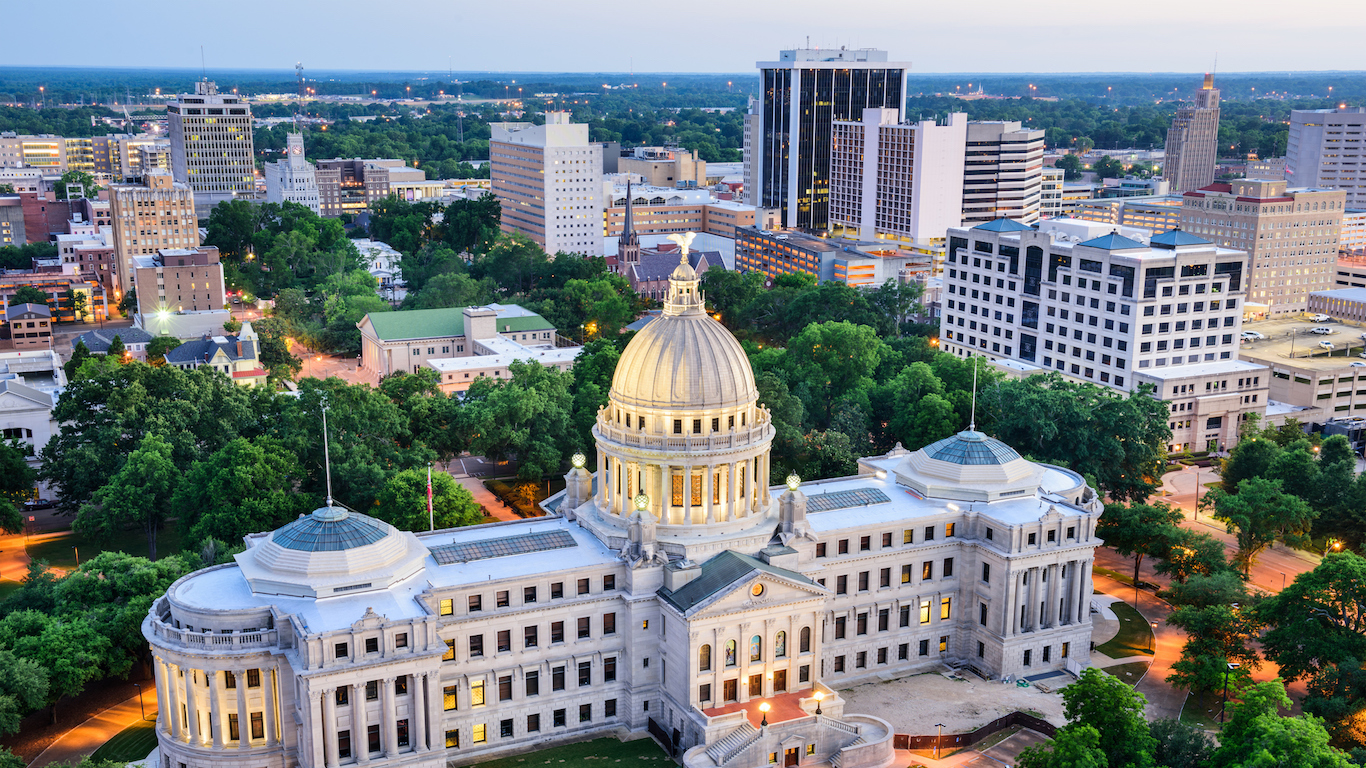
24. Mississippi
> Worst city to live: Jackson
> Population: 170,811
> Median home value: $92,600
> Poverty rate: 31.7%
> Adults with at least a bachelor’s degree: 26.9%
Mississippi lags behind most of the country in many socioeconomic measures, and Jackson, the state capital, is the state’s worst city to live in. Jackson has fewer bars, libraries, recreational centers, and movie theaters per capita than the U.S. as a whole, and is home to some of the cheapest real estate in the country. The median home value in Jackson is just $92,600, less than half the $194,500 national figure and slightly less than the $112,700 median home value statewide. Additionally, 31.7% of the Jackson population lives in poverty, more than twice the 14.7% national rate and considerably more than the state’s 22.0% poverty rate.
Jackson is also the most dangerous large city in Mississippi. There were 921 violent crimes in Jackson in 2015 for every 100,000 residents, more than triple the statewide violent crime rate.
[in-text-ad-2]
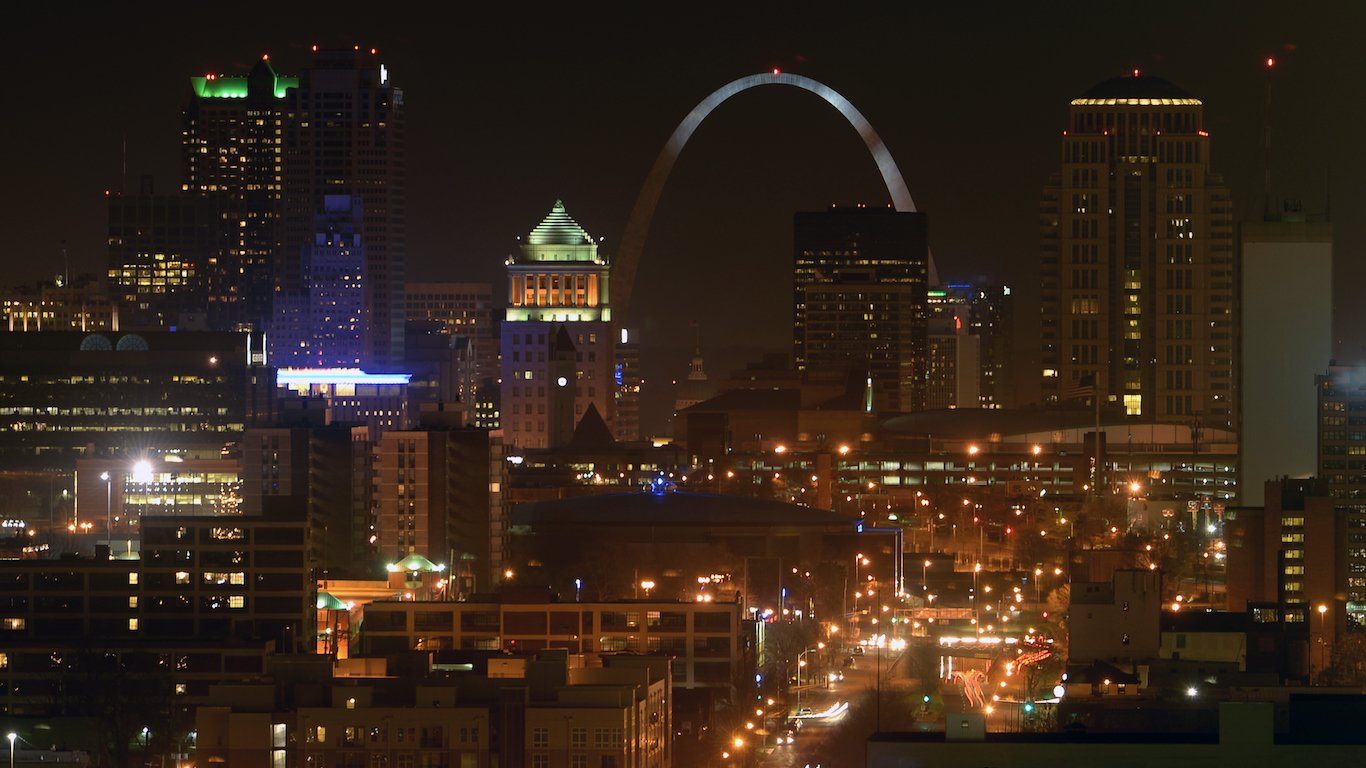
25. Missouri
> Worst city to live: St. Louis
> Population: 315,685
> Median home value: $130,800
> Poverty rate: 24.9%
> Adults with at least a bachelor’s degree: 34.7%
St. Louis is representative of the economic decline that afflicted many large industrial cities over the latter part of the 20th century. Decades of manufacturing decline, white flight, and exclusionary zoning in St. Louis have led to some of the worst urban decay, racial segregation, and income inequality of any major city today. Some 24.9% of St. Louis residents live in poverty, far more than the 14.8% statewide poverty rate. St. Louis has struggled with a high crime rate since the 1960s and today has the highest violent crime rate of any large U.S. city. There were 1,817 violent crimes reported per 100,000 St. Louis residents in 2015, nearly five times the national rate.
Many of the economic problems in St. Louis are tied to the city’s rapid population decline. The city’s population is less than half of what it was during its 1950 peak of 860,000 people, and it continues to decline today. While the U.S. population grew 11.5% over the last 10 years, the number of residents in St. Louis fell 5.4%.

26. Montana
> Worst cwity to live: Missoula
> Population: 71,024
> Median home value: $239,500
> Poverty rate: 17.4%
> Adults with at least a bachelor’s degree: 46.5%
Relatively low incomes in Missoula make the city unaffordable for many residents. The median household income in Missoula is $37,444, well below the statewide median income of $49,509. At the same time, the typical area home is worth $239,500 — or $30,000 more than the typical home in Montana. Indeed, the typical American home is worth about 3.5 times the typical household income, while Missoula’s comparable affordability ratio is 6.4.
Missoula is more expensive and also more dangerous than the state as a whole. There were 527 violent crimes in the city for every 100,000 residents in 2015 — well above Montana’s violent crime rate of 350 incidents per 100,000 residents that same year.
[in-text-ad]
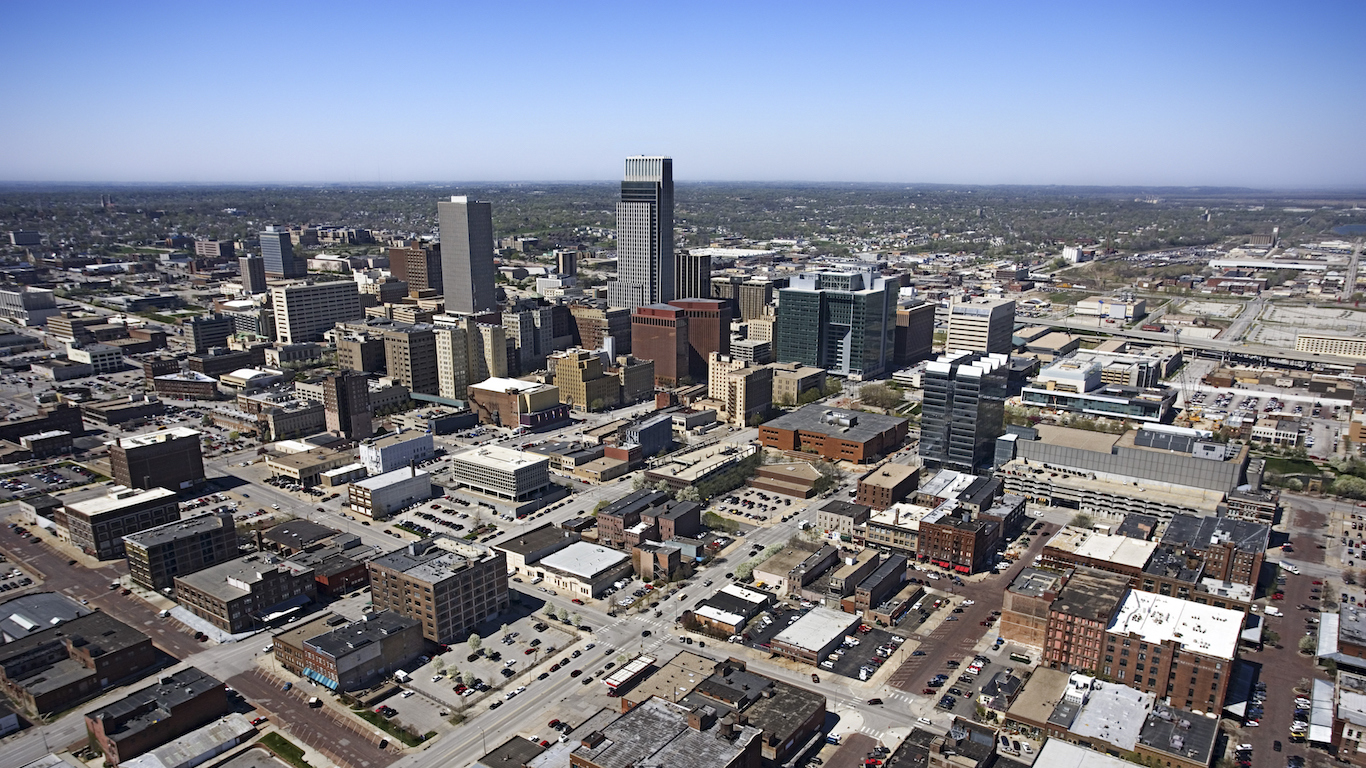
27. Nebraska
> Worst city to live: Omaha
> Population: 443,887
> Median home value: $143,200
> Poverty rate: 16.8%
> Adults with at least a bachelor’s degree: 34.8%
Although it ranks as the worst city in Nebraska to live in, Omaha is still among the top choices in the Plains region among major cities. Goods and services are about 7% less expensive in Omaha than they are nationwide. After adjusting for the city’s low cost of living, the median household income in the area is $55,300 — roughly in line with the typical U.S. household. Additionally, most people in Omaha who want jobs, have them. Only 2.5% of the area’s labor force is unemployed, a smaller share than in all but three other cities nationwide.
A slightly higher than usual violent crime rate is one issue Omaha residents struggle with. There were 515 violent crimes in the city for every 100,000 residents in 2015, well above the statewide rate of 275.
[recirclink id=427661]

28. Nevada
> Worst city to live: Las Vegas
> Population: 623,769
> Median home value: $209,400
> Poverty rate: 16.3%
> Adults with at least a bachelor’s degree: 23.0%
Las Vegas is the most dangerous city in Nevada and one of the most dangerous cities in the U.S. There were 921 violent crimes for every 100,000 residents in the city in 2015 — well above the 696 figure statewide and the 373 figure nationwide.
While the city is iconic for its gaming and entertainment establishments, it is decidedly lacking in other cultural venues. The city has less than half the number of libraries, museums, movie theaters, and nature parks than the nation as a whole on a per capita basis.
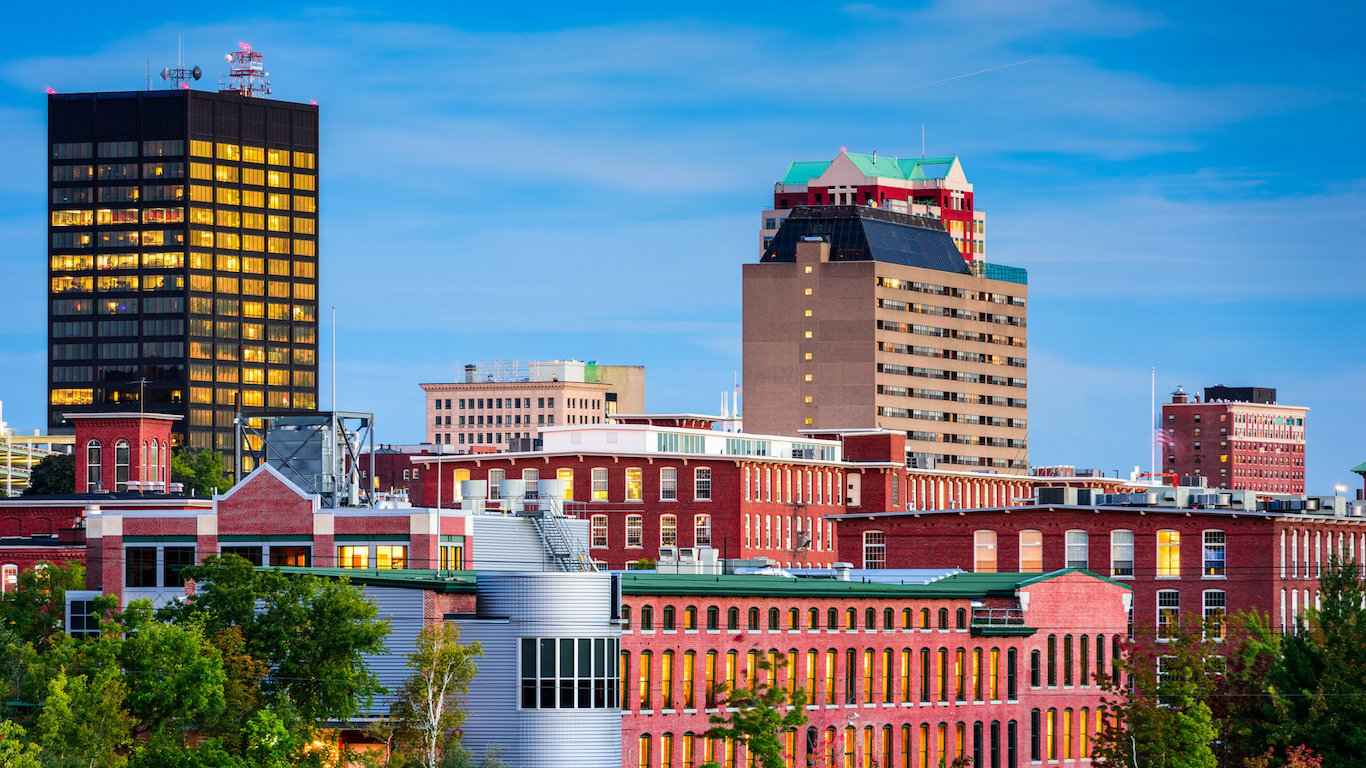
29. New Hampshire
> Worst city to live: Manchester
> Population: 110,223
> Median home value: $209,200
> Poverty rate: 14.4%
> Adults with at least a bachelor’s degree: 29.2%
Though it ranks as the worst large city in New Hampshire and one of the worst cities in the New England region, Manchester is faring better than much of the rest of the country. The city’s 14.4% poverty rate, though greater than the state’s 8.2% rate, is slightly lower than the nationwide rate of 14.7%. The city also boasts a range of cultural amenities and entertainment venues. There are 250 restaurants, 13 recreation centers, and four museums for every 100,000 city residents — well above the comparable 165 restaurants, 10 rec centers, and two museums adjusted for population nationwide.
As is the case in much of New England, living in Manchester is not cheap. Goods and services are about 14% more expensive on average in the city than they are nationwide.
[in-text-ad-2]

30. New Jersey
> Worst city to live: Paterson
> Population: 147,757
> Median home value: $226,300
> Poverty rate: 30.1%
> Adults with at least a bachelor’s degree: 9.1%
A college education can greatly increase an individual’s earning power, and in Paterson, only 9.1% of adults have a bachelor’s degree — less than a fourth of the 37.6% share of New Jersey residents. The low educational attainment partially explains the low incomes in the area. The typical Paterson household earns only $31,552 a year, less than half the statewide median income of $72,222. Further, goods and services are on average about 28% more expensive in the Paterson area than they are nationwide, and when accounting for the high cost of living, the city’s median household income is only worth about $24,650. Area residents face an additional financial burden of high taxes. Homeowners pay 3.8% of their home value on average in taxes annually, more than three times the 1.2% share the typical American homeowner pays in taxes.
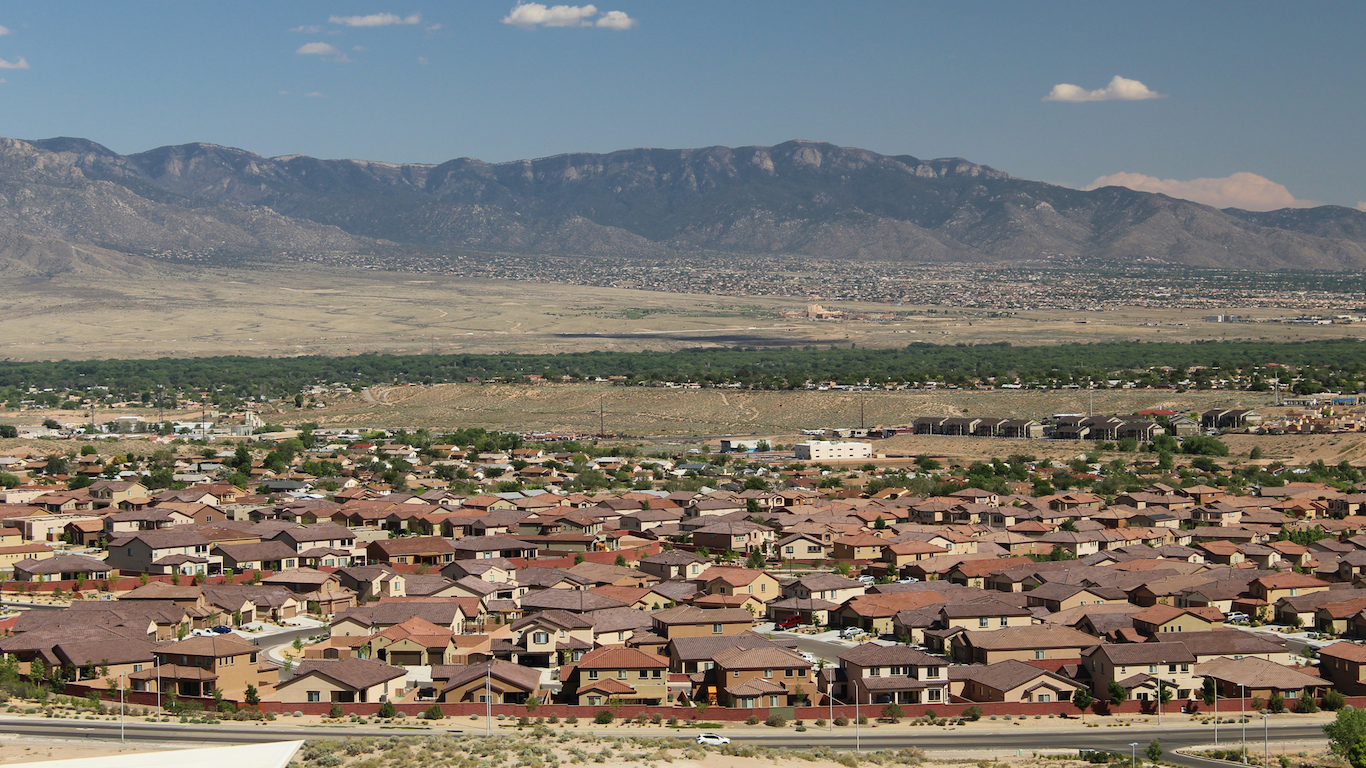
31. New Mexico
> Worst city to live: Albuquerque
> Population: 559,131
> Median home value: $189,200
> Poverty rate: 20.0%
> Adults with at least a bachelor’s degree: 32.6%
Albuquerque is one of most dangerous cities in the country. There were 966 violent crimes reported per 100,000 Albuquerque residents in 2015, the most of any large city in New Mexico and among the most of any city in the country. Albuquerque also has missed out on much of the job growth that most mid-size cities enjoyed over the past few years, and it continues to struggle with high poverty. While total employment in the U.S. grew by 4.0% from 2013 to 2015, the number of jobs in Albuquerque increased by just 0.1% over the same period. The city’s poverty rate of 20.0% is much higher than the nationwide poverty rate of 14.7%.
[in-text-ad]
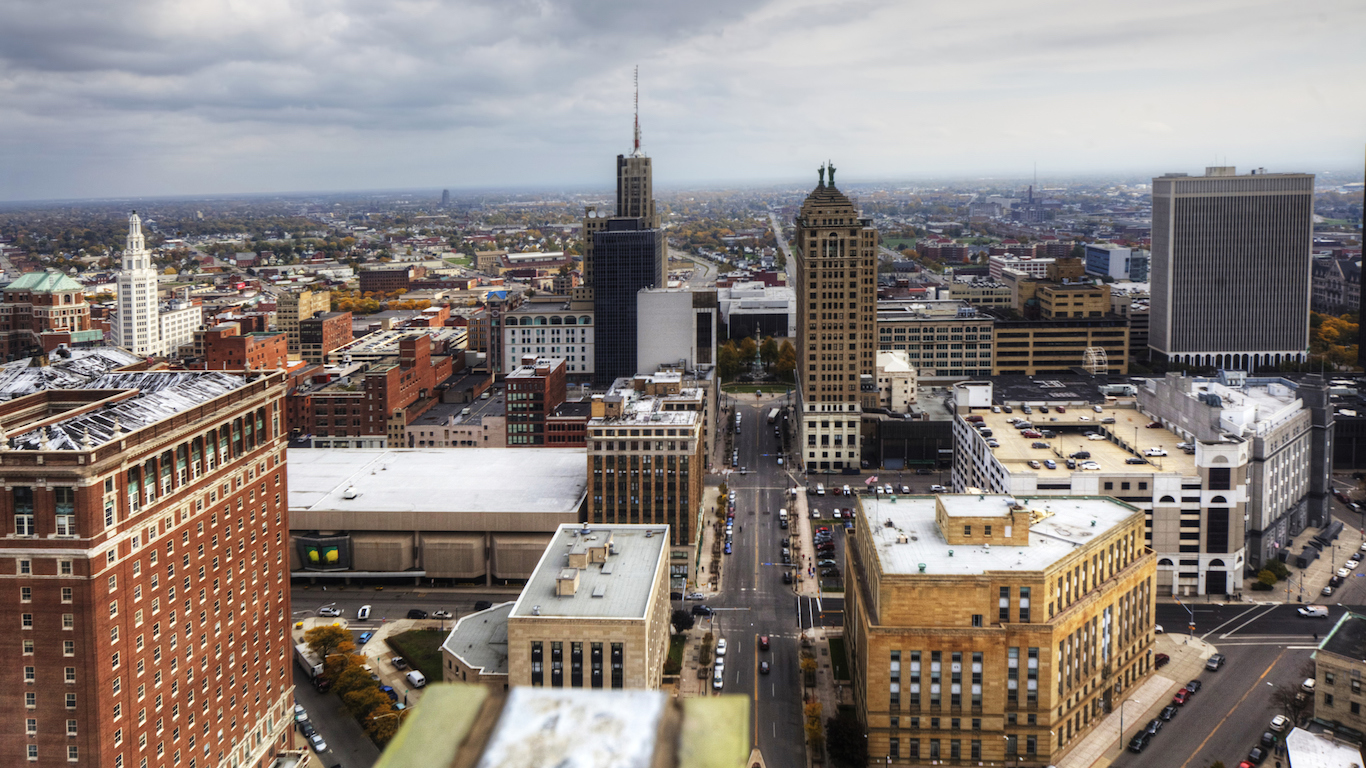
32. New York
> Worst city to live: Buffalo
> Population: 258,066
> Median home value: $75,800
> Poverty rate: 33.0%
> Adults with at least a bachelor’s degree: 23.9%
Buffalo is the second largest city in New York, and by many measures the most economically and socially distressed. The typical Buffalo household earns only $32,509 a year, and about one in three area residents live below the poverty line. In comparison, the median annual household income across the state is $60,850, and about 15.4% of state residents live in poverty. Financial prosperity is undercut by a lack of employment opportunities. The city’s 7.1% unemployment rate is the highest of any large city in the state and well above the 5.3% statewide rate.
An economic turnaround may be in the city’s near future, however. In a joint venture with Tesla, Panasonic invested several hundred million dollars in a South Buffalo solar cell manufacturing plant. Once the plant hits production capacity in 2019, the venture is anticipated to add some 1,400 new jobs. The deal is one of several major investments that have been announced in the last few years.
[recirclink id=405409]
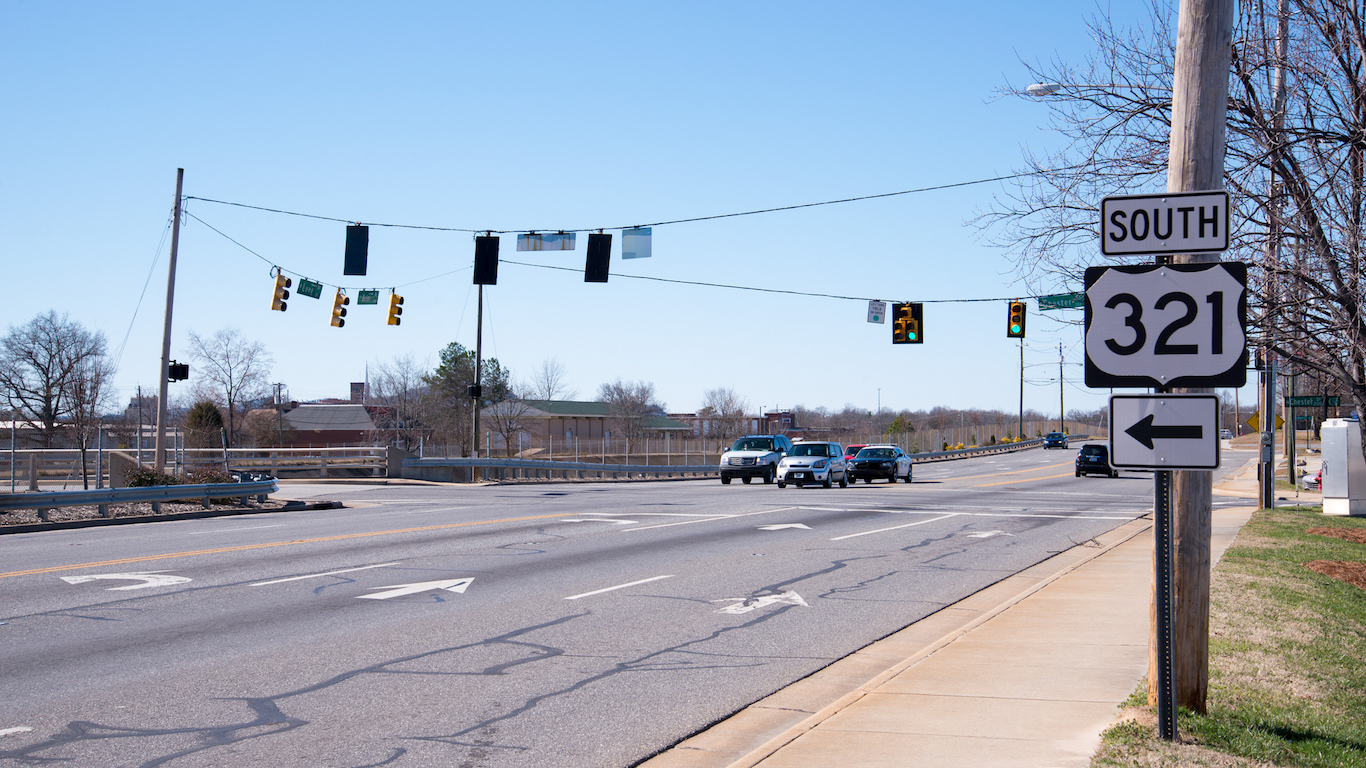
33. North Carolina
> Worst city to live: Gastonia
> Population: 74,550
> Median home value: $134,300
> Poverty rate: 19.7%
> Adults with at least a bachelor’s degree: 23.0%
A suburb of the fast-growing Charlotte metropolitan area, Gastonia’s population has more than tripled in size since 1950. Despite the steady growth, Gastonia lags behind most U.S. cities in a number of quality of life measures. The city’s poverty rate of 19.7% is one of the highest in the state and well above the nationwide rate of 14.7%. Also, there were 716 violent crimes reported per 100,000 Gastonia residents in 2015, one of the highest violent crime rates of any U.S. city.
While over the past few decades Charlotte economy has developed into a major banking and financial center, Gastonia has remained relatively dependent on manufacturing. U.S. manufacturing activity has declined in recent years, and a number of plant closings in Gastonia have contributed to job losses throughout the city. Gastonia’s 2015 unemployment rate of 6.2% is higher than both the 5.7% statewide rate 5.3% national rate.
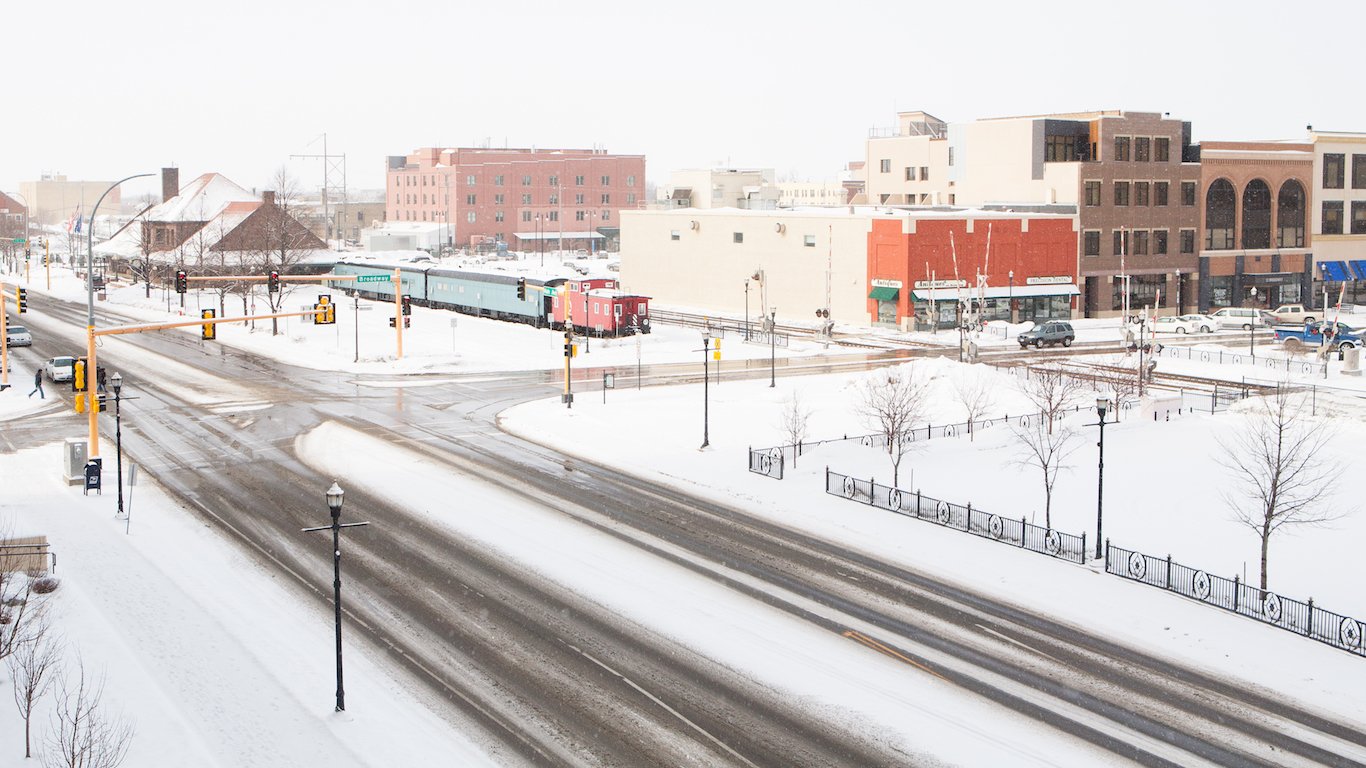
34. North Dakota
> Worst city to live: Fargo
> Population: 119,250
> Median home value: $192,400
> Poverty rate: 13.5%
> Adults with at least a bachelor’s degree: 36.1%
Though Fargo is the most dangerous city in North Dakota, it is safer than the nation as a whole. There were 349 violent crimes in Fargo for every 100,000 residents in 2015, slightly below the comparable U.S. violent crime rate of 373. Relative safety comes at a cost in Fargo. The typical area home is worth 4.2 times as much as the median salary in the city. In comparison, the income-to-home value ratio is 3.9 in Bismarck, North Dakota and 3.5 nationwide.
Despite ranking as the worst city in North Dakota, Fargo is a relatively appealing place to live. The city boasts more sports teams, movie theaters, museums, recreation centers, and theatre companies per capita than is typical nationwide. In the last decade, Fargo’s population has climbed by 34.3% — tripling U.S. population growth over the same period.
[in-text-ad-2]
35. Ohio
> Worst city to live: Canton
> Population: 71,895
> Median home value: $62,700
> Poverty rate: 31.6%
> Adults with at least a bachelor’s degree: 14.4%
In Canton, Ohio nearly one-third of residents live in poverty, more than double the 14.8% statewide poverty rate. Prevalent poverty has wide-reaching effects on a city’s overall standard of living and economy. For example, violent crime rates tend to be higher in poor cities and Canton’s violent crime rate of 1,129 incidents per 100,000 residents is nearly four times worse than Ohio’s violent crime rate.
Low educational attainment in an area can coincide with many other negative quality of life-outcomes, including lower incomes and higher unemployment. In Canton, just 14.4% of adults have a bachelor’s degree, less than half the 30.6% U.S. bachelor’s attainment rate.

36. Oklahoma
> Worst city to live: Lawton
> Population: 96,659
> Median home value: $112,200
> Poverty rate: 16.4%
> Adults with at least a bachelor’s degree: 19.7%
Lawton residents have relatively limited access to entertainment and cultural venues. The city has less than half the number of sports teams, recreation centers, museums, and libraries per capita than is typical nationwide. A high crime rate may make the city a less appealing venue for such cultural amenities.The most dangerous large city in Oklahoma, there were 973 violent crimes — murder, rape, robbery, and aggravated assault — in Lawton in 2015 for every 100,000 residents, more than double the comparable 422 figure statewide.
In the last five years, Lawton’s population count has fallen by 1.2% — making it the only large city in the state to report a net population decline since 2011.
[in-text-ad]

37. Oregon
> Worst city to live: Medford
> Population: 79,795
> Median home value: $232,400
> Poverty rate: 22.3%
> Adults with at least a bachelor’s degree: 20.9%
The typical household in Medford earns $40,806 a year, less than any other similarly sized city in Oregon and the $55,775 national median household income. While incomes in Medford are higher when adjusted for the city’s low cost of groceries, utilities, and other goods, the cost of housing is 11% higher in Medford on average than it is nationwide. Less affordable than much of the country, Medford’s median home value is $232,400, nearly six times the typical city household income. By comparison, the median home value nationwide is only 3.5 times the national median household income.
Like many cities on this list, Medford struggles with crime. There were 6,115 property crimes per 100,000 Medford residents in 2015, by far the most of any large city in the state and one of the highest property crime rates of any U.S. city.
[recirclink id=427661]

38. Pennsylvania
> Worst city to live: Reading
> Population: 87,873
> Median home value: $69,100
> Poverty rate: 38.8%
> Adults with at least a bachelor’s degree: 11.5%
Once a prosperous industrial center, Reading’s economy and standard of living has declined since Reading Company, operator of the main coal transporting railroad in the area, declared bankruptcy in 1971. The city’s population declined in the following years but has grown steadily over the past few decades. Still, Reading’s population has yet to return to its 1930 peak of 111,000 people.
Today, Reading is one of the poorest of U.S. cities. Just 11.5% of adults have a bachelor’s degree, the smallest share of any large Pennsylvania city. With such low earnings potential, the city’s typical household earns just $26,531 a year, less than half the statewide median household income of $55,702. Reading’s poverty rate of 38.8% is the highest of any large Pennsylvania city and the fifth highest of any U.S. city.
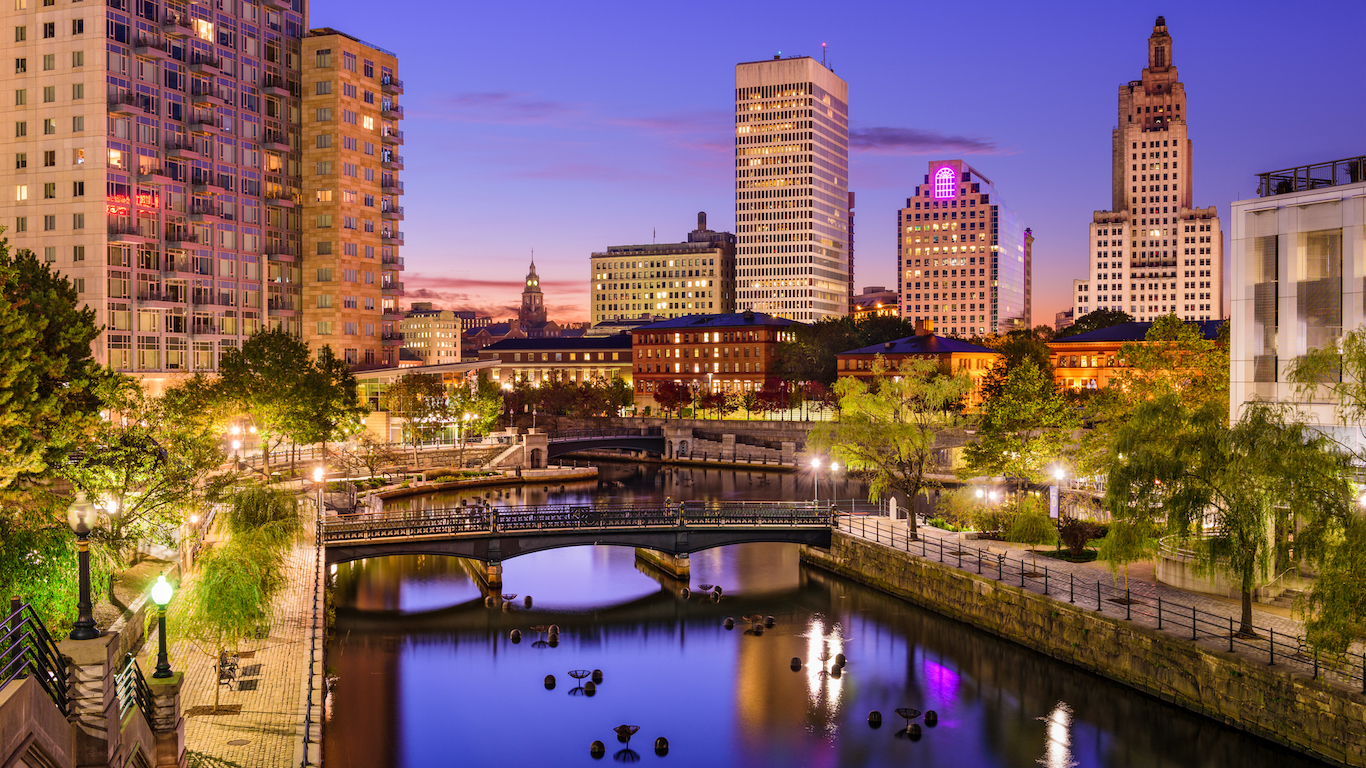
39. Rhode Island
> Worst city to live: Providence
> Population: 179,204
> Median home value: $177,400
> Poverty rate: 28.1%
> Adults with at least a bachelor’s degree: 30.1%
Of the Rhode Island cities considered, Providence is the most dangerous. There were 567 violent crimes in 2015 for every 100,000 city residents, more than double the statewide rate of 243 incidents per 100,000 people.
Like many violent cities, Rhode Island’s state capital is relatively poor. The typical area household earns only $39,015 annually, well below the $58,073 median household income across the state. A high cost of living applies additional financial burdens on residents. Goods and services in Providence are 20% more expensive on average than they are nationwide.
[in-text-ad-2]

40. South Carolina
> Worst city to live: Columbia
> Population: 133,393
> Median home value: $172,400
> Poverty rate: 22.6%
> Adults with at least a bachelor’s degree: 40.7%
Columbia is one of the fastest growing cities in the U.S., expanding by 50.8% over the last decade. The local economy does not appear to have handled the influx well. Some 6.1% of the city’s labor force is out of a job — the highest unemployment rate of any large city in the state and considerably higher than the 5.3% U.S. 2015 unemployment rate. Additionally, 22.6% of the city’s population lives below the poverty line, the highest poverty rate of any South Carolina city and higher than the 16.6% statewide and 14.7% nationwide rates.
South Carolina’s capital city is also the most dangerous city in the state. There were 799 violent crimes per 100,000 residents in Columbia in 2015 — well above the comparable 505 figure statewide.
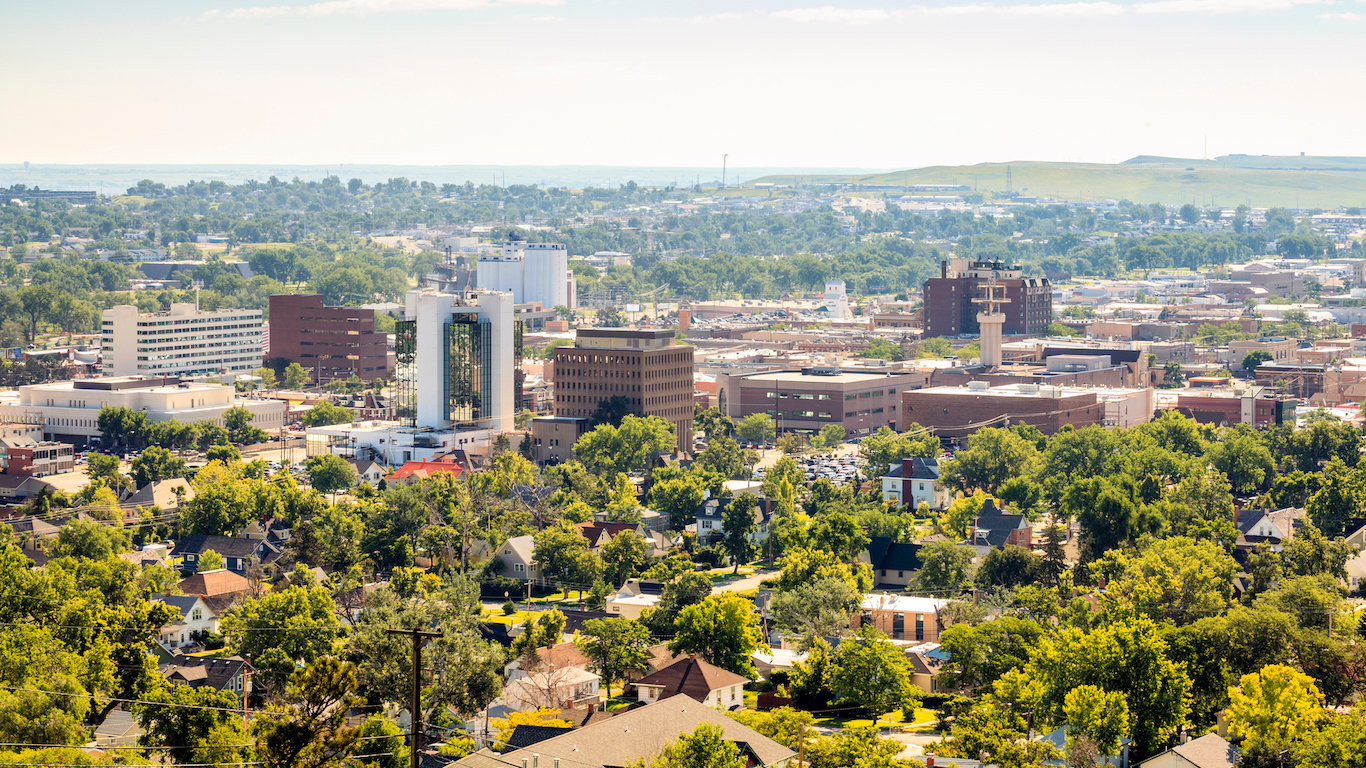
41. South Dakota
> Worst city to live: Rapid City
> Population: 73,568
> Median home value: $170,400
> Poverty rate: 11.5%
> Adults with at least a bachelor’s degree: 32.1%
Rapid City ranks only slightly worse than Sioux Falls, a more populous city on the other side of the state. The typical household in Rapid City earns about $49,700 a year — slightly less than the median household income in Sioux Falls and statewide of $55,800 and $53,000, respectively. Partially as a result, housing is slightly less affordable in Rapid City than Sioux Falls. Rapid City’s median income is about 3.4 times the median home value, compared to a more favorable 3.1 ratio in Sioux Falls.
Rapid City is considerably more dangerous than the state as a whole. There were 671 violent crimes for every 100,000 Rapid City residents in 2015, well above the 383 violent crimes per 100,000 rate across South Dakota.
[in-text-ad]

42. Tennessee
> Worst city to live: Memphis
> Population: 655,760
> Median home value: $94,400
> Poverty rate: 26.2%
> Adults with at least a bachelor’s degree: 24.9%
One of the largest cities to make this list, Memphis struggles with several issues that make it a less than desirable place to live. Chief among these is one of the worst crime rates of any major city. The city’s annual violent crime rate of 1,740 incidents for 100,000 residents, which is close to five times the national rate, is by far the highest in the state. Additionally, the city’s property crime rate of 5,631 for every 100,000 residents is more than double the national rate.
Memphis’ housing is relatively inexpensive, but like many cities on this list, that likely largely reflects the ability of Memphis’ citizens to pay. Over one-quarter of the population lives in poverty, the highest poverty rate of any large Tennessee city, and the typical household’s income is less than $37,000, about $10,000 less that the median income across Tennessee.
[recirclink id=405048]
43. Texas
> Worst city to live: Lubbock
> Population: 249,051
> Median home value: $126,900
> Poverty rate: 22.4%
> Adults with at least a bachelor’s degree: 26.8%
The typical household in Lubbock, Texas earns only $45,551 a year, about $10,000 less than the median income across the state. The city’s poverty rate underscores the prevalence of financial hardship in Lubbock. Some 22.4% of people in the city live in poverty, well above the 15.9% statewide poverty rate and 14.7% nationwide poverty rate.
Like many cities on this list, Lubbock is not an especially safe place. With 967 violent crimes in 2015 for every 100,000 area residents, violent crime is more than twice as common in Lubbock as it is across both Texas and the nation as a whole.

44. Utah
> Worst city to live: Salt Lake City
> Population: 192,660
> Median home value: $262,400
> Poverty rate: 19.1%
> Adults with at least a bachelor’s degree: 44.4%
While Salt Lake City has a growing economy, and is home to a large share of college graduates and low unemployment, the city struggles with frequent crime and unaffordable housing. The median home value in Salt Lake City is $262,400, 5.4 times the city’s median annual household income of $48,761. By comparison, the U.S. median home value is only 3.5 times higher than the typical American household income.
In 2015, there were 9,331 property crimes — burglary, larceny-theft, motor vehicle theft, and arson — per 100,000 Salt Lake City residents, by far the highest property crime rate in the state and second highest in the country among similarly sized cities. While not as prevalent as property theft, violent crime is also relatively common in the city. There were 855 violent crimes per 100,000 Salt Lake City residents, more than triple the statewide rate of 236 incidents per 100,000 people.
[in-text-ad-2]

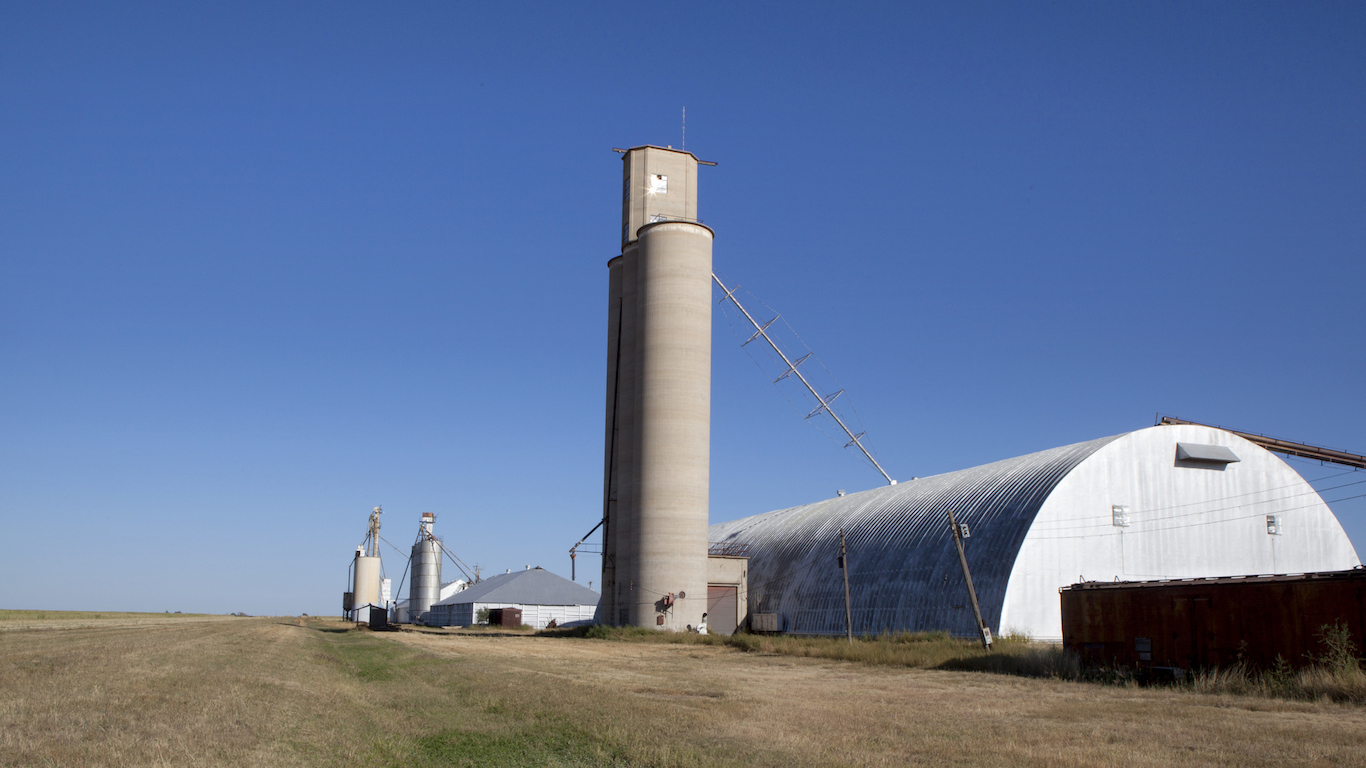
45. Vermont
> Worst city to live: Rutland
> Population: 16,091
> Median home value: $157,600
> Poverty rate: 17.1%
> Adults with at least a bachelor’s degree: 28.5%
The U.S. has steadily added jobs over the last several years. In Rutland, Vermont, however, employment fell by 2.1% between 2012 and 2014. The city’s annual unemployment rate of 4.4% is well above the 2.6% unemployment rate in Burlington, Vermont, the largest city in the state. A relatively bleak economic picture may be partially attributable to lower educational attainment. Only 28.5% of Rutland residents have at least a bachelor’s degree, compared to over half of all adults in Burlington and 36.9% of adults in Vermont.
Lower educational attainment is often tied to lower incomes and the same pattern holds in Rutland. The typical area household earns only $41,345 a year, slightly below Burlington’s $44,671 median income and the $56,990 median income across the state.
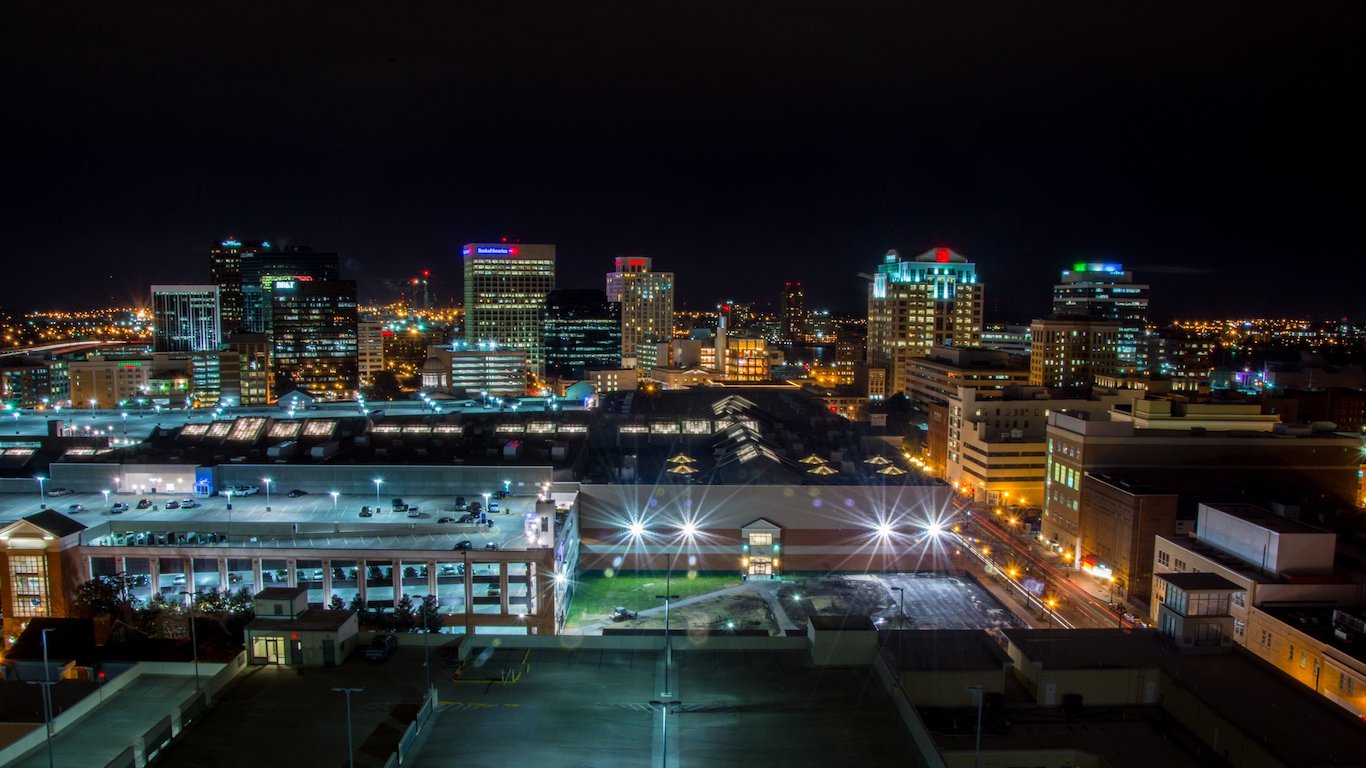
46. Virginia
> Worst city to live: Norfolk
> Population: 246,393
> Median home value: $204,800
> Poverty rate: 20.5%
> Adults with at least a bachelor’s degree: 26.6%
Home to nearly a quarter million people, Norfolk is one of the most populous cities in Virginia. Based on a number of socioeconomic measures, it is also the worst city in the state in which to live. The typical Norfolk household earns only about $46,000 a year, well below the statewide median household income of $66,300. A high cost of living compounds financial problems for many area residents. Goods and services in Norfolk cost about 9% more than they do on average nationwide.
As is the case with nearly every city on this list, Norfolk is far more dangerous than its home state as a whole. There were 542 violent crimes in Norfolk for every 100,000 residents in 2015, nearly three times the statewide rate.
[in-text-ad]

47. Washington
> Worst city to live: Yakima
> Population: 93,700
> Median home value: $158,200
> Poverty rate: 22.0%
> Adults with at least a bachelor’s degree: 19.1%
Yakima faces a number of greater economic challenges than much of the rest of the state. Some 6.8% of the city’s labor force is out of a job, compared to a 2015 statewide unemployment rate of only 5.7%. A weak job market may contribute to lower incomes. The typical Yakima household earns only $44,050 a year, roughly $20,000 less than the median household income statewide. Additionally, 22% of Yakima residents live below the poverty line, the largest share of any city in the state, and nearly 10 percentage points higher than the statewide rate.
Like many other cities with low incomes and high unemployment, Yakima is relatively dangerous. There were 548 violent crimes in the city for every 100,000 residents in 2015, nearly double the statewide rate.
[recirclink id=427661]
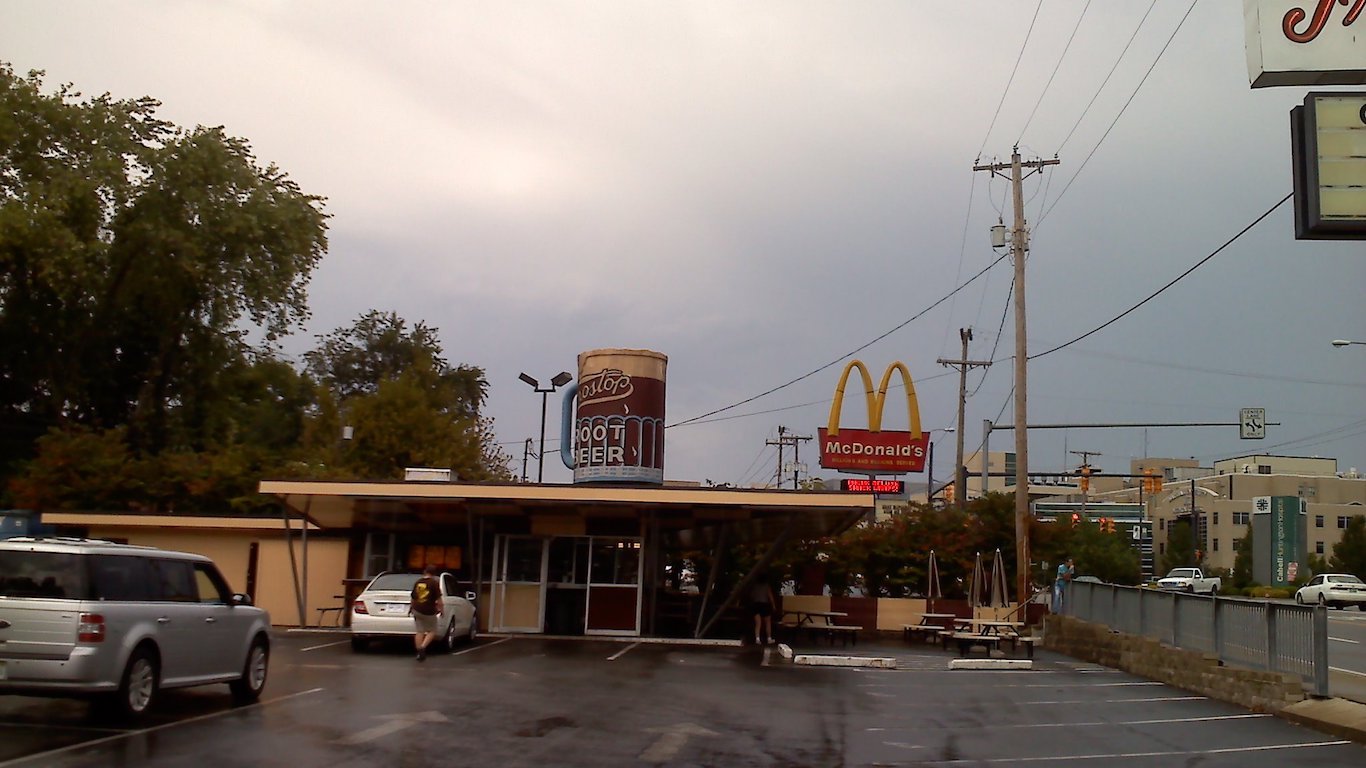
48. West Virginia
> Worst city to live: Huntington
> Population: 48,944
> Median home value: $90,600
> Poverty rate: 29.8%
> Adults with at least a bachelor’s degree: 29.8%
The state of West Virginia as a whole compares poorly to the rest of the country by a number of social and economic measures. But in Huntington, a city of 48,944, living may be even harder than elsewhere in the state. For example, nearly 30% of the city’s population lives in poverty, compared to state and national poverty rates of 17.9% and 14.7%, respectively. West Virginia has the third-lowest median household income in the country, at $42,019, compared to a national median household income of $55,775. However, income levels are even lower in Huntington, where the typical household earns less than $30,000 annually.
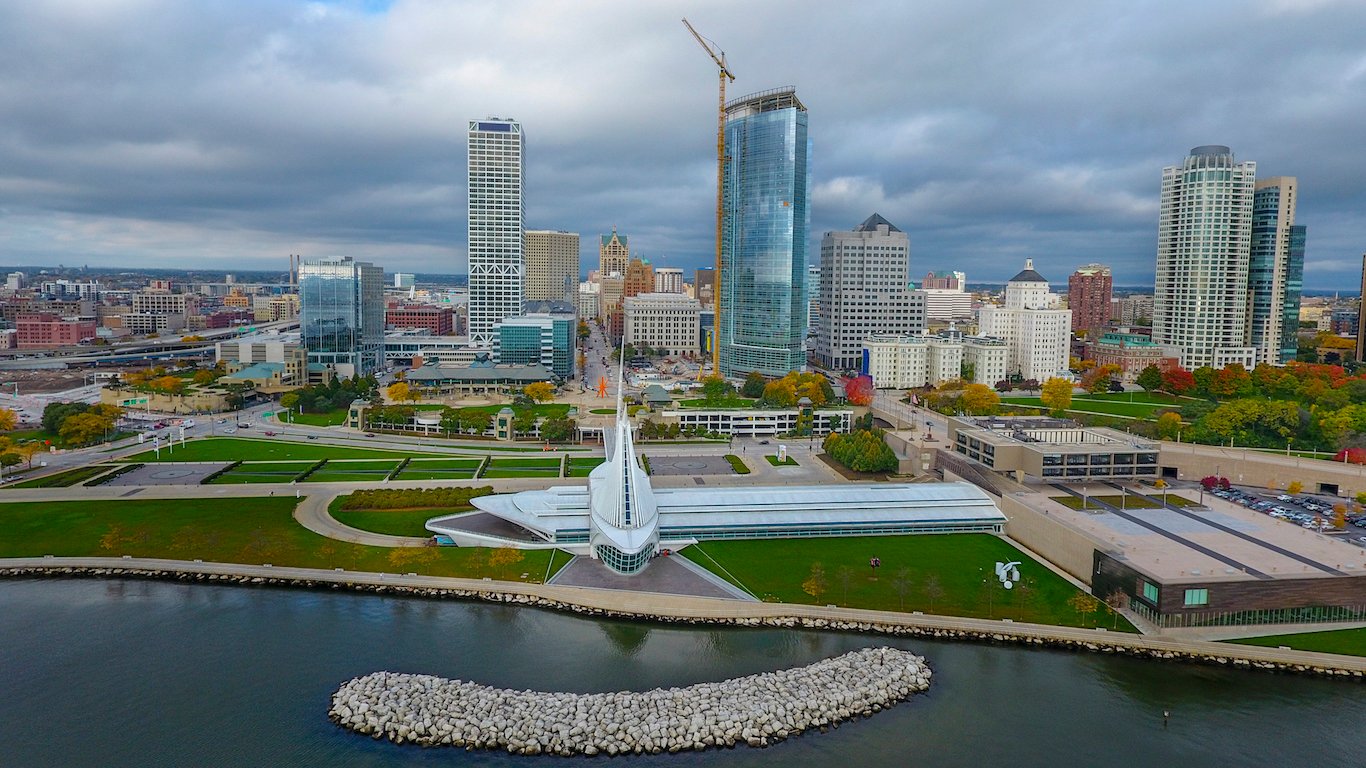
49. Wisconsin
> Worst city to live: Milwaukee
> Population: 600,154
> Median home value: $114,000
> Poverty rate: 26.8%
> Adults with at least a bachelor’s degree: 23.9%
Some 26.8% of Milwaukee residents live in poverty, the highest poverty rate of any city in the state and well above the 14.7% U.S. poverty rate. The city also has the lowest median household income in the state, at $37,495 a year, and second lowest unemployment rate, at 6.7%.
Economically stressed areas often struggle with higher rates of violent crime, and Milwaukee is no exception. There were 1,596 violent crimes for every 100,000 city residents in 2015, more than triple the violent crime rate in the next most dangerous Wisconsin city and the sixth highest violent crime rate of U.S. cities. Due in part to the city’s high crime rate, Milwaukee was one of a handful of U.S. cities selected in 2016 to receive federal assistance to reduce violence.
[in-text-ad-2]

50. Wyoming
> Worst city to live: Cheyenne
> Population: 62,195
> Median home value: $182,900
> Poverty rate: 11.2%
> Adults with at least a bachelor’s degree: 29.3%
Wyoming is the nation’s smallest state by population. The only two cities of any size are are Cheyenne, with a population of 62,195, and Casper, with a population of 58,817. The two cities are similar in a number of ways, but Cheyenne compares slightly worse in several important measures. The state capital has a poverty rate of 11.2%, compared to Casper’s 10.5% poverty rate. Violent crime is also slightly more commonplace in Cheyenne than in Casper, at 192 incidents per 100,000 residents, compared to Casper’s 139 incidents per 100,000 people.
While Cheyenne technically ranks as the worst city in the state to live, it compares either similarly or favorably to the state as a whole and the nation in measures like crime and poverty.
Detailed Findings
The infamy of being the worst city to live in a state can have very different implications, depending on the state. In some of the more prosperous parts of the country, the worst-rated major cities may actually provide better living conditions, job prospects, and amenities than many cities in other states.
Several of the cities on this list as here not so much because their living conditions are so poor, but because other large cities in the state perform very well. Anchorage, for example, is technically the worst city to live in Alaska, but this is largely because the other major city in the state, Juneau, performs even better. Anchorage has, for example, a poverty rate of 8.2%. While this is higher than Juneau’s 6.6% rate, it is far lower than the national poverty rate of 14.7%.
Other cities on this list, however, are truly not just the worst city in their state, but the worst in the country. For example, Detroit, Michigan and Reading, Pennsylvania, have poverty rates of nearly 40%.
Low-income families tend to live in communities with less stable housing, worse health systems, greater exposure to stressors such as violent crime, less secure employment, and higher exposure to poor air quality and environmental toxins. Struggling with many such factors, residents often find it hard to escape the cycle of poverty. Poverty has wide-reaching effects, not just on those living in poverty but on entire communities and neighborhoods.
How far a paycheck can go in a given city is just as important as the size of the paycheck — and some cities are far more expensive than others. Housing expenses usually dominate household budgets. Nationwide, the typical home costs 3.5 times the annual median household income. Housing is less affordable than this in half of the worst cities to live in. In Miami Beach, the typical home costs nine times the city’s annual median household income.
However, in the cities where housing is relatively affordable, the advantage is often overshadowed by abysmal home values and struggling housing markets. This is most notably the case in cities such as Detroit, Michigan, Gary, Indiana, and Canton, Ohio. While for some people in these areas a home can be bought outright on less than a year’s salary, the affordability is a sign of extremely poor economic health, which can have many
Violence is closely associated with a range of negative social and economic outcomes for all involved, unstable employment, lower cognitive functioning among children, and anxiety. The violent crime rates in almost all of the worst cities to live in each state is higher than the national rate of 373 reported incidents per 100,000 people. In eighteen of the 50 worst cities, the violent crime rate exceeds 1,000 incidents per 100,000 people.
Methodology
To determine the worst city to live in each state, 24/7 Wall St. considered the roughly 550 cities that the U.S. Census Bureau reported as having populations of more than 65,000 residents in 2015. When one or fewer cities had populations of at least 65,000, we reduced the population limits by increments of 10,000 until at least two cities could be compared. Data were collected in nine major categories: crime, demography, economy, education, environment, health, housing, infrastructure, and leisure.
Within each category, specific measures contributed to a city’s overall category score. For example, the economy category included median household income adjusted for cost of living, the ratio between a city’s and its state’s median household income, poverty and unemployment rates, as well as a city’s three-year employment growth.
Cities with negative five- or 10-year population growth rates were excluded. Population figures are from the Census Bureau’s 2015 American Community Survey (ACS). The crime category consists of both violent and property crime rates from the Federal Bureau of Investigation’s 2015 Uniform Crime Report. High crime rates have the potential to make a city less desireable. As a result, cities with crime rates lower than the national rates were rewarded, while cities with higher crime rates were penalized.
The economy category includes a city’s 2015 unemployment rate and employment growth from 2013-2015, both from the Bureau of Labor Statistics. We also considered the poverty rate in this category. Cities were penalized for having poverty rates above the national rate of 14.7%. Cities were penalized if cost-adjusted incomes were less than $44,000 or more than $112,000 a year, roughly 80% to 200% of a typical household’s income nationwide. Poverty rates and median income came from the 2015 ACS. Cost of living data came from property and real estate data provider ATTOM Data Solutions.
As a proxy for school system strength, we considered high school standardized test scores relative to state scores from ATTOM Data Solutions. Test score data are for 2015 or the most recently available year. Additionally, the education category included the percentage of adults with at least a bachelor’s degree from the ACS, as well as the number of colleges and universities in a city per 100,000 residents from the Department of Education. Both measures are as of 2015.
Whereas other measures in this index are specific to an individual city, many metrics in this category describe the county in which the city is located because weather is likely similar, if not the same, in these two geographies. In this category, we included an air quality index to assess the levels of a variety of pollutants on a given day. Additionally, we considered an index measuring natural hazard risk, as well as average monthly rainfall. All data in this category came from ATTOM Data Solutions.
From the Centers for Medicare and Medicaid Services (CMS), we calculated 30-day risk-adjusted mortality rates of heart attacks, COPD, heart failure, pneumonia, and stroke. Also from CMS, we examined the rate at which individuals were readmitted to a hospital within 30 days of being discharged. This category also includes preventable hospitalizations — the share of hospitalizations that could have been treated with outpatient or ambulatory care for every 1,000 Medicare recipients from County Health Rankings.
In our housing index, we considered the ratio of a city’s median home value to the statewide median home value. Cities were penalized if a city’s home values were worth less than 90% of statewide home values. Conversely, if home values were typically 25% higher than across the state, high barriers to entry exist that can make a city unaffordable. As an additional measure of affordability, we included the ratio of median home value to median annual household income. This ratio — called a price-to-income ratio — helps identify cities that are liveable for a broad audience. We also considered median property taxes as a percentage of median home value. All data in this category came from the 2015 ACS.
According to the Texas A&M Transportation Institute, Americans waste nearly 7 billion hours — or $160 billion — due to commuter traffic congestion. From the ACS, we considered the percentage of commuters travelling to work by foot or public transportation. Additionally, we reviewed the average time it takes to travel to work each day. Lastly, we included the number of airports in the metro area in which the city is located. There are, for example, no airports in New York County, the primary county of New York City. However, at least three major airports exist outside county limits — and within the metro area — that service people who live in the city. Airport data came from the Federal Aviation Administration and only consider operational public-use and commercial airports as of 2015.
We included in this index the number of zoos, nature parks, ski resorts, and golf courses in the counties surrounding the city. All data in this category were aggregated to the city level from 2014 Zip Code Business Patterns, a program maintained by the Census and adjusted for the city’s 2015 population.
Contact [email protected] for any questions or corrections.