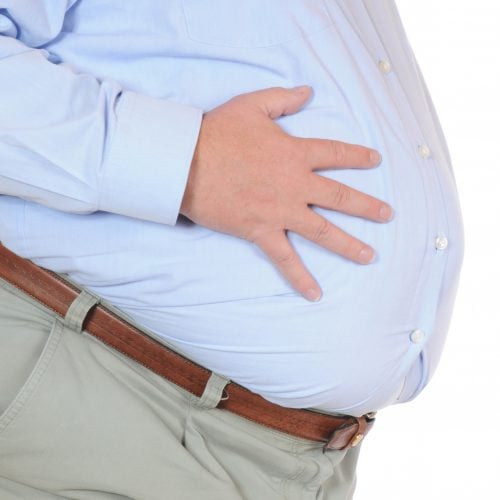
Obesity is one of the leading causes of preventable death in the United States. Obesity is measured as a function of the body mass index, a ratio of height to weight. A person with a body mass of 30 or greater — weighing at least 203 pounds and standing at five feet and nine inches, for example — qualifies as obese. Obesity can increase the risk of a number of serious and often deadly diseases and conditions, including heart disease, Type 2 diabetes, and certain types of cancer.
According to the Centers for Disease Control and Prevention, 28.3% of Americans age 18 and older are obese. Obesity is a complex health concern with a wide range of causes that can include community and environment. Partially as a result, obesity rates can range considerably from one state to the next and even between counties of the same state.
In Colorado, just 21.3% of adults are obese, the smallest share of any state in the country. Even in Colorado’s most overweight county, the obesity rate of 27.6% is below the national obesity rate. On the other end of the spectrum, in Mississippi — a state with a nation-leading 35.1% obesity rate — the adult obesity rate is nearly 50% in some counties.
24/7 Wall St. reviewed county-level health data from the CDC to identify the most obese county in every state.
Click here to see the most obese county in every state.
Click here to see our detailed findings and methodology.
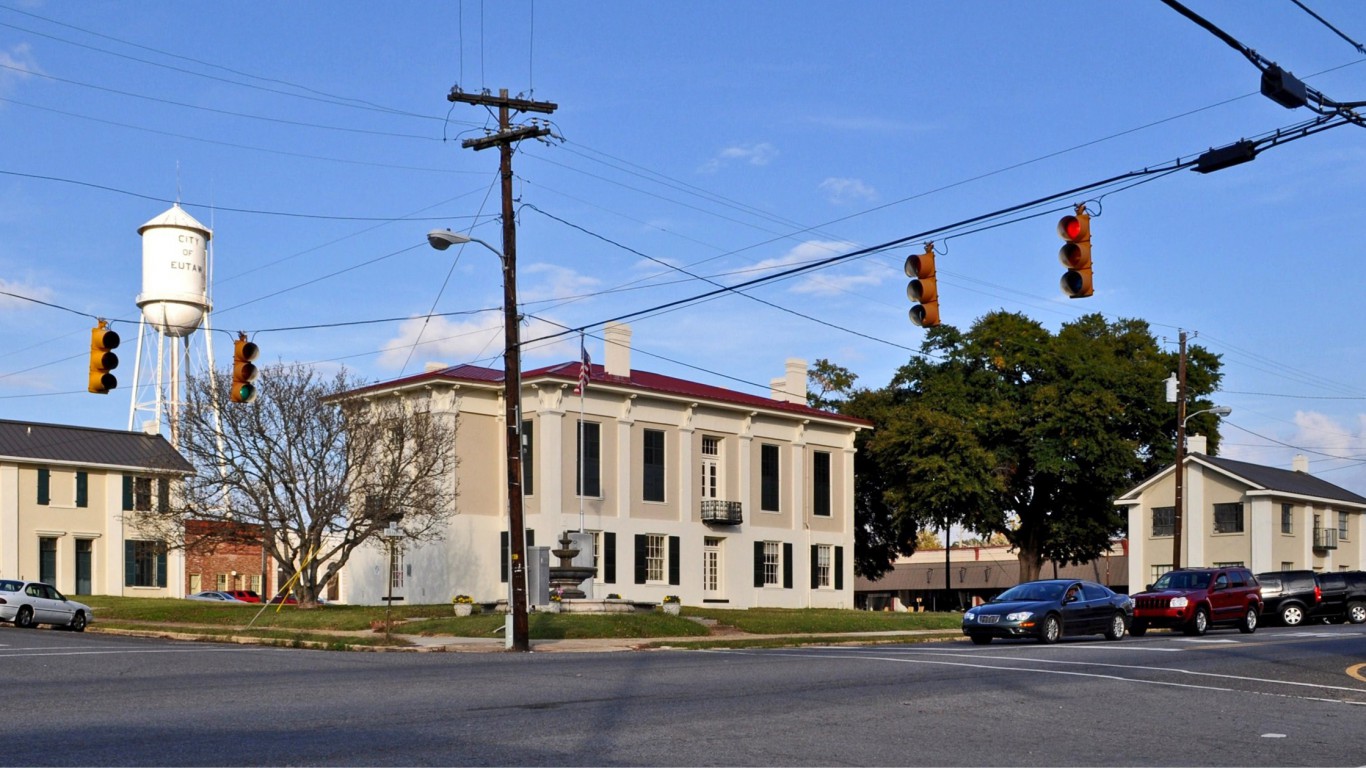
1. Greene County, Alabama
> Obesity rate: 46.3% (county) 32.4% (state)
> Adults who do not exercise: 31.7% (county) 31.5% (state)
> Adults with diabetes: 21.0% (county) 13.8% (state)
> Poverty rate: 37.9% (county) 17.1% (state)
[in-text-ad]
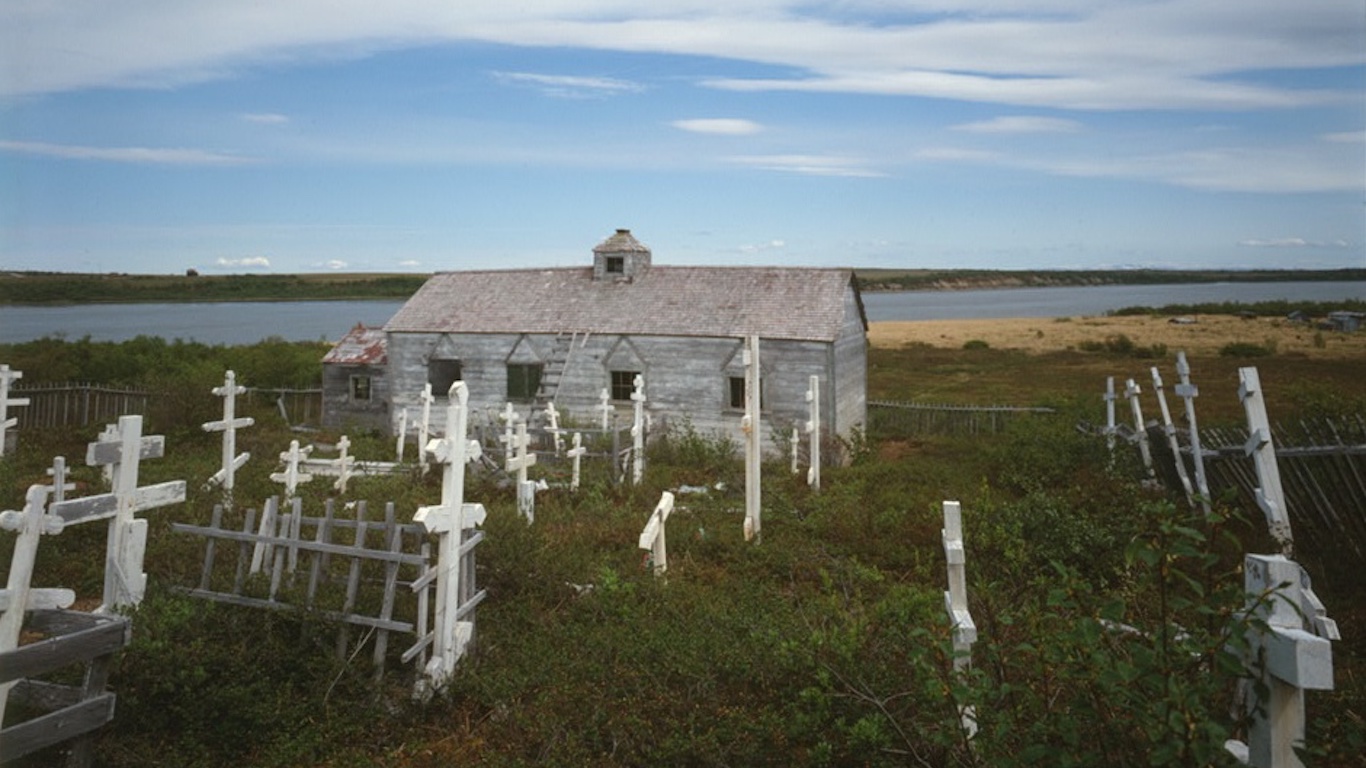
2. Bristol Bay Borough, Alaska
> Obesity rate: 39.7% (county) 28.4% (state)
> Adults who do not exercise: 21.2% (county) 22.3% (state)
> Adults with diabetes: 8.5% (county) 7.1% (state)
> Poverty rate: 7.3% (county) 9.9% (state)
[recirclink id=444492]

3. Apache County, Arizona
> Obesity rate: 35.2% (county) 26.8% (state)
> Adults who do not exercise: 21.4% (county) 25.2% (state)
> Adults with diabetes: 14.4% (county) 10.7% (state)
> Poverty rate: 36.2% (county) 16.4% (state)

4. Phillips County, Arkansas
> Obesity rate: 45.5% (county) 34.6% (state)
> Adults who do not exercise: 35.9% (county) 34.4% (state)
> Adults with diabetes: 16.7% (county) 11.5% (state)
> Poverty rate: 33.5% (county) 17.2% (state)
[in-text-ad-2]

5. Stanislaus County, California
> Obesity rate: 32.6% (county) 24.1% (state)
> Adults who do not exercise: 20.0% (county) 21.4% (state)
> Adults with diabetes: 9.7% (county) 10.2% (state)
> Poverty rate: 18.2% (county) 14.3% (state)
6. Kit Carson County, Colorado
> Obesity rate: 27.6% (county) 21.3% (state)
> Adults who do not exercise: 24.5% (county) 17.9% (state)
> Adults with diabetes: 7.3% (county) 6.5% (state)
> Poverty rate: 14.2% (county) 11.0% (state)
[in-text-ad]
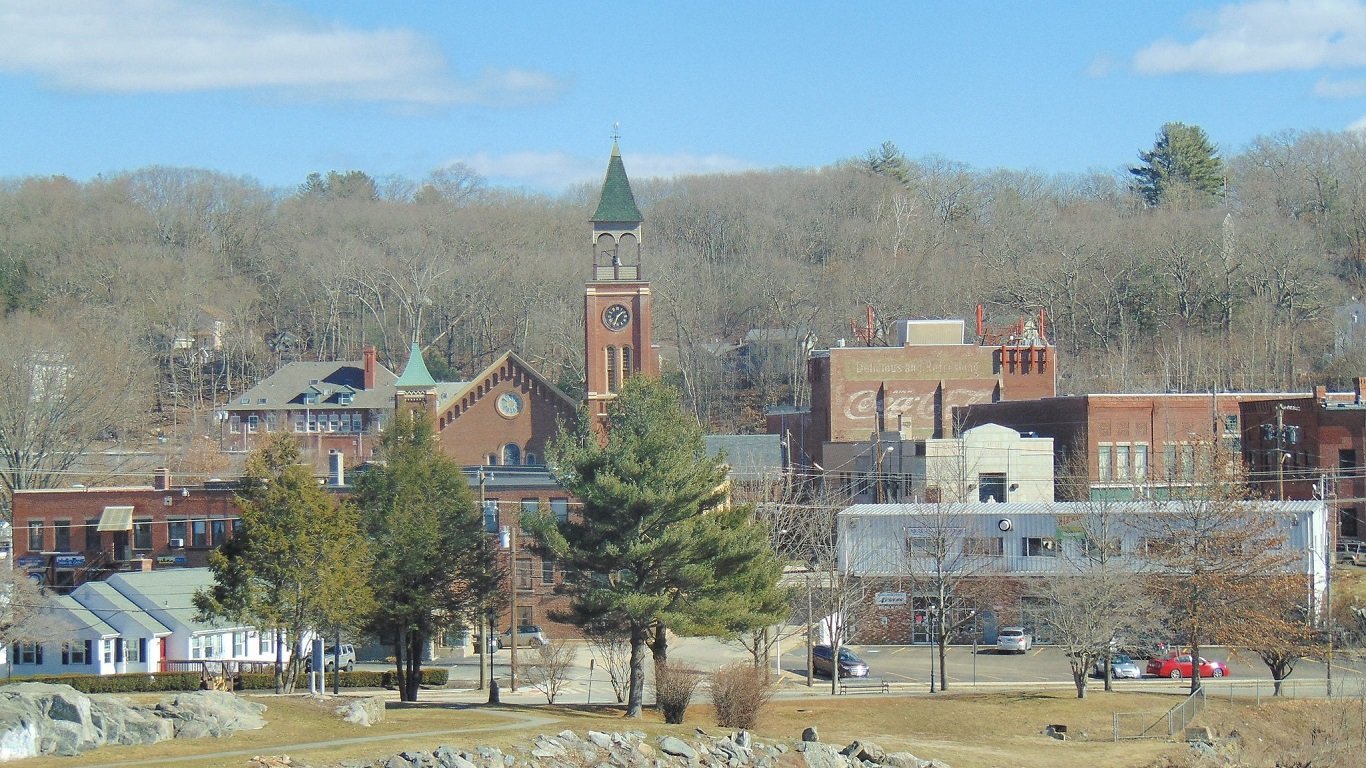
7. Windham County, Connecticut
> Obesity rate: 29.6% (county) 25% (state)
> Adults who do not exercise: 24.5% (county) 24.9% (state)
> Adults with diabetes: 10.1% (county) 8.3% (state)
> Poverty rate: 11.2% (county) 9.8% (state)
[recirclink id=444468]

8. Kent County, Delaware
> Obesity rate: 32.8% (county) 31.1% (state)
> Adults who do not exercise: 27.8% (county) 27.8% (state)
> Adults with diabetes: 12.8% (county) 11.1% (state)
> Poverty rate: 13.2% (county) 11.7% (state)
9. Liberty County, Florida
> Obesity rate: 39.6% (county) 26.4% (state)
> Adults who do not exercise: 29.6% (county) 27.7% (state)
> Adults with diabetes: 13.4% (county) 11.2% (state)
> Poverty rate: 16.9% (county) 14.7% (state)
[in-text-ad-2]

10. Clayton County, Georgia
> Obesity rate: 38.0% (county) 30.3% (state)
> Adults who do not exercise: 25.3% (county) 27.2% (state)
> Adults with diabetes: 11.6% (county) 10.8% (state)
> Poverty rate: 24.3% (county) 16.0% (state)

11. Hawaii County, Hawaii
> Obesity rate: 22.7% (county) 21.8% (state)
> Adults who do not exercise: 19.4% (county) 22.1% (state)
> Adults with diabetes: 8.1% (county) 8.4% (state)
> Poverty rate: 18.7% (county) 9.3% (state)
[in-text-ad]
12. Minidoka County, Idaho
> Obesity rate: 34.2% (county) 29.6% (state)
> Adults who do not exercise: 18.3% (county) 23.7% (state)
> Adults with diabetes: 10.8% (county) 8.4% (state)
> Poverty rate: 17.8% (county) 14.4% (state)
[recirclink id=444391]
13. Adams County, Illinois
> Obesity rate: 37.0% (county) 29.4% (state)
> Adults who do not exercise: 24.4% (county) 25.1% (state)
> Adults with diabetes: 13.9% (county) 9.9% (state)
> Poverty rate: 12.9% (county) 13.0% (state)

14. Lawrence County, Indiana
> Obesity rate: 38.2% (county) 31.8% (state)
> Adults who do not exercise: 30.6% (county) 31.0% (state)
> Adults with diabetes: 17.7% (county) 11.0% (state)
> Poverty rate: 12.9% (county) 14.1% (state)
[in-text-ad-2]
15. Union County, Iowa
> Obesity rate: 37.8% (county) 31.3% (state)
> Adults who do not exercise: 26.4% (county) 28.5% (state)
> Adults with diabetes: 13.5% (county) 9.3% (state)
> Poverty rate: 12.9% (county) 11.8% (state)
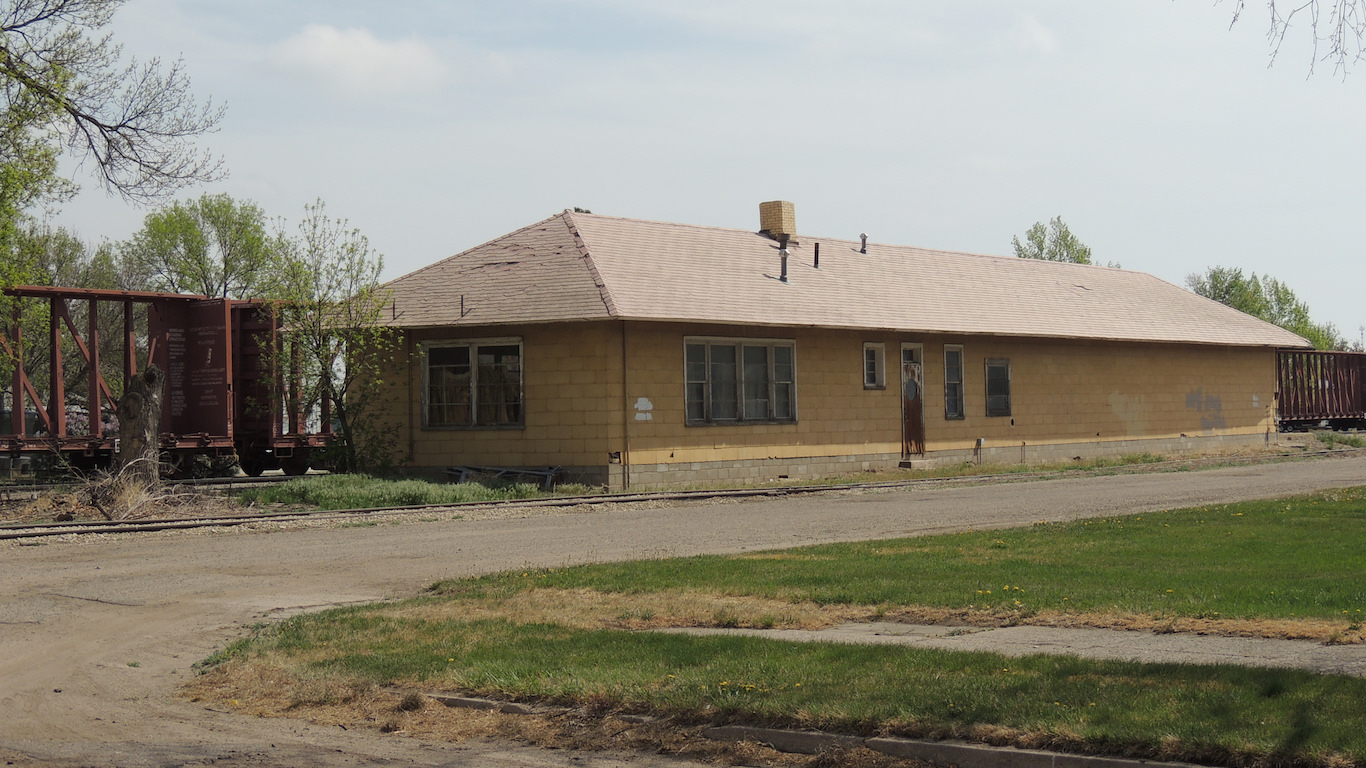
16. Seward County, Kansas
> Obesity rate: 38.6% (county) 30% (state)
> Adults who do not exercise: 25.6% (county) 26.5% (state)
> Adults with diabetes: 8.3% (county) 9.6% (state)
> Poverty rate: 18.9% (county) 12.1% (state)
[in-text-ad]
17. Leslie County, Kentucky
> Obesity rate: 43.2% (county) 33.2% (state)
> Adults who do not exercise: 34.3% (county) 30.2% (state)
> Adults with diabetes: 16.0% (county) 10.6% (state)
> Poverty rate: 32.5% (county) 18.5% (state)
[recirclink id=444326]

18. East Carroll Parish, Louisiana
> Obesity rate: 42.1% (county) 33.1% (state)
> Adults who do not exercise: 36.4% (county) 32.2% (state)
> Adults with diabetes: 16.3% (county) 11.6% (state)
> Poverty rate: 48.7% (county) 20.2% (state)

19. Somerset County, Maine
> Obesity rate: 35.0% (county) 28.9% (state)
> Adults who do not exercise: 24.8% (county) 23.3% (state)
> Adults with diabetes: 13.7% (county) 9.6% (state)
> Poverty rate: 18.0% (county) 12.5% (state)
[in-text-ad-2]
20. Somerset County, Maryland
> Obesity rate: 42.2% (county) 28.3% (state)
> Adults who do not exercise: 30.6% (county) 25.3% (state)
> Adults with diabetes: 13.7% (county) 9.8% (state)
> Poverty rate: 25.1% (county) 9.7% (state)

21. Bristol County, Massachusetts
> Obesity rate: 28.3% (county) 23.6% (state)
> Adults who do not exercise: 25.1% (county) 23.5% (state)
> Adults with diabetes: 11.1% (county) 8.5% (state)
> Poverty rate: 12.5% (county) 10.4% (state)
[in-text-ad]

22. Saginaw County, Michigan
> Obesity rate: 38.9% (county) 31.5% (state)
> Adults who do not exercise: 23.1% (county) 24.4% (state)
> Adults with diabetes: 12.8% (county) 10.4% (state)
> Poverty rate: 17.9% (county) 15.0% (state)
[recirclink id=444046]

23. Pine County, Minnesota
> Obesity rate: 36.2% (county) 25.5% (state)
> Adults who do not exercise: 26.8% (county) 23.5% (state)
> Adults with diabetes: 10.6% (county) 7.4% (state)
> Poverty rate: 13.7% (county) 9.9% (state)

24. Claiborne County, Mississippi
> Obesity rate: 47.6% (county) 35.1% (state)
> Adults who do not exercise: 34.5% (county) 38.1% (state)
> Adults with diabetes: 17.0% (county) 12.9% (state)
> Poverty rate: 41.2% (county) 20.8% (state)
[in-text-ad-2]

25. Saline County, Missouri
> Obesity rate: 37.6% (county) 30.4% (state)
> Adults who do not exercise: 29.7% (county) 28.3% (state)
> Adults with diabetes: 11.0% (county) 9.6% (state)
> Poverty rate: 17.1% (county) 14.0% (state)
26. Big Horn County, Montana
> Obesity rate: 38.8% (county) 24.6% (state)
> Adults who do not exercise: 25.9% (county) 22.5% (state)
> Adults with diabetes: 13.4% (county) 7.7% (state)
> Poverty rate: 27.8% (county) 13.3% (state)
[in-text-ad]
27. Thurston County, Nebraska
> Obesity rate: 41.8% (county) 29.6% (state)
> Adults who do not exercise: 29.7% (county) 25.3% (state)
> Adults with diabetes: 16.8% (county) 9.2% (state)
> Poverty rate: 31.5% (county) 11.4% (state)
[recirclink id=443940]

28. Nye County, Nevada
> Obesity rate: 31.5% (county) 26.2% (state)
> Adults who do not exercise: 29.7% (county) 23.7% (state)
> Adults with diabetes: 12.5% (county) 9.6% (state)
> Poverty rate: 17.2% (county) 13.8% (state)
[in-text-ad-2]

29. Belknap County, New Hampshire
> Obesity rate: 31.3% (county) 26.7% (state)
> Adults who do not exercise: 22.6% (county) 22.4% (state)
> Adults with diabetes: 10.6% (county) 9.2% (state)
> Poverty rate: 10.3% (county) 7.3% (state)
30. Cumberland County, New Jersey
> Obesity rate: 34.5% (county) 26.3% (state)
> Adults who do not exercise: 28.3% (county) 26.8% (state)
> Adults with diabetes: 11.6% (county) 9.2% (state)
> Poverty rate: 18.5% (county) 10.4% (state)
31. McKinley County, New Mexico
> Obesity rate: 35.1% (county) 26.4% (state)
> Adults who do not exercise: 24.3% (county) 24.3% (state)
> Adults with diabetes: 13.6% (county) 10.7% (state)
> Poverty rate: 38.1% (county) 19.8% (state)
[in-text-ad]
32. Lewis County, New York
> Obesity rate: 33.7% (county) 25.4% (state)
> Adults who do not exercise: 21.4% (county) 26.7% (state)
> Adults with diabetes: 14.6% (county) 10.6% (state)
> Poverty rate: 14.0% (county) 14.7% (state)
[recirclink id=443564]

33. Edgecombe County, North Carolina
> Obesity rate: 40.8% (county) 29.4% (state)
> Adults who do not exercise: 32.1% (county) 26.6% (state)
> Adults with diabetes: 16.4% (county) 11.4% (state)
> Poverty rate: 25.7% (county) 15.4% (state)
34. Rolette County, North Dakota
> Obesity rate: 41.4% (county) 31% (state)
> Adults who do not exercise: 29.6% (county) 27.6% (state)
> Adults with diabetes: 12.9% (county) 8.9% (state)
> Poverty rate: 31.6% (county) 10.7% (state)
[in-text-ad-2]

35. Lawrence County, Ohio
> Obesity rate: 38.8% (county) 30.4% (state)
> Adults who do not exercise: 35.6% (county) 28.5% (state)
> Adults with diabetes: 17.7% (county) 10.4% (state)
> Poverty rate: 18.4% (county) 14.6% (state)

36. Washita County, Oklahoma
> Obesity rate: 40.6% (county) 32.5% (state)
> Adults who do not exercise: 29.7% (county) 33.0% (state)
> Adults with diabetes: 12.6% (county) 11.0% (state)
> Poverty rate: 15.9% (county) 16.3% (state)
[in-text-ad]
[recirclink id=443882]

37. Polk County, Oregon
> Obesity rate: 34.5% (county) 26.5% (state)
> Adults who do not exercise: 15.9% (county) 18.5% (state)
> Adults with diabetes: 13.9% (county) 9.2% (state)
> Poverty rate: 15.5% (county) 13.3% (state)
38. Fayette County, Pennsylvania
> Obesity rate: 38.5% (county) 30% (state)
> Adults who do not exercise: 30.7% (county) 26.3% (state)
> Adults with diabetes: 15.9% (county) 10.1% (state)
> Poverty rate: 18.6% (county) 12.9% (state)
[in-text-ad-2]
39. Kent County, Rhode Island
> Obesity rate: 28.8% (county) 27.3% (state)
> Adults who do not exercise: 21.9% (county) 26.9% (state)
> Adults with diabetes: 12.8% (county) 9.3% (state)
> Poverty rate: 8.2% (county) 12.8% (state)

40. Lee County, South Carolina
> Obesity rate: 44.3% (county) 31.7% (state)
> Adults who do not exercise: 30.3% (county) 26.9% (state)
> Adults with diabetes: 16.9% (county) 12.5% (state)
> Poverty rate: 28.2% (county) 15.3% (state)
41. Shannon County, South Dakota
> Obesity rate: 42.9% (county) 29.9% (state)
> Adults who do not exercise: 21.6% (county) 23.8% (state)
> Adults with diabetes: 15.8% (county) 9.1% (state)
> Poverty rate: 0.0% (county) 13.3% (state)
[in-text-ad]

42. McNairy County, Tennessee
> Obesity rate: 38.6% (county) 33.7% (state)
> Adults who do not exercise: 35.4% (county) 37.2% (state)
> Adults with diabetes: 16.9% (county) 12.2% (state)
> Poverty rate: 23.1% (county) 15.8% (state)
[recirclink id=443620]
43. Angelina County, Texas
> Obesity rate: 37.5% (county) 30.9% (state)
> Adults who do not exercise: 29.4% (county) 30.1% (state)
> Adults with diabetes: 12.9% (county) 10.9% (state)
> Poverty rate: 19.6% (county) 15.6% (state)

44. Box Elder County, Utah
> Obesity rate: 33.5% (county) 24.1% (state)
> Adults who do not exercise: 20.3% (county) 20.6% (state)
> Adults with diabetes: 9.9% (county) 7.1% (state)
> Poverty rate: 10.3% (county) 10.2% (state)
[in-text-ad-2]
45. Essex County, Vermont
> Obesity rate: 29.8% (county) 24.7% (state)
> Adults who do not exercise: 26.7% (county) 20.5% (state)
> Adults with diabetes: 14.1% (county) 7.8% (state)
> Poverty rate: 14.8% (county) 11.9% (state)
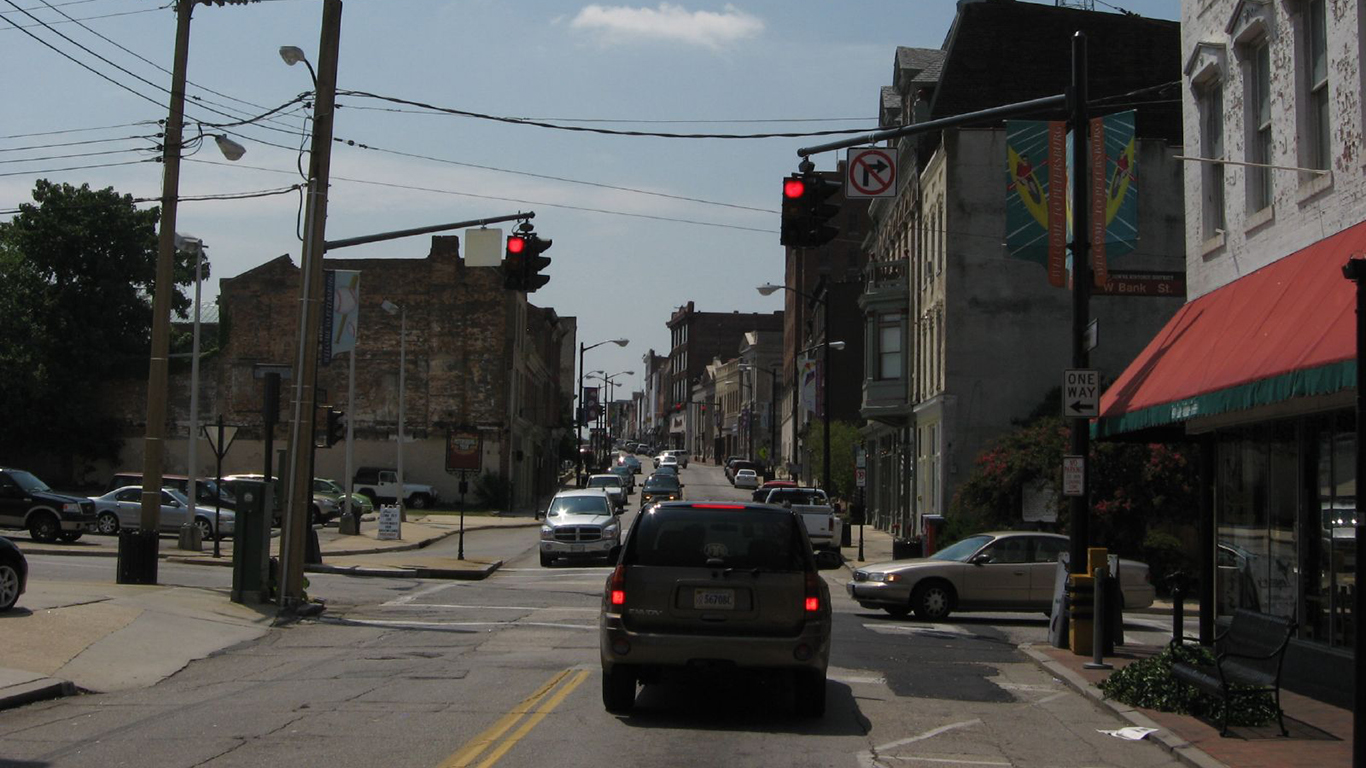
46. Petersburg city, Virginia
> Obesity rate: 41.4% (county) 27.2% (state)
> Adults who do not exercise: 26.0% (county) 25.5% (state)
> Adults with diabetes: 15.6% (county) 9.8% (state)
> Poverty rate: 29.4% (county) 11.0% (state)
[in-text-ad]

47. Grays Harbor County, Washington
> Obesity rate: 36.9% (county) 27.2% (state)
> Adults who do not exercise: 25.5% (county) 20.0% (state)
> Adults with diabetes: 11.6% (county) 8.6% (state)
> Poverty rate: 16.6% (county) 11.3% (state)
[recirclink id=443575]

48. McDowell County, West Virginia
> Obesity rate: 42.1% (county) 35.1% (state)
> Adults who do not exercise: 37.5% (county) 31.4% (state)
> Adults with diabetes: 17.6% (county) 13.0% (state)
> Poverty rate: 37.6% (county) 17.9% (state)
49. Menominee County, Wisconsin
> Obesity rate: 42.5% (county) 29.8% (state)
> Adults who do not exercise: 29.4% (county) 23.8% (state)
> Adults with diabetes: 13.9% (county) 8.2% (state)
> Poverty rate: 33.1% (county) 11.8% (state)
[in-text-ad-2]

50. Campbell County, Wyoming
> Obesity rate: 34.3% (county) 27.8% (state)
> Adults who do not exercise: 24.2% (county) 25.1% (state)
> Adults with diabetes: 7.0% (county) 8.6% (state)
> Poverty rate: 8.1% (county) 11.3% (state)
Detailed Findings & Methodology
The causes of obesity differ from one person to the next with some, such as genetic predisposition, outside of an individual’s control. However, across broad populations, certain unhealthy behaviors tend to be more common in populations with higher obesity rates.
Regular physical exercise can reduce the likelihood of obesity. Areas in which larger shares of adults regularly engage in physical activities — such as jogging, biking, or even gardening — often report lower than average obesity rates. In most of the counties on this list, adult physical inactivity rates are higher than they are across their respective state as a whole.
Poor diet is another factor that can lead to obesity — and diet is often significantly affected by economic circumstances. Low-income Americans can afford fewer healthy options related to diet. Cheap foods available at fast food restaurants and convenience stores tend to be calorie heavy and provide far less nutrients than more pricey foods available at grocery stores, such as fresh fruits, vegetables, and lean proteins. Partially as a result, poorer populations appear to be at greater risk of obesity than higher-income populations. Forty-three of the 50 counties on this list have a higher poverty rate than the poverty rates across their respective states.
Areas with higher obesity rates also tend to report higher incidence rates of certain diseases and conditions. For example, Type 2 diabetes is a chronic condition that develops over many years, and is often the result of obesity and unhealthy lifestyles characterized by poor diet and inadequate physical activity. Of the 50 counties on this list, 46 are home to a larger share of adults with diabetes than the state as a whole.
To determine the most obese county in every state, 24/7 Wall St. reviewed county-level obesity rates from the Centers for Disease Control and Prevention’s Behavioral Risk Factor Surveillance System for 2013, the most recent year for which data is available. Statewide obesity rates, physical activity rates, and diabetes prevalence for the same year also come from the CDC. We also considered poverty rates from the U.S. Census Bureau’s 2016 American Community Survey.
Contact [email protected] for any questions or corrections.