[cnxvideo id=”655412″ placement=”ros”]The organizational structure of state and local government varies heavily across the country. Public education, law enforcement, emergency services, public hospitals, and road maintenance are all largely funded by state tax dollars, and some state and local governments have much greater economic output than others.
The gross domestic product per capita of state and local government ranges from $3,870 in Indiana to $8,563 in Alaska. There are several major factors that account for the differences in government size among states. The income of residents, personal income and corporate taxes, and population density are some of the biggest factors that correlate with state and local government GDP. Additionally, states with the highest government GDP per capita often have major mining industries that generate government revenue through royalties and corporate taxes.
To determine the states with the biggest (and smallest) governments, 24/7 Wall St. ranked states based on GDP per capita of state and local governments in 2016, with data from the Bureau of Economic Analysis.
Click here to see the states with the biggest and smallest governments.
Click here to see our detailed findings and methodology.

50. Indiana
> State and local gov’t. GDP per capita: $3,870
> Total GDP per capita: $52,043 (23rd lowest)
> Gov’t. employees: 12.6% of workforce (11th lowest)
> Median household income: $52,314 (16th lowest)
[in-text-ad]

49. Florida
> State and local gov’t. GDP per capita: $3,907
> Total GDP per capita: $45,137 (12th lowest)
> Gov’t. employees: 11.1% of workforce (4th lowest)
> Median household income: $50,860 (13th lowest)
[recirclink id=444492]

48. Arkansas
> State and local gov’t. GDP per capita: $4,165
> Total GDP per capita: $40,584 (3rd lowest)
> Gov’t. employees: 15.4% of workforce (14th highest)
> Median household income: $44,334 (3rd lowest)

47. Tennessee
> State and local gov’t. GDP per capita: $4,189
> Total GDP per capita: $49,930 (16th lowest)
> Gov’t. employees: 12.6% of workforce (9th lowest)
> Median household income: $48,547 (8th lowest)
[in-text-ad-2]
46. Arizona
> State and local gov’t. GDP per capita: $4,198
> Total GDP per capita: $43,912 (7th lowest)
> Gov’t. employees: 12.7% of workforce (13th lowest)
> Median household income: $53,558 (20th lowest)

45. Idaho
> State and local gov’t. GDP per capita: $4,233
> Total GDP per capita: $40,767 (4th lowest)
> Gov’t. employees: 15.3% of workforce (15th highest)
> Median household income: $51,807 (15th lowest)
[in-text-ad]

44. Georgia
> State and local gov’t. GDP per capita: $4,243
> Total GDP per capita: $51,662 (22nd lowest)
> Gov’t. employees: 13.1% of workforce (15th lowest)
> Median household income: $53,559 (21st lowest)
[recirclink id=444468]

43. Pennsylvania
> State and local gov’t. GDP per capita: $4,286
> Total GDP per capita: $56,629 (21st highest)
> Gov’t. employees: 10.0% of workforce (2nd lowest)
> Median household income: $56,907 (23rd highest)

42. Kentucky
> State and local gov’t. GDP per capita: $4,291
> Total GDP per capita: $44,068 (8th lowest)
> Gov’t. employees: 14.4% of workforce (21st highest)
> Median household income: $46,659 (6th lowest)
[in-text-ad-2]

41. Missouri
> State and local gov’t. GDP per capita: $4,311
> Total GDP per capita: $48,757 (14th lowest)
> Gov’t. employees: 13.2% of workforce (17th lowest)
> Median household income: $51,746 (14th lowest)

40. Maine
> State and local gov’t. GDP per capita: $4,385
> Total GDP per capita: $44,668 (10th lowest)
> Gov’t. employees: 13.5% of workforce (21st lowest)
> Median household income: $53,079 (19th lowest)
[in-text-ad]
39. Michigan
> State and local gov’t. GDP per capita: $4,407
> Total GDP per capita: $49,039 (15th lowest)
> Gov’t. employees: 12.6% of workforce (10th lowest)
> Median household income: $52,492 (18th lowest)
[recirclink id=444391]

38. Louisiana
> State and local gov’t. GDP per capita: $4,509
> Total GDP per capita: $50,751 (19th lowest)
> Gov’t. employees: 14.8% of workforce (19th highest)
> Median household income: $45,146 (4th lowest)

37. Alabama
> State and local gov’t. GDP per capita: $4,540
> Total GDP per capita: $41,988 (5th lowest)
> Gov’t. employees: 16.5% of workforce (8th highest)
> Median household income: $46,257 (5th lowest)
[in-text-ad-2]

36. Mississippi
> State and local gov’t. GDP per capita: $4,572
> Total GDP per capita: $36,482 (the lowest)
> Gov’t. employees: 18.6% of workforce (4th highest)
> Median household income: $41,754 (the lowest)

35. West Virginia
> State and local gov’t. GDP per capita: $4,579
> Total GDP per capita: $39,631 (2nd lowest)
> Gov’t. employees: 18.3% of workforce (5th highest)
> Median household income: $43,385 (2nd lowest)
[in-text-ad]
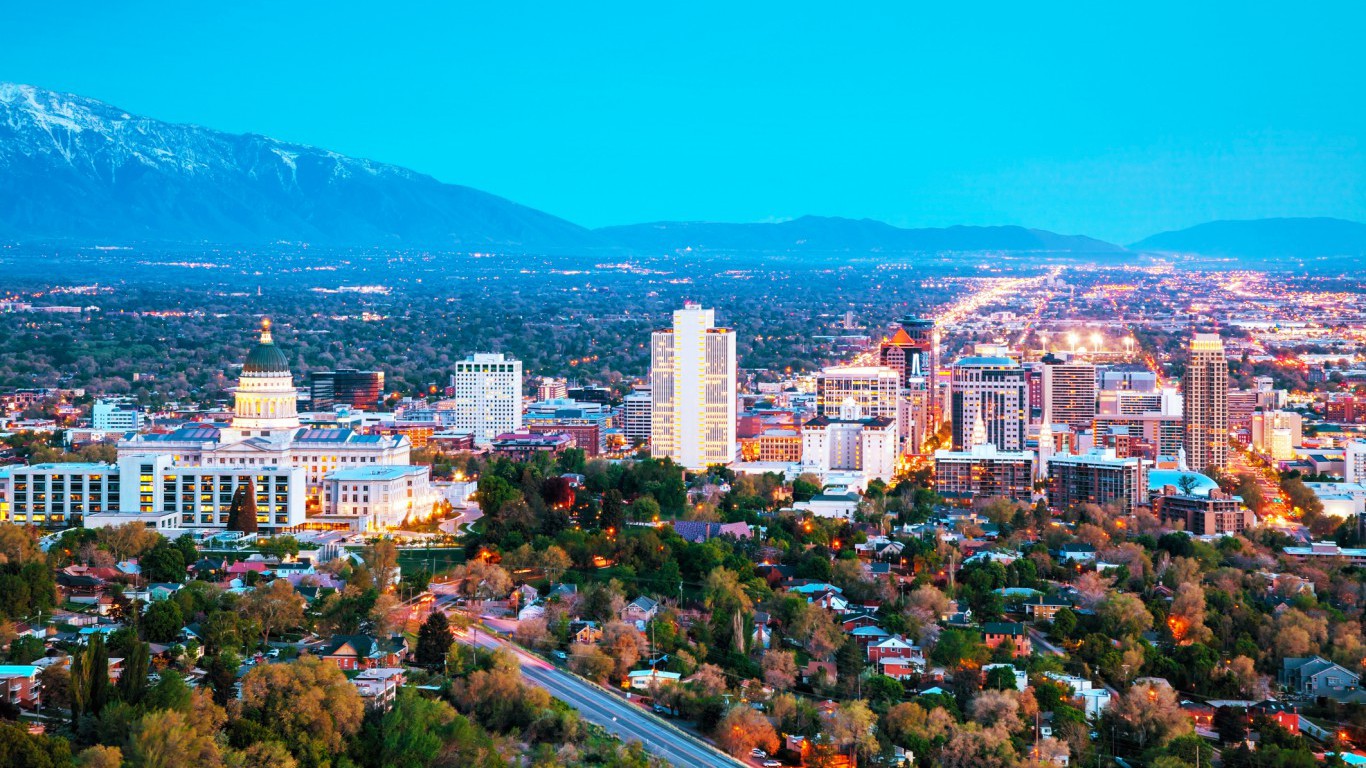
34. Utah
> State and local gov’t. GDP per capita: $4,584
> Total GDP per capita: $51,587 (21st lowest)
> Gov’t. employees: 13.9% of workforce (24th highest)
> Median household income: $65,977 (11th highest)
[recirclink id=444326]

33. Nevada
> State and local gov’t. GDP per capita: $4,588
> Total GDP per capita: $50,413 (18th lowest)
> Gov’t. employees: 10.7% of workforce (3rd lowest)
> Median household income: $55,180 (24th lowest)

32. Montana
> State and local gov’t. GDP per capita: $4,640
> Total GDP per capita: $44,582 (9th lowest)
> Gov’t. employees: 16.4% of workforce (9th highest)
> Median household income: $50,027 (11th lowest)
[in-text-ad-2]

31. Ohio
> State and local gov’t. GDP per capita: $4,665
> Total GDP per capita: $53,759 (25th lowest)
> Gov’t. employees: 12.7% of workforce (12th lowest)
> Median household income: $52,334 (17th lowest)

30. New Hampshire
> State and local gov’t. GDP per capita: $4,734
> Total GDP per capita: $58,318 (19th highest)
> Gov’t. employees: 12.0% of workforce (6th lowest)
> Median household income: $70,936 (7th highest)
[in-text-ad]

29. Texas
> State and local gov’t. GDP per capita: $4,792
> Total GDP per capita: $57,479 (20th highest)
> Gov’t. employees: 13.9% of workforce (23rd highest)
> Median household income: $56,565 (25th highest)
[recirclink id=444046]

28. North Carolina
> State and local gov’t. GDP per capita: $4,792
> Total GDP per capita: $51,088 (20th lowest)
> Gov’t. employees: 14.8% of workforce (20th highest)
> Median household income: $50,584 (12th lowest)

27. Illinois
> State and local gov’t. GDP per capita: $4,811
> Total GDP per capita: $62,251 (13th highest)
> Gov’t. employees: 12.4% of workforce (7th lowest)
> Median household income: $60,960 (16th highest)
[in-text-ad-2]

26. Rhode Island
> State and local gov’t. GDP per capita: $4,922
> Total GDP per capita: $54,435 (24th highest)
> Gov’t. employees: 9.9% of workforce (the lowest)
> Median household income: $60,596 (18th highest)

25. Colorado
> State and local gov’t. GDP per capita: $4,999
> Total GDP per capita: $58,435 (17th highest)
> Gov’t. employees: 14.2% of workforce (22nd highest)
> Median household income: $65,685 (12th highest)
[in-text-ad]
24. South Dakota
> State and local gov’t. GDP per capita: $5,007
> Total GDP per capita: $56,216 (22nd highest)
> Gov’t. employees: 15.7% of workforce (12th highest)
> Median household income: $54,467 (22nd lowest)
[recirclink id=443940]

23. South Carolina
> State and local gov’t. GDP per capita: $5,045
> Total GDP per capita: $42,506 (6th lowest)
> Gov’t. employees: 15.8% of workforce (11th highest)
> Median household income: $49,501 (10th lowest)

22. Wisconsin
> State and local gov’t. GDP per capita: $5,076
> Total GDP per capita: $54,380 (25th highest)
> Gov’t. employees: 12.8% of workforce (14th lowest)
> Median household income: $56,811 (24th highest)
[in-text-ad-2]
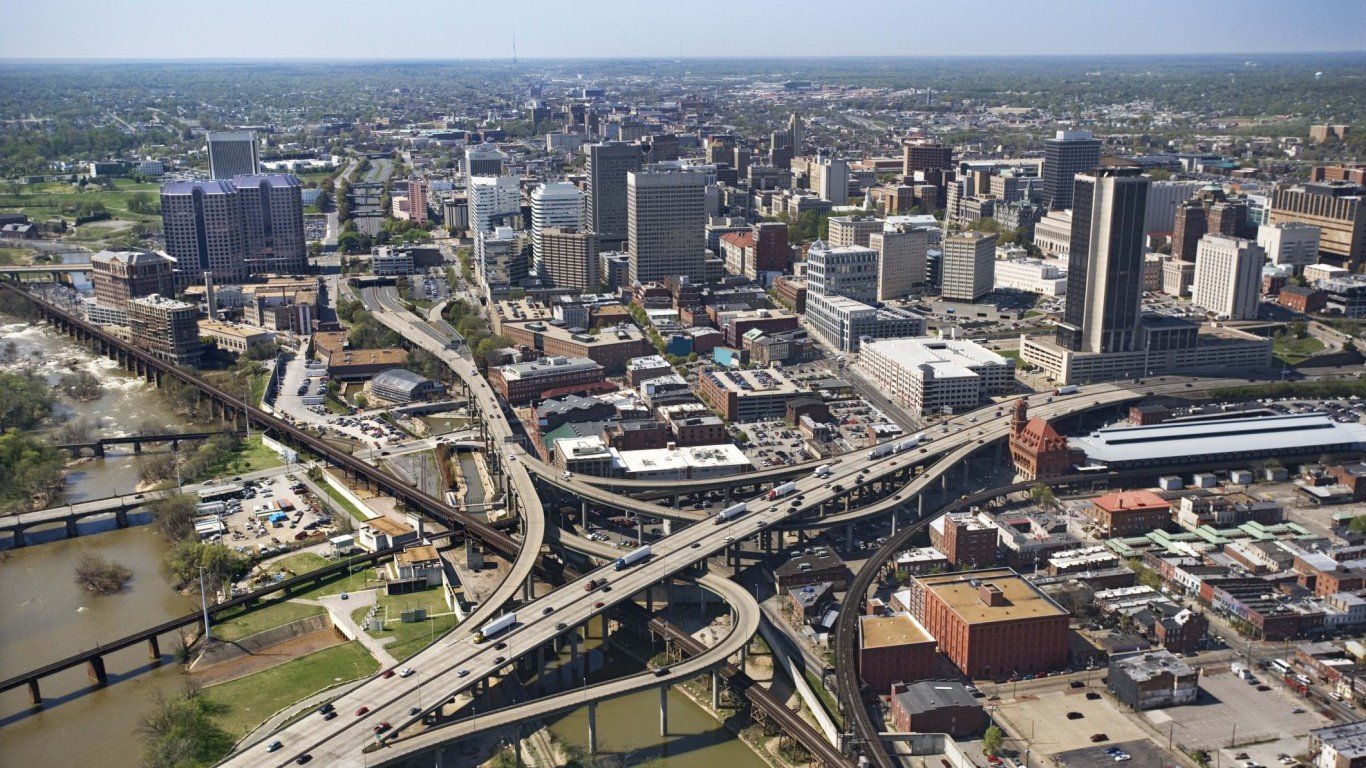
21. Virginia
> State and local gov’t. GDP per capita: $5,109
> Total GDP per capita: $58,397 (18th highest)
> Gov’t. employees: 13.5% of workforce (20th lowest)
> Median household income: $68,114 (8th highest)

20. Maryland
> State and local gov’t. GDP per capita: $5,136
> Total GDP per capita: $63,294 (11th highest)
> Gov’t. employees: 13.2% of workforce (16th lowest)
> Median household income: $78,945 (the highest)
[in-text-ad]

19. Kansas
> State and local gov’t. GDP per capita: $5,193
> Total GDP per capita: $53,248 (24th lowest)
> Gov’t. employees: 16.4% of workforce (10th highest)
> Median household income: $54,935 (23rd lowest)
[recirclink id=443564]

18. Minnesota
> State and local gov’t. GDP per capita: $5,197
> Total GDP per capita: $61,368 (14th highest)
> Gov’t. employees: 13.4% of workforce (19th lowest)
> Median household income: $65,599 (13th highest)

17. Oregon
> State and local gov’t. GDP per capita: $5,384
> Total GDP per capita: $55,462 (23rd highest)
> Gov’t. employees: 13.9% of workforce (25th lowest)
> Median household income: $57,532 (21st highest)
[in-text-ad-2]

16. Oklahoma
> State and local gov’t. GDP per capita: $5,511
> Total GDP per capita: $46,254 (13th lowest)
> Gov’t. employees: 18.0% of workforce (6th highest)
> Median household income: $49,176 (9th lowest)

15. Hawaii
> State and local gov’t. GDP per capita: $5,521
> Total GDP per capita: $59,433 (15th highest)
> Gov’t. employees: 13.9% of workforce (25th highest)
> Median household income: $74,511 (5th highest)
[in-text-ad]

14. Massachusetts
> State and local gov’t. GDP per capita: $5,588
> Total GDP per capita: $74,237 (3rd highest)
> Gov’t. employees: 11.1% of workforce (5th lowest)
> Median household income: $75,297 (4th highest)
[recirclink id=443882]
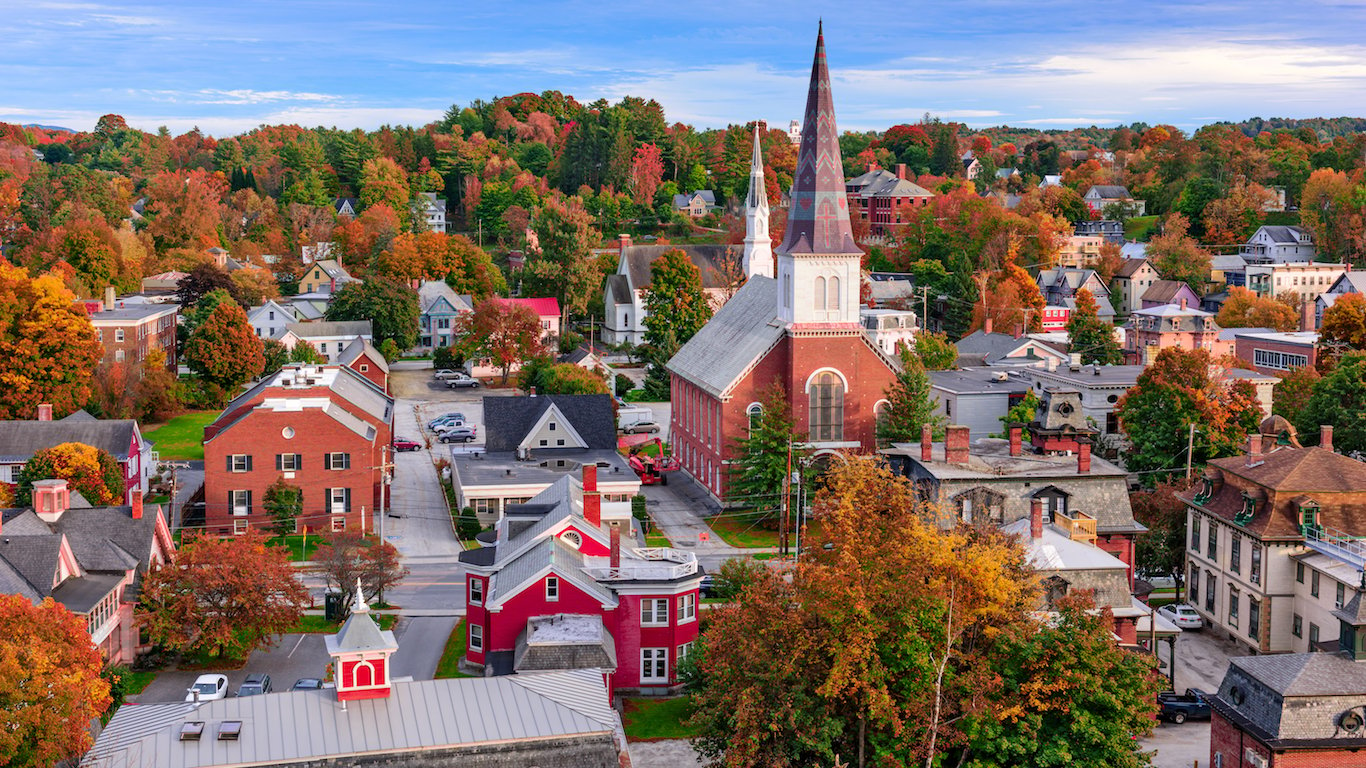
13. Vermont
> State and local gov’t. GDP per capita: $5,618
> Total GDP per capita: $50,100 (17th lowest)
> Gov’t. employees: 15.5% of workforce (13th highest)
> Median household income: $57,677 (20th highest)
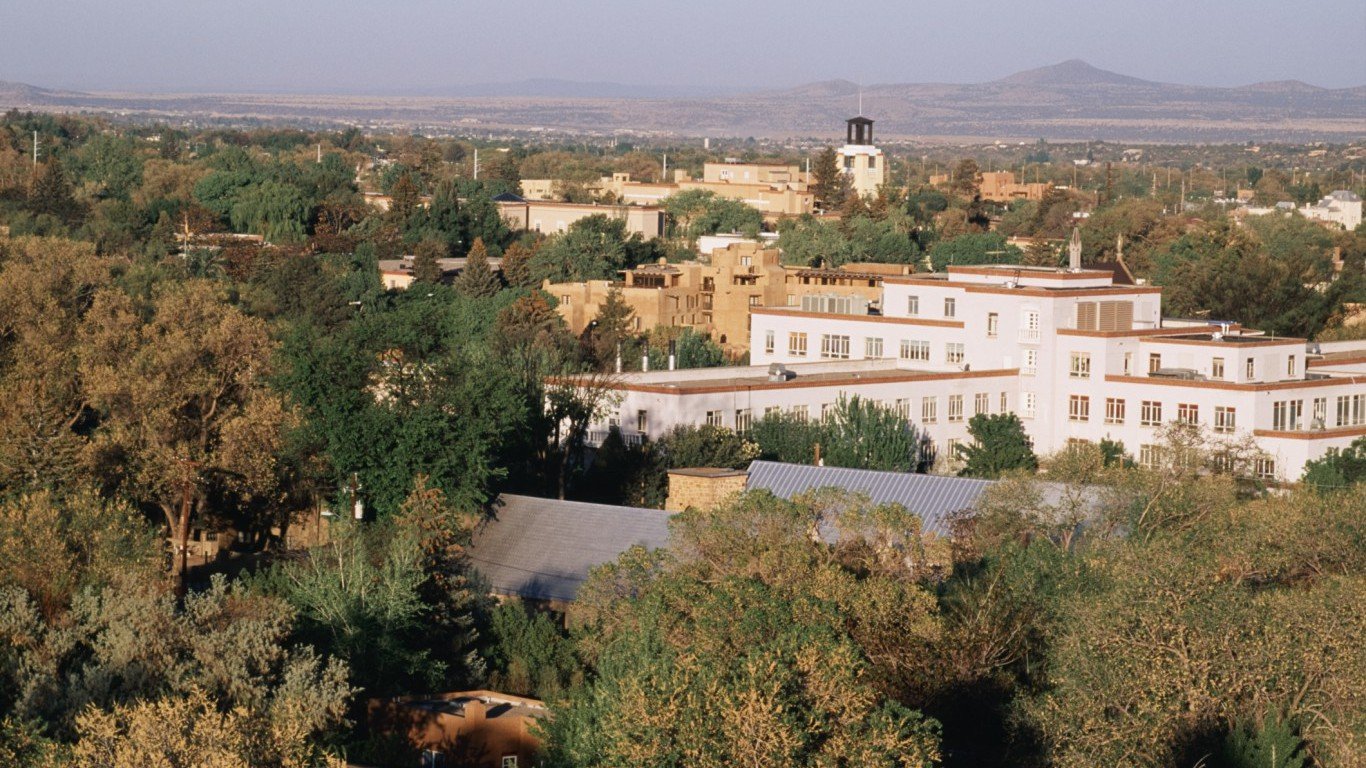
12. New Mexico
> State and local gov’t. GDP per capita: $5,649
> Total GDP per capita: $44,806 (11th lowest)
> Gov’t. employees: 18.7% of workforce (3rd highest)
> Median household income: $46,748 (7th lowest)
[in-text-ad-2]
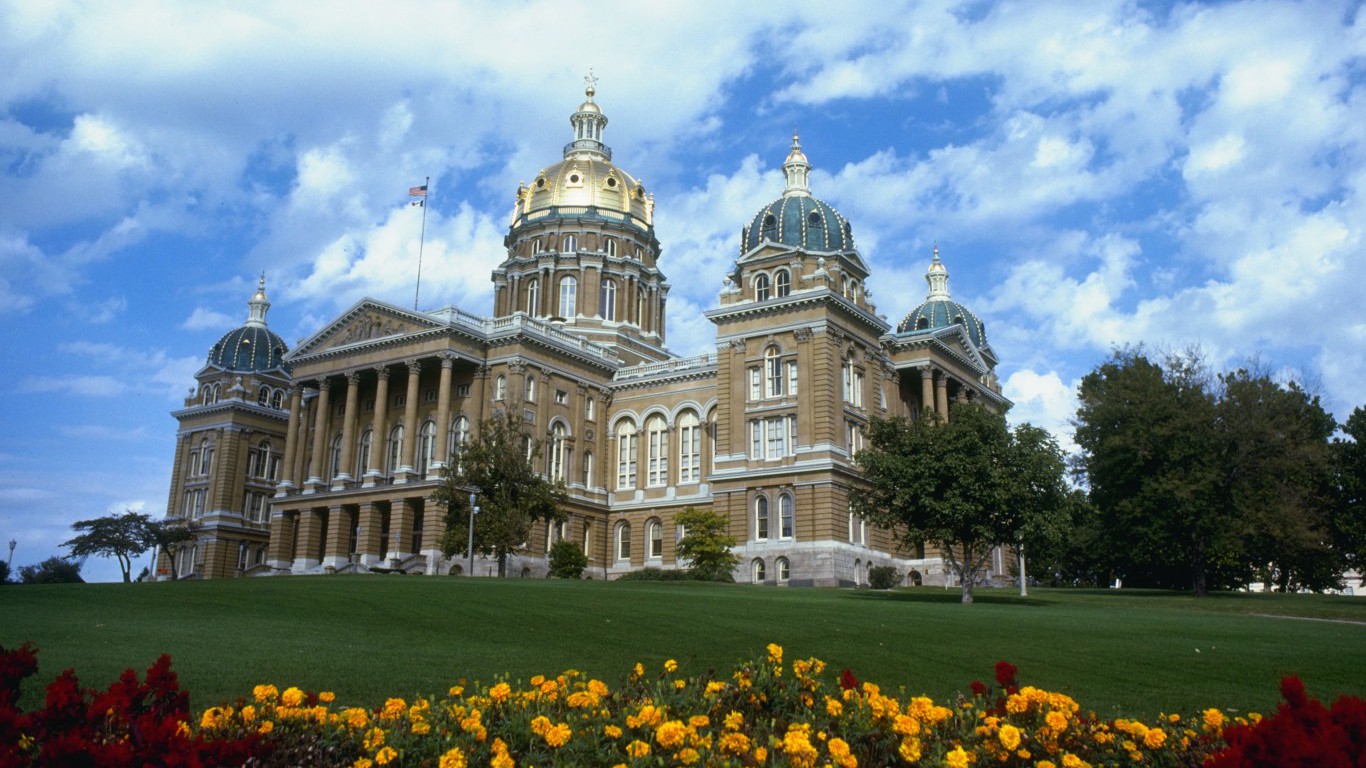
11. Iowa
> State and local gov’t. GDP per capita: $5,751
> Total GDP per capita: $59,400 (16th highest)
> Gov’t. employees: 15.3% of workforce (16th highest)
> Median household income: $56,247 (25th lowest)

10. Delaware
> State and local gov’t. GDP per capita: $5,799
> Total GDP per capita: $74,498 (2nd highest)
> Gov’t. employees: 13.2% of workforce (18th lowest)
> Median household income: $61,757 (15th highest)
[in-text-ad]

9. Connecticut
> State and local gov’t. GDP per capita: $5,898
> Total GDP per capita: $71,870 (4th highest)
> Gov’t. employees: 12.5% of workforce (8th lowest)
> Median household income: $73,433 (6th highest)
[recirclink id=443620]

8. New Jersey
> State and local gov’t. GDP per capita: $6,010
> Total GDP per capita: $64,423 (10th highest)
> Gov’t. employees: 13.6% of workforce (22nd lowest)
> Median household income: $76,126 (3rd highest)

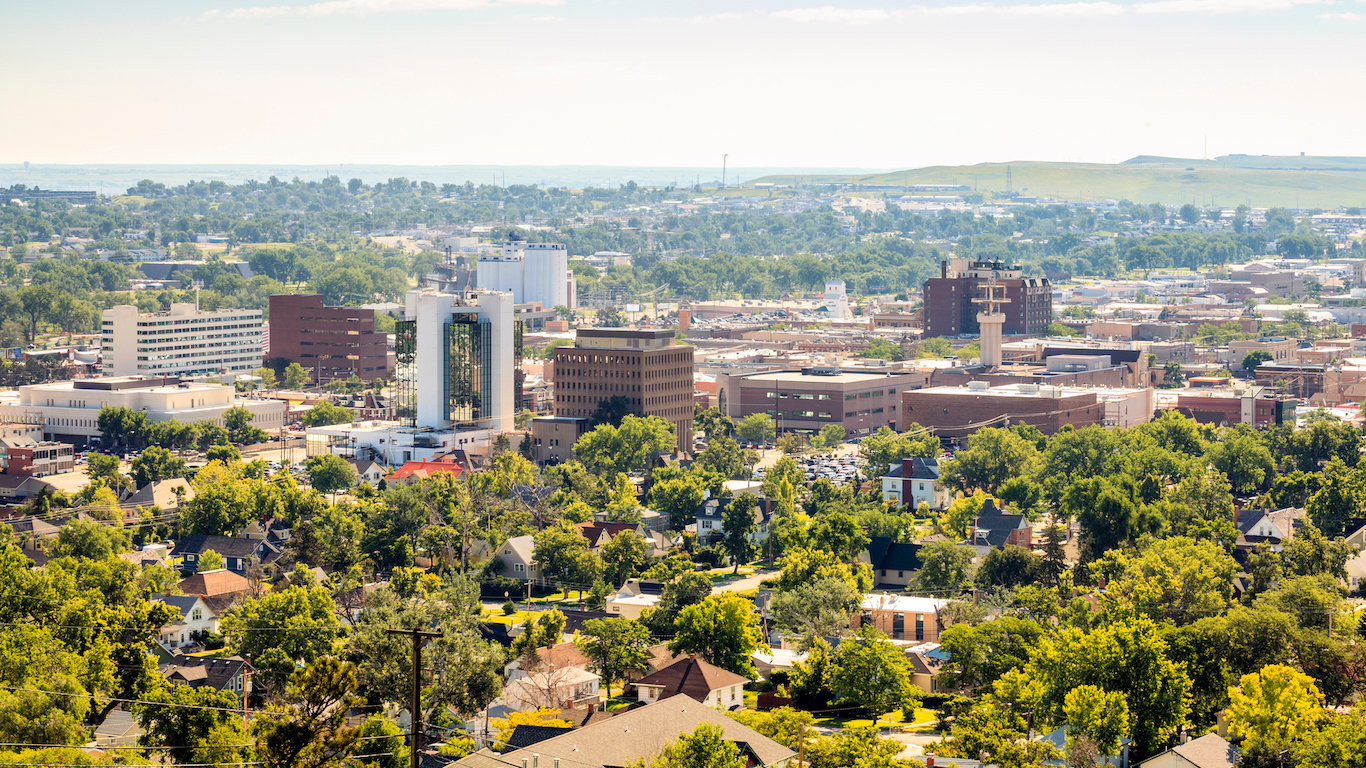
7. Nebraska
> State and local gov’t. GDP per capita: $6,262
> Total GDP per capita: $62,369 (12th highest)
> Gov’t. employees: 15.1% of workforce (18th highest)
> Median household income: $56,927 (22nd highest)
[in-text-ad-2]

6. Washington
> State and local gov’t. GDP per capita: $6,273
> Total GDP per capita: $65,441 (8th highest)
> Gov’t. employees: 15.2% of workforce (17th highest)
> Median household income: $67,106 (10th highest)

5. North Dakota
> State and local gov’t. GDP per capita: $6,312
> Total GDP per capita: $70,358 (5th highest)
> Gov’t. employees: 16.6% of workforce (7th highest)
> Median household income: $60,656 (17th highest)
[in-text-ad]
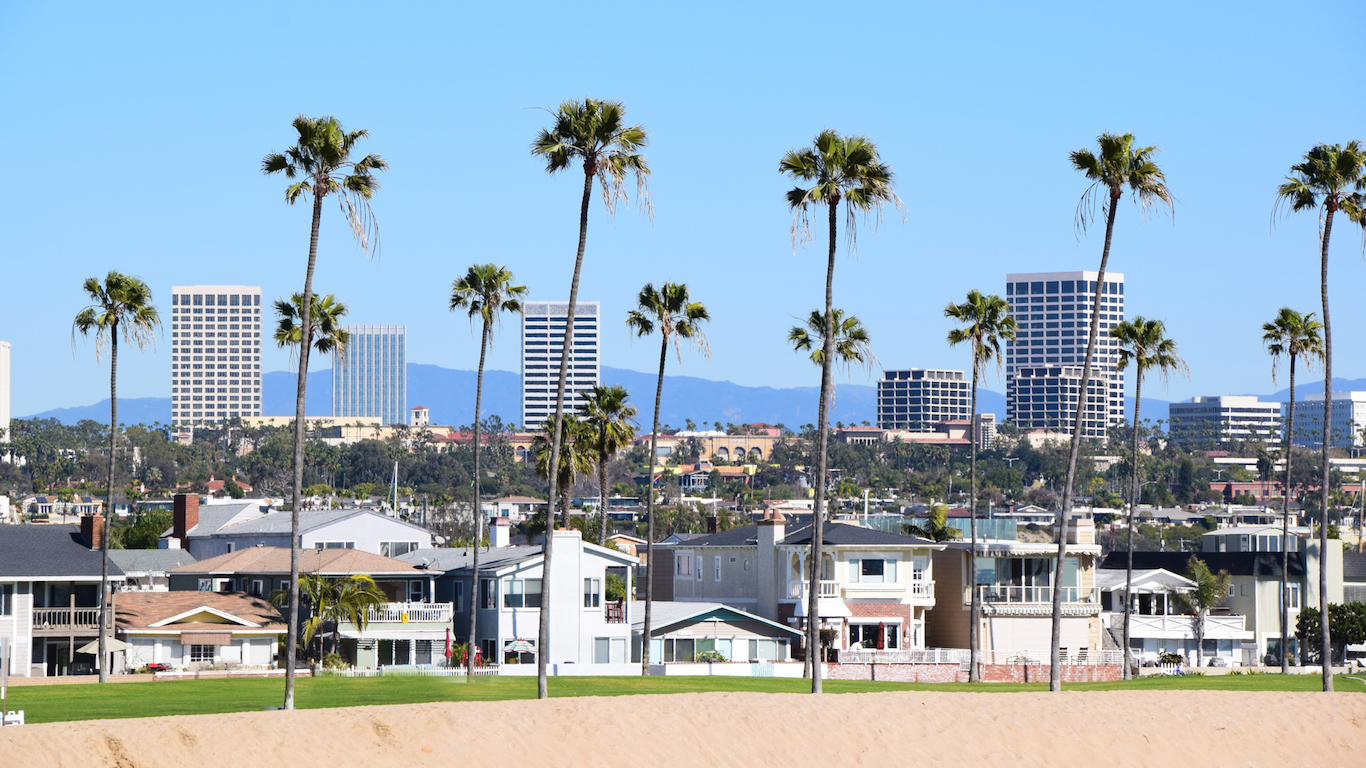
4. California
> State and local gov’t. GDP per capita: $6,403
> Total GDP per capita: $66,742 (7th highest)
> Gov’t. employees: 13.6% of workforce (23rd lowest)
> Median household income: $67,739 (9th highest)
[recirclink id=443575]

3. New York
> State and local gov’t. GDP per capita: $6,967
> Total GDP per capita: $75,975 (the highest)
> Gov’t. employees: 13.9% of workforce (24th lowest)
> Median household income: $62,909 (14th highest)

2. Wyoming
> State and local gov’t. GDP per capita: $8,524
> Total GDP per capita: $64,774 (9th highest)
> Gov’t. employees: 21.7% of workforce (the highest)
> Median household income: $59,882 (19th highest)
[in-text-ad-2]
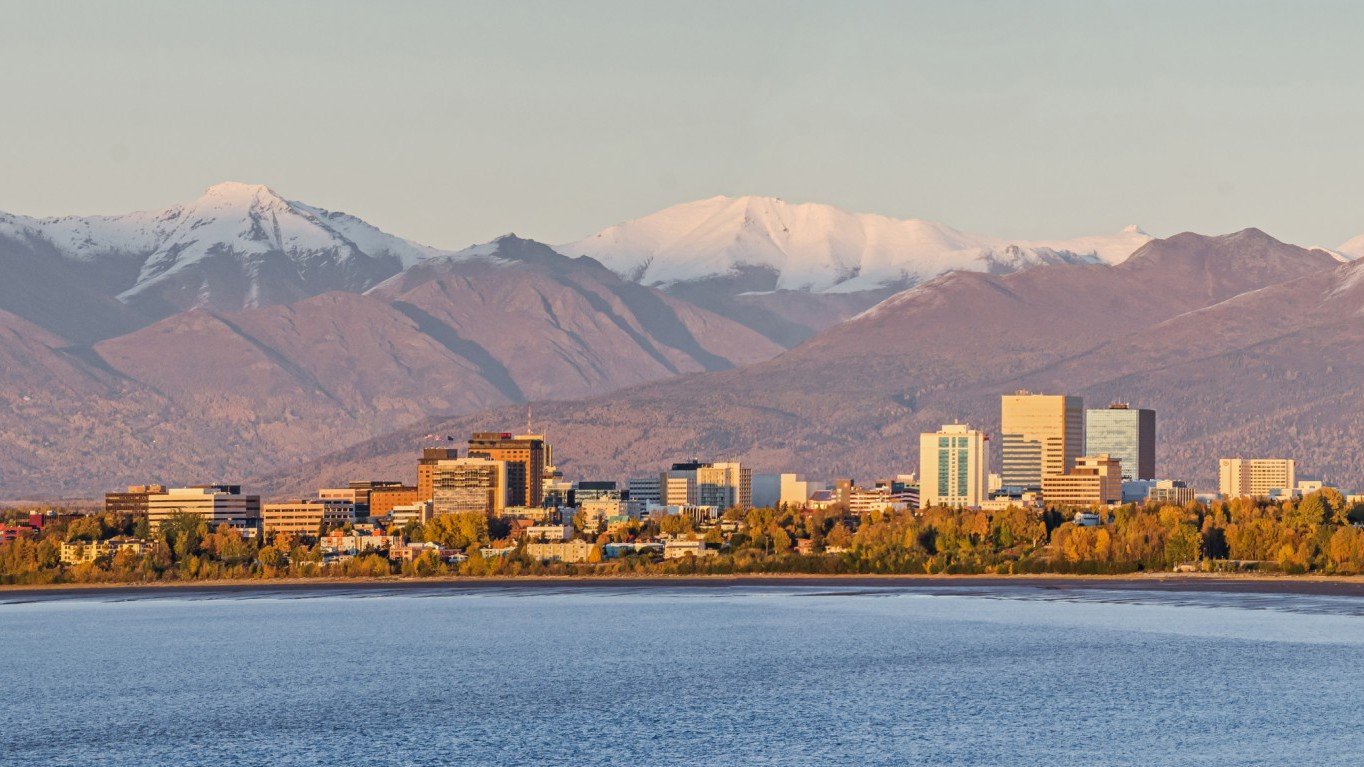
1. Alaska
> State and local gov’t. GDP per capita: $8,563
> Total GDP per capita: $68,126 (6th highest)
> Gov’t. employees: 20.0% of workforce (2nd highest)
> Median household income: $76,440 (2nd highest)
Detailed Findings
The size of a government and range of services it provides often depends on its revenues. States with higher-income residents are more likely to have greater government revenue via taxes, and may have larger state and local governments overall.
GDP is composed of incomes earned and the factors of production in a state. The main components are labor income (the wages, salaries, and other benefits earned by workers), business taxes (excise, sales, property, and other taxes paid by businesses operating in the state), and capital income (income earned by individuals and entrepreneurs).
Government payroll is a large component of GDP. As a result, states with higher costs of living may pay their workers higher salaries and have a higher government GDP per capita. In New York, the state with the third highest government GDP per capita, goods and services cost 15.6% more than they do nationwide, the highest cost of living of any state other than Hawaii. Other high GDP per capita states with high costs of living include California, New Jersey, and Connecticut.
The composition of a state’s population may also have a large effect on the organization of its government. Sparsely populated, rural states need more infrastructure — such as roads, schools, and hospitals — per resident, and may require more local governments per resident. Local governments include county and city governments, as well as specialized entities such as school districts, water authorities, parks districts and other public entities serving a more specific function.
Wyoming, the state with the second-highest government GDP per capita, has approximately six people per square mile and 140 local governments per 100,000 residents, the second lowest population density and third highest concentration of local governments nationwide. Other sparsely populated states with high government GDP per capita and a high concentration of local governments include Alaska, North Dakota, and Nebraska.
Rents and royalties from the energy and mining industries also contribute significantly to government GDP in a number of states. Alaska produces more crude oil than any state other than North Dakota and Texas, and its government is more dependent on the industry than any other state. A majority of revenues come from royalties and corporate taxes on production. While oil production has declined in recent years, Alaska estimates that the petroleum industry will continue to account for roughly 90% of state revenues.
Similarly, a large share of Wyoming state revenue comes from taxes on mineral production. Wyoming is the nation’s largest coal producer, accounting for more than 40% of all U.S. coal production, and is the eighth largest producer of both crude oil and natural gas. While mining activity has fallen in recent decades, Wyoming also has the largest uranium reserves and production of any state, and accounts for 58% of the nation’s total uranium mining employment.
Most government spending is determined by tax structures set in place decades ago. Outside of tax structure, factors that can determine the size of government in a state include incarceration rates, privatization — particularly in health care and corrections — and demographic composition, as different age groups and income levels may require different public services.
Methodology
To determine the states with the biggest (and smallest) governments, 24/7 Wall St. ranked states based on GDP per capita of state and local governments in 2016 with data from the Bureau of Economic Analysis. GDP per capita across all industries for 2016 also came from the BEA. State and local government employees as a share of total employment came from the Bureau of Labor Statistics and is for May 2018. Median household income came from the U.S. Census Bureau’s American Community Survey and is for 2016. All data are for the most recent period available.
Contact [email protected] for any questions or corrections.