
[cnxvideo id=”625473″ placement=”ros”]Money and work are routinely the leading causes of stress in the United States, one of the richest and busiest countries in the world. More recent surveys of the American public have revealed concerns over the future of our nation as the most significant source of stress.
A strong majority of Americans of all ages believes this is the lowest point in our nation’s history that they can remember. And while the economy has mostly recovered from the Great Recession, with aggregate income on the rise, many Americans continue to face rising debt burdens, stagnant wages, and poverty.
According to the American Psychological Association, stress levels of Americans have remained unchanged over the past several years. However, common symptoms of stress such as anxiety, anger, and fatigue, have become more frequently reported.
In its latest annual review of stress in America, the APA identifies the five largest sources of stress of Americans in the following order: the future of our nation, money, work, the current political climate, and violence and crime. 24/7 Wall St. reviewed a range of data in these categories in an attempt to quantify the likelihood of living in stress in each of the nation’s large urban areas.
Stress seems a relatively normal experience among Americans as reported stress levels do not vary much across the United States. The underlying causes of stress, however, vary considerably between regions.
Click here to see the most stressed-out city in every state.
Click here to see our detailed findings and full methodology.

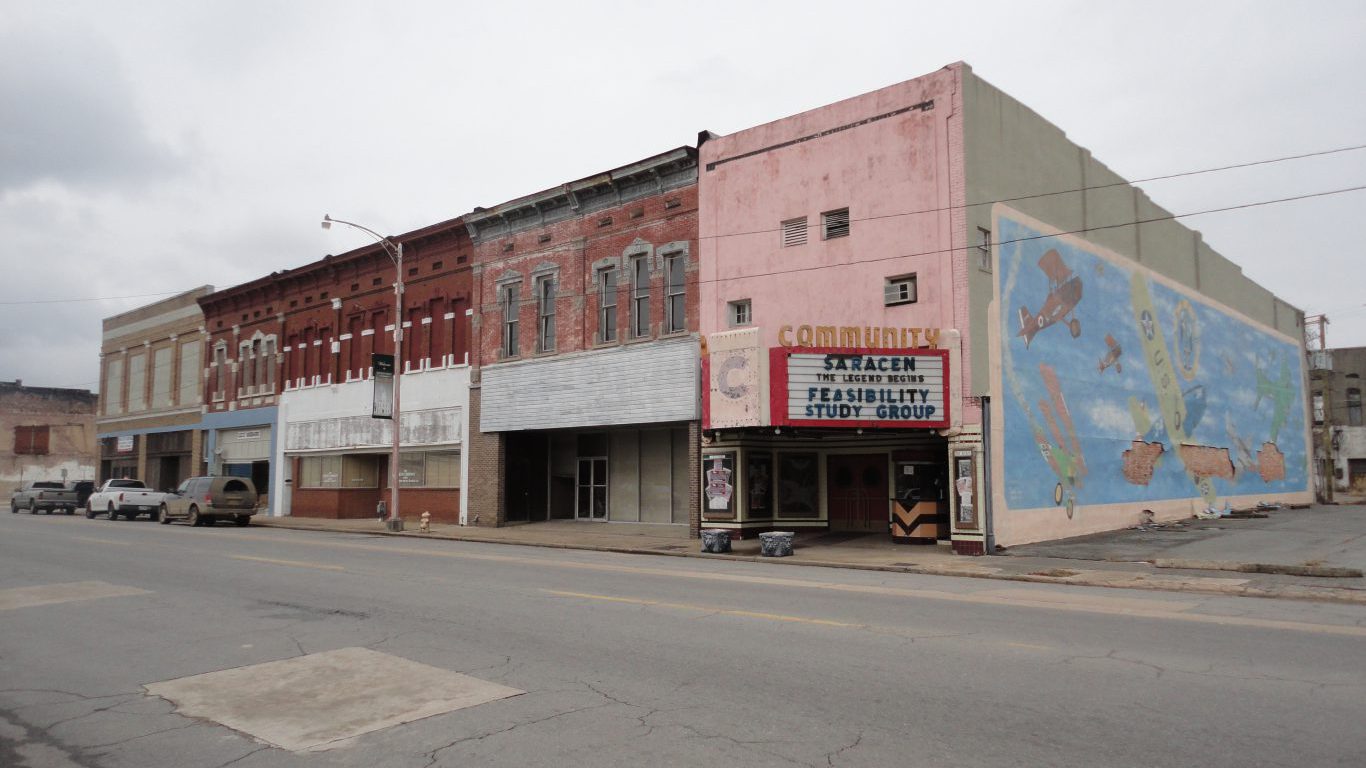
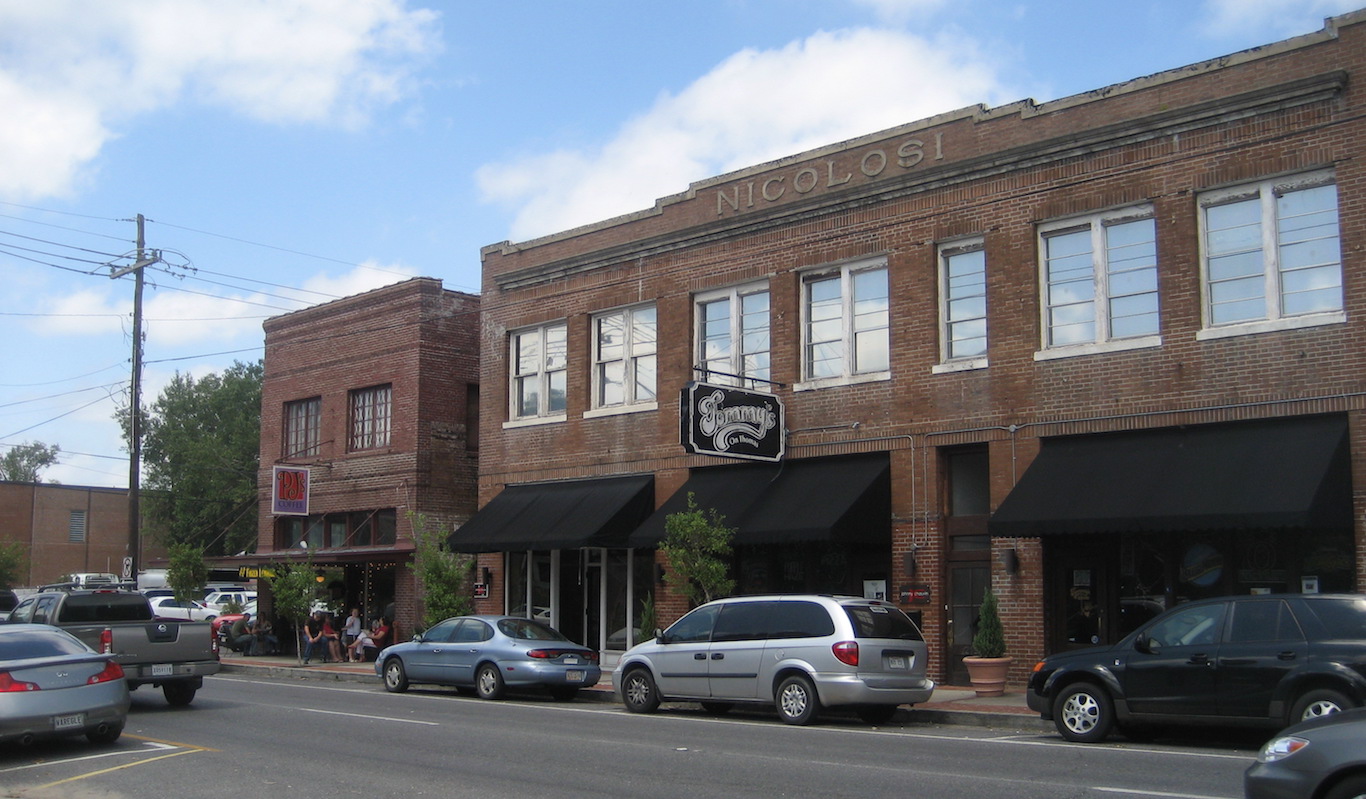
1. Gadsden, Alabama
> Poverty: 16.7%
> Avg. weekly hours worked: 39.8 (highest 25%)
> Unemployment: 3.8%
> Violent crime: 712 per 100,000 people (highest 10%)
> Adults in fair/poor health: 19.7% (highest 25%)
[in-text-ad]

2. Fairbanks, Alaska
> Poverty: 9.9% (lowest 25%)
> Avg. weekly hours worked: 41.8 (highest 10%)
> Unemployment: 6.4% (highest 10%)
> Violent crime: 669 per 100,000 people (highest 10%)
> Adults in fair/poor health: 11.5% (bottom 10%)
[recirclink id=429078]

3. Yuma, Arizona
> Poverty: 18.0% (highest 25%)
> Avg. weekly hours worked: 41.6 (highest 10%)
> Unemployment: 17.2% (highest 10%)
> Violent crime: N/A
> Adults in fair/poor health: 25.1% (highest 10%)
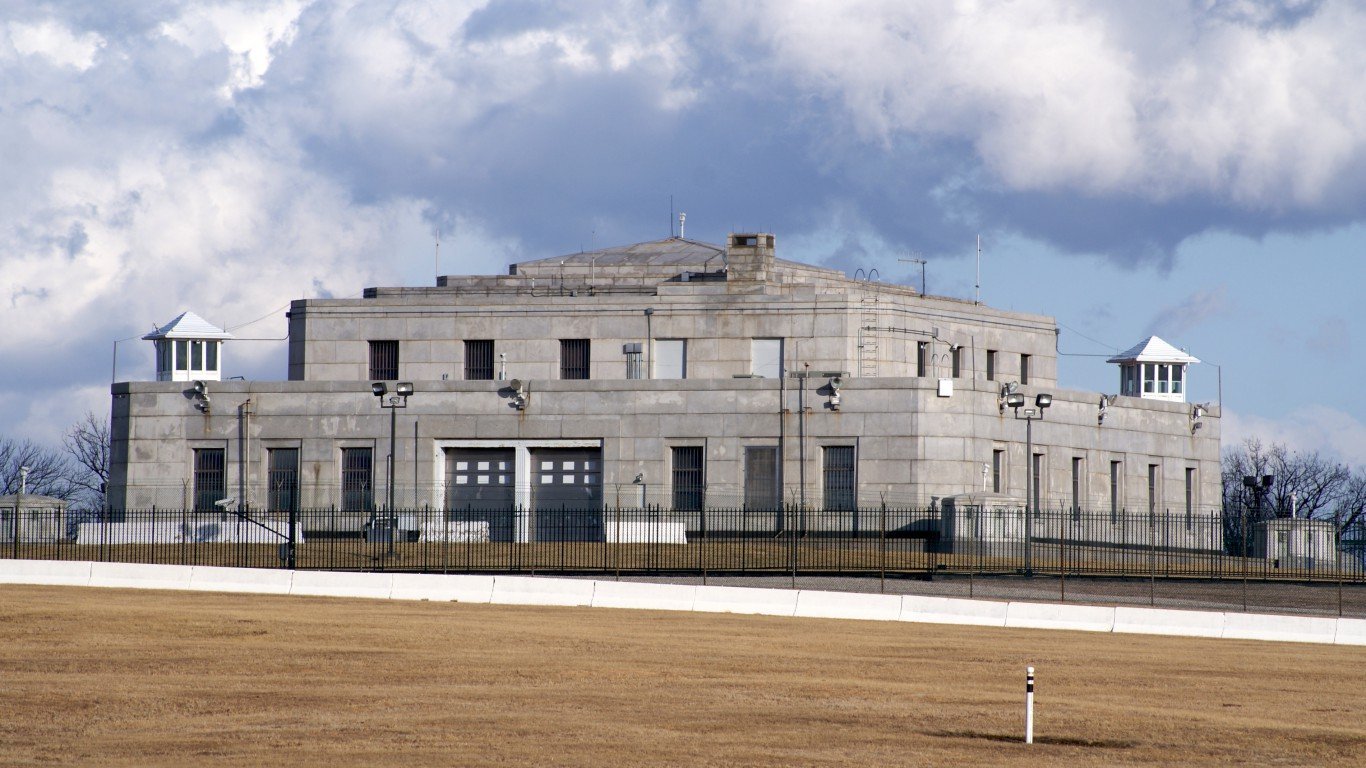
4. Pine Bluff, Arkansas
> Poverty: 21.8% (highest 10%)
> Avg. weekly hours worked: 39.3 (highest 25%)
> Unemployment: 5.1% (highest 25%)
> Violent crime: 909 per 100,000 people (highest 10%)
> Adults in fair/poor health: 25.5% (highest 10%)
[in-text-ad-2]
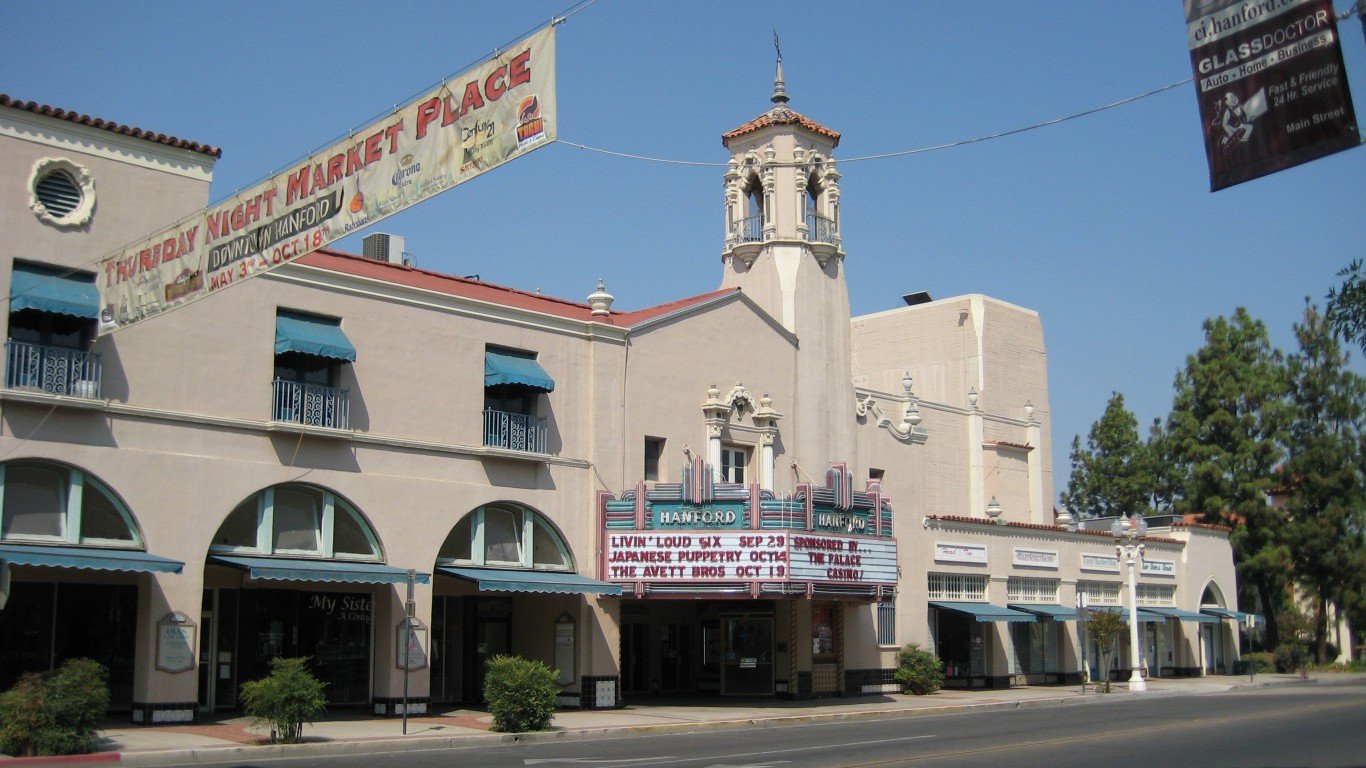
5. Hanford-Corcoran, California
> Poverty: 16.0%
> Avg. weekly hours worked: 40.3 (highest 10%)
> Unemployment: 8.1% (highest 10%)
> Violent crime: 427 per 100,000 people
> Adults in fair/poor health: 22.6% (highest 10%)

6. Colorado Springs, Colorado
> Poverty: 11.5% (lowest 25%)
> Avg. weekly hours worked: 39.5 (highest 25%)
> Unemployment: 3.5%
> Violent crime: 405 per 100,000 people
> Adults in fair/poor health: 13.3% (lowest 25%)
[in-text-ad]
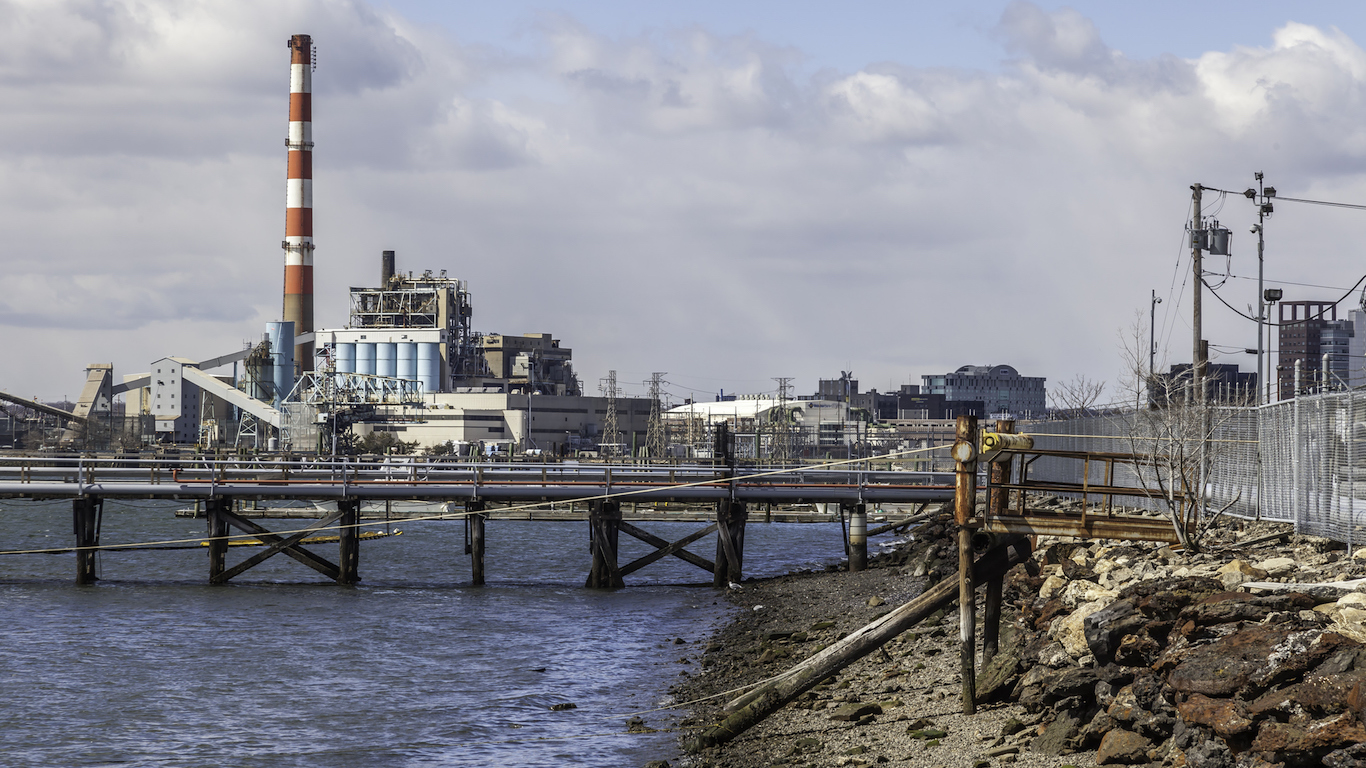
7. Bridgeport-Stamford-Norwalk, Connecticut
> Poverty: 8.6% (bottom 10%)
> Avg. weekly hours worked: 38.2
> Unemployment: 4.8%
> Violent crime: 230 per 100,000 people (lowest 25%)
> Adults in fair/poor health: 13.6% (lowest 25%)
[recirclink id=429326]

8. Dover, Delaware
> Poverty: 13.8%
> Avg. weekly hours worked: 38.2
> Unemployment: 4.9%
> Violent crime: 474 per 100,000 people (highest 25%)
> Adults in fair/poor health: 17.0%

9. Jacksonville, Florida
> Poverty: 12.5%
> Avg. weekly hours worked: 39.8 (highest 25%)
> Unemployment: 3.6%
> Violent crime: 479 per 100,000 people (highest 25%)
> Adults in fair/poor health: 15.2%
[in-text-ad-2]
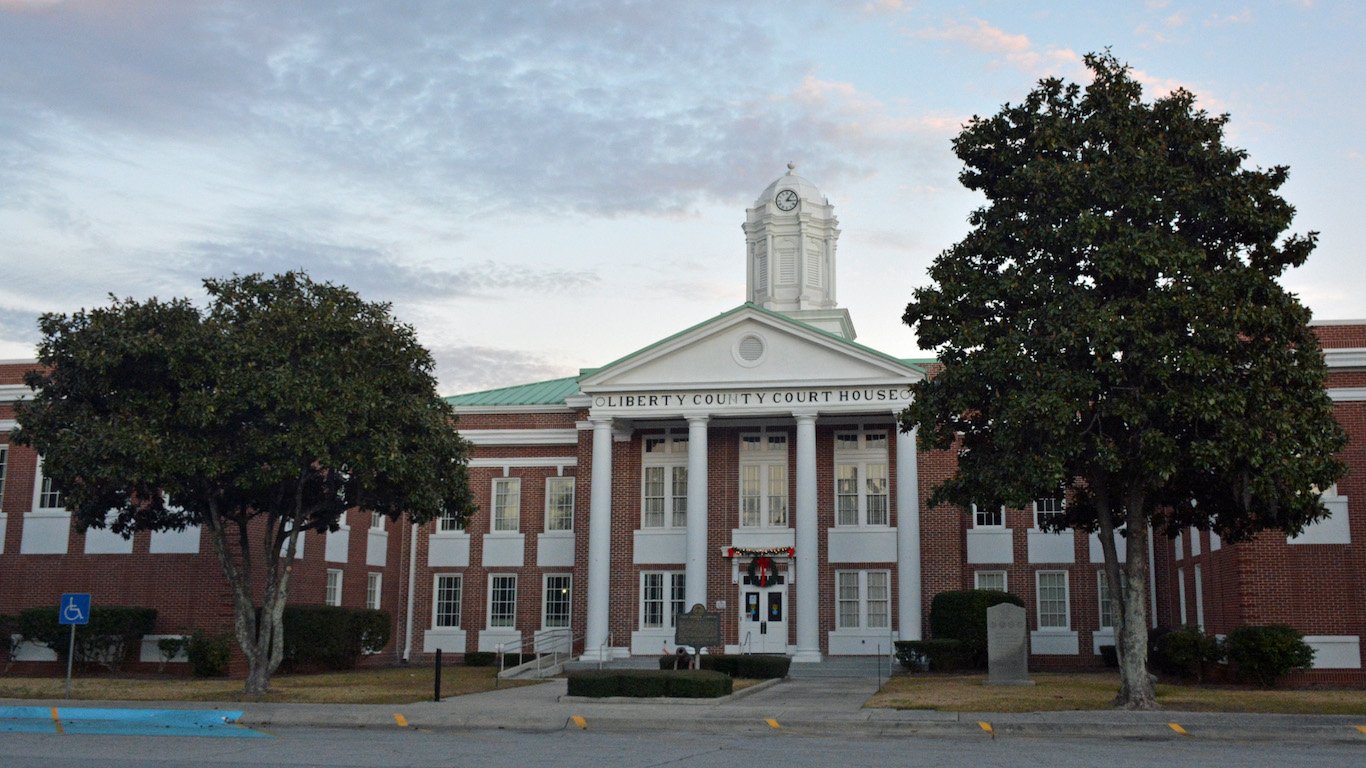
10. Hinesville, Georgia
> Poverty: 14.4%
> Avg. weekly hours worked: 42.7 (highest 10%)
> Unemployment: 4.9%
> Violent crime: 426 per 100,000 people
> Adults in fair/poor health: 20.4% (highest 25%)
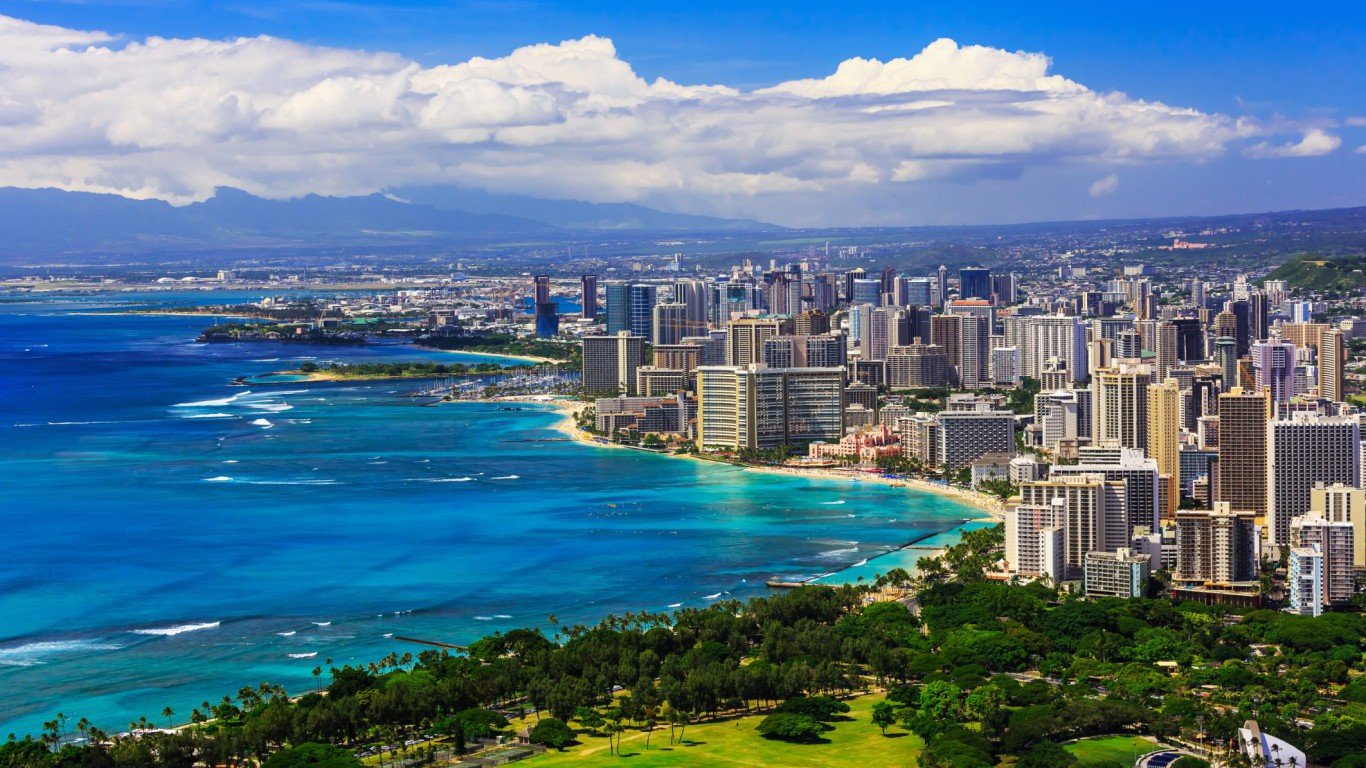
11. Urban Honolulu, Hawaii
> Poverty: 8.5% (bottom 10%)
> Avg. weekly hours worked: 39.3 (highest 25%)
> Unemployment: 1.8% (bottom 10%)
> Violent crime: 335 per 100,000 people
> Adults in fair/poor health: 12.5% (lowest 25%)
[in-text-ad]
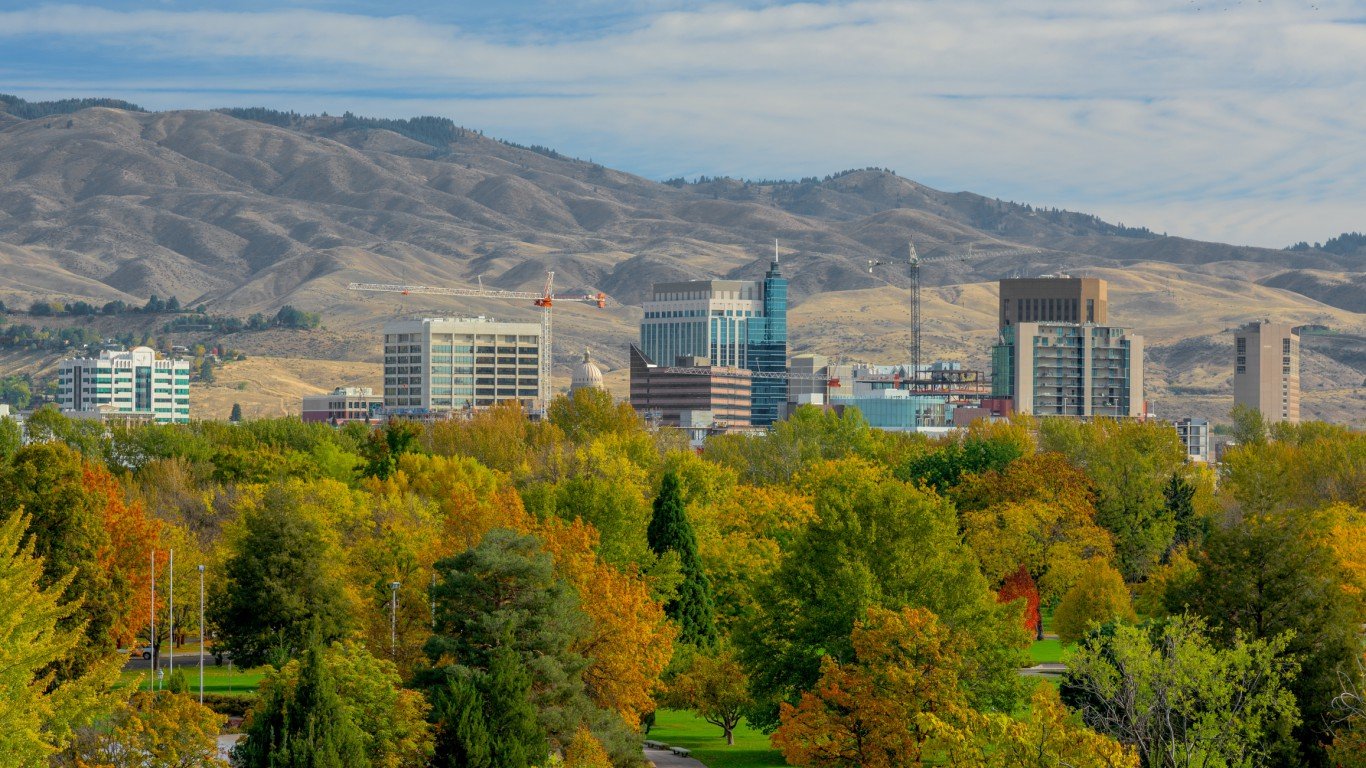
12. Boise City, Idaho
> Poverty: 12.7%
> Avg. weekly hours worked: 38.6
> Unemployment: 2.9% (lowest 25%)
> Violent crime: 244 per 100,000 people (lowest 25%)
> Adults in fair/poor health: 13.2% (lowest 25%)
[recirclink id=428335]
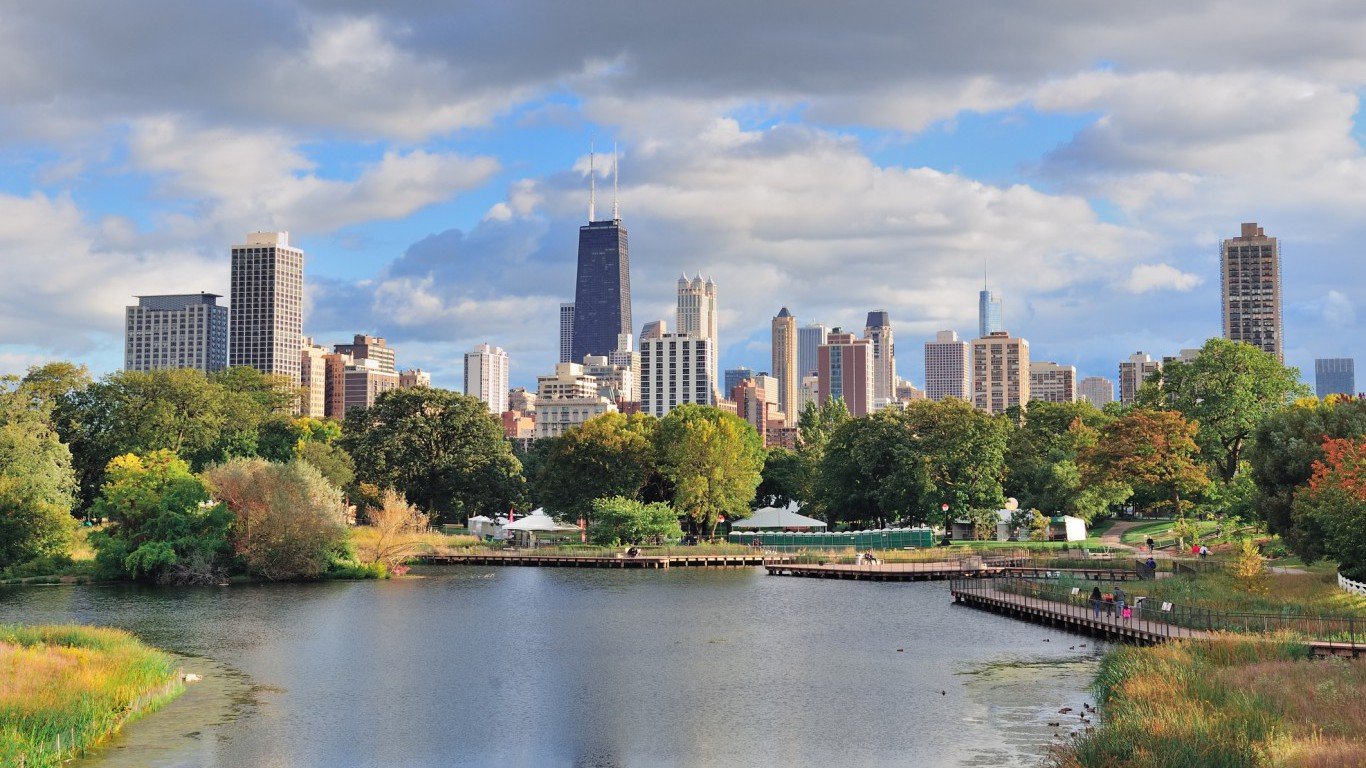
13. Chicago-Naperville-Elgin, Illinois
> Poverty: 12.4%
> Avg. weekly hours worked: 38.7
> Unemployment: 5.2% (highest 25%)
> Violent crime: 443 per 100,000 people
> Adults in fair/poor health: 16.1%

14. Michigan City-La Porte, Indiana
> Poverty: 16.2%
> Avg. weekly hours worked: 39.5 (highest 25%)
> Unemployment: 4.6%
> Violent crime: 301 per 100,000 people
> Adults in fair/poor health: 18.1%
[in-text-ad-2]

15. Cedar Rapids, Iowa
> Poverty: 9.9% (lowest 25%)
> Avg. weekly hours worked: 39.3 (highest 25%)
> Unemployment: 3.3% (lowest 25%)
> Violent crime: 220 per 100,000 people (lowest 25%)
> Adults in fair/poor health: 11.6% (bottom 10%)
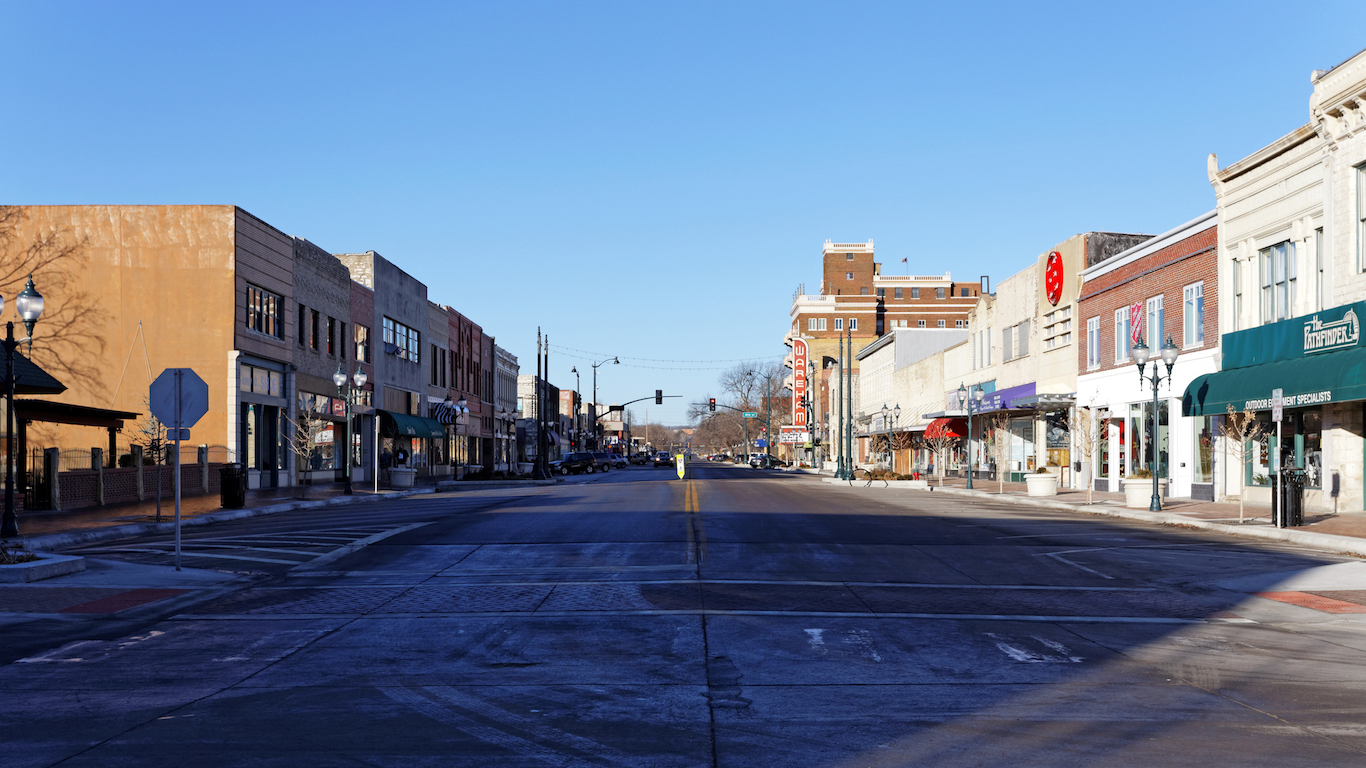
16. Manhattan, Kansas
> Poverty: 16.5%
> Avg. weekly hours worked: 38.3
> Unemployment: 2.9% (lowest 25%)
> Violent crime: 259 per 100,000 people
> Adults in fair/poor health: 13.6% (lowest 25%)
[in-text-ad]
17. Elizabethtown-Fort Knox, Kentucky
> Poverty: 14.5%
> Avg. weekly hours worked: 39.4 (highest 25%)
> Unemployment: 4.4%
> Violent crime: 122 per 100,000 people (bottom 10%)
> Adults in fair/poor health: 19.1% (highest 25%)
[recirclink id=428885]
18. Hammond, Louisiana
> Poverty: 20.4% (highest 10%)
> Avg. weekly hours worked: 39.3 (highest 25%)
> Unemployment: 4.9%
> Violent crime: 916 per 100,000 people (highest 10%)
> Adults in fair/poor health: 21.2% (highest 10%)

19. Portland-South Portland, Maine
> Poverty: 9.1% (bottom 10%)
> Avg. weekly hours worked: 38.5
> Unemployment: 2.4% (bottom 10%)
> Violent crime: 134 per 100,000 people (bottom 10%)
> Adults in fair/poor health: 10.7% (bottom 10%)
[in-text-ad-2]
20. Hagerstown-Martinsburg, Maryland
> Poverty: 14.0%
> Avg. weekly hours worked: 38.9
> Unemployment: 4.2%
> Violent crime: 248 per 100,000 people (lowest 25%)
> Adults in fair/poor health: 16.7%

21. Boston-Cambridge-Newton, Massachusetts
> Poverty: 9.6% (lowest 25%)
> Avg. weekly hours worked: 38.2
> Unemployment: 3.4%
> Violent crime: N/A
> Adults in fair/poor health: 12.4% (lowest 25%)
[in-text-ad]

22. Detroit-Warren-Dearborn, Michigan
> Poverty: 14.9%
> Avg. weekly hours worked: 38.7
> Unemployment: 4.3%
> Violent crime: 556 per 100,000 people (highest 25%)
> Adults in fair/poor health: 15.1%
[recirclink id=428851]

23. Rochester, Minnesota
> Poverty: 9.4% (bottom 10%)
> Avg. weekly hours worked: 40.0 (highest 10%)
> Unemployment: 2.7% (bottom 10%)
> Violent crime: 138 per 100,000 people (bottom 10%)
> Adults in fair/poor health: 10.4% (bottom 10%)

24. Hattiesburg, Mississippi
> Poverty: 19.8% (highest 25%)
> Avg. weekly hours worked: 40.4 (highest 10%)
> Unemployment: 4.1%
> Violent crime: 199 per 100,000 people (lowest 25%)
> Adults in fair/poor health: 20.3% (highest 25%)
[in-text-ad-2]

25. Kansas City, Missouri
> Poverty: 10.9% (lowest 25%)
> Avg. weekly hours worked: 39.4 (highest 25%)
> Unemployment: 3.7%
> Violent crime: N/A
> Adults in fair/poor health: 14.5%
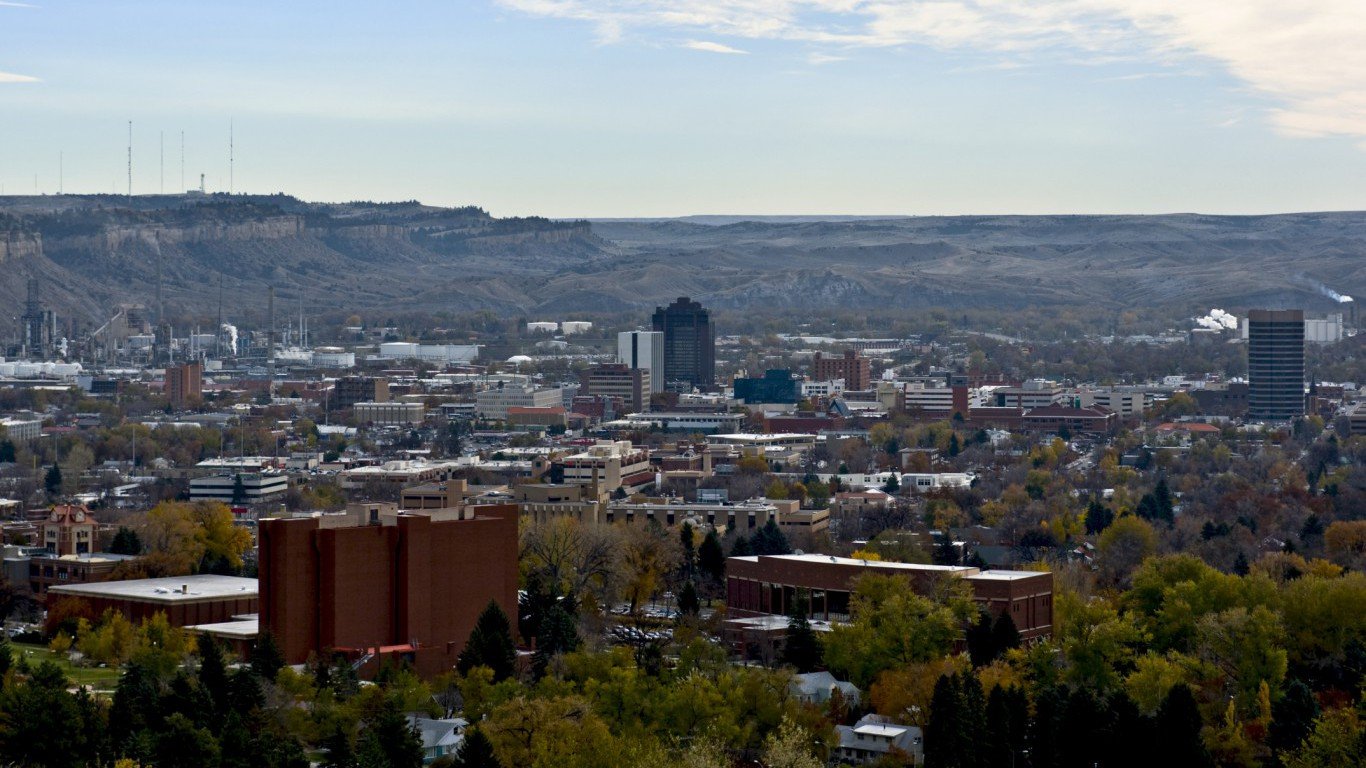
26. Billings, Montana
> Poverty: 7.3% (bottom 10%)
> Avg. weekly hours worked: 39.1
> Unemployment: 3.6%
> Violent crime: 377 per 100,000 people
> Adults in fair/poor health: 12.4% (lowest 25%)
[in-text-ad]

27. Grand Island, Nebraska
> Poverty: 11.0% (lowest 25%)
> Avg. weekly hours worked: 40.1 (highest 10%)
> Unemployment: 2.8% (bottom 10%)
> Violent crime: 286 per 100,000 people
> Adults in fair/poor health: 14.2%
[recirclink id=428631]
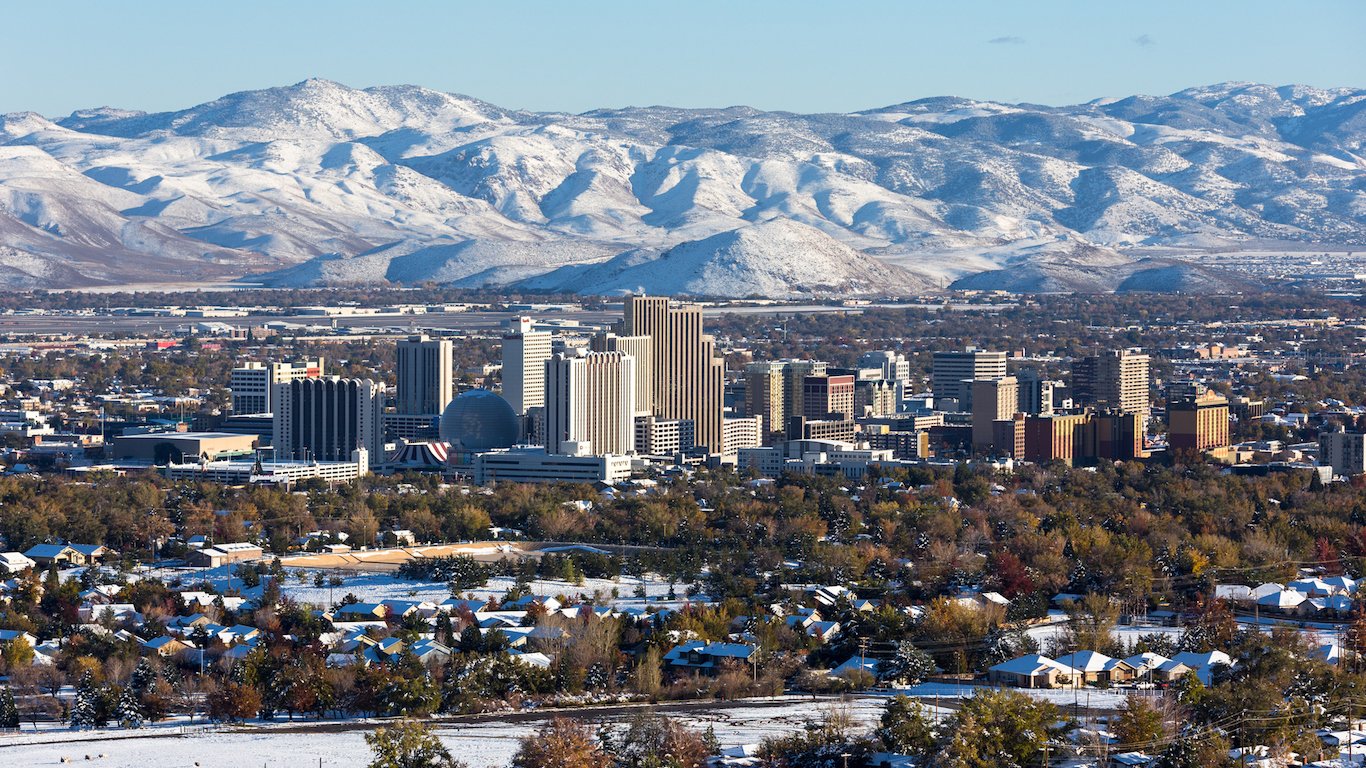
28. Reno, Nevada
> Poverty: 12.2%
> Avg. weekly hours worked: 38.6
> Unemployment: 4.2%
> Violent crime: 515 per 100,000 people (highest 25%)
> Adults in fair/poor health: 14.8%

29. Manchester-Nashua, New Hampshire
> Poverty: 8.2% (bottom 10%)
> Avg. weekly hours worked: 38.8
> Unemployment: 0.0% (highest 10%)
> Violent crime: 269 per 100,000 people
> Adults in fair/poor health: 11.0% (bottom 10%)
[in-text-ad-2]
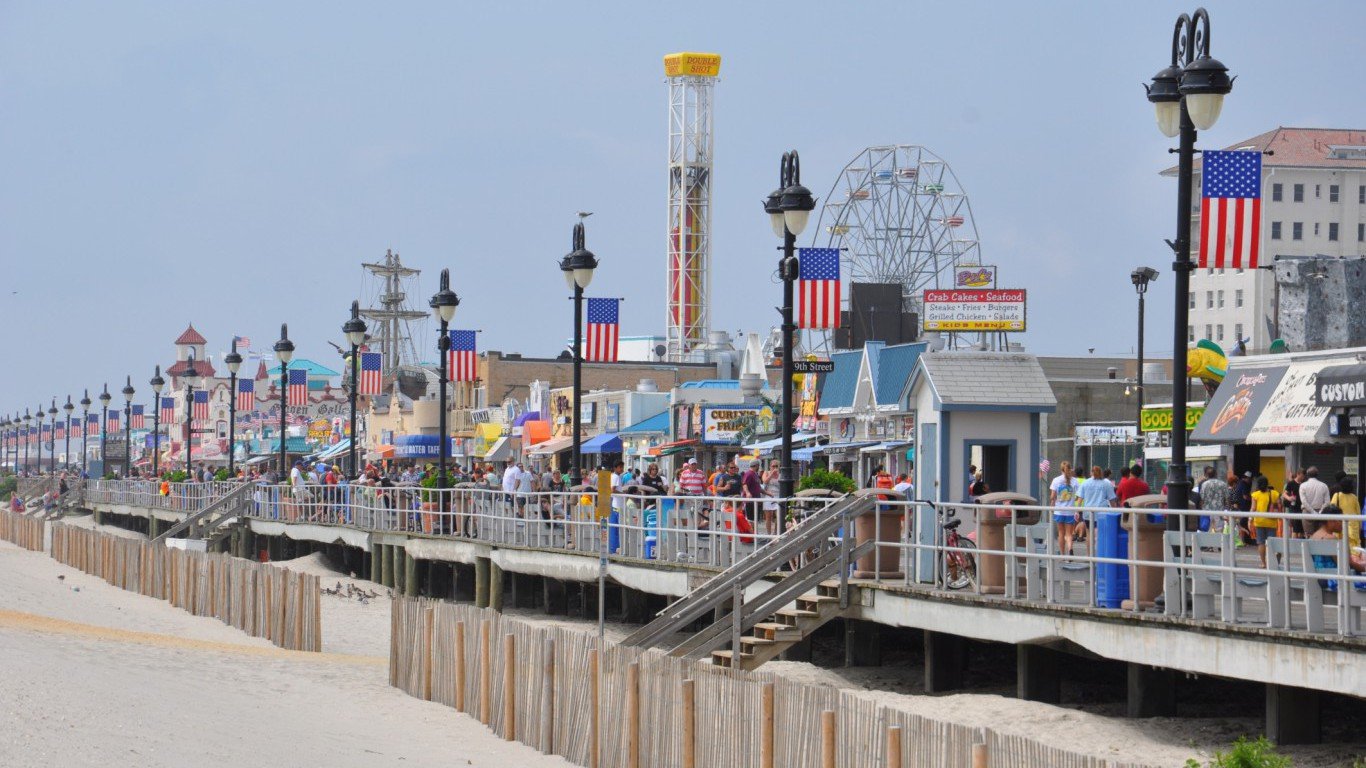
30. Ocean City, New Jersey
> Poverty: 11.9%
> Avg. weekly hours worked: 38.5
> Unemployment: 9.7% (highest 10%)
> Violent crime: 232 per 100,000 people (lowest 25%)
> Adults in fair/poor health: 12.8% (lowest 25%)
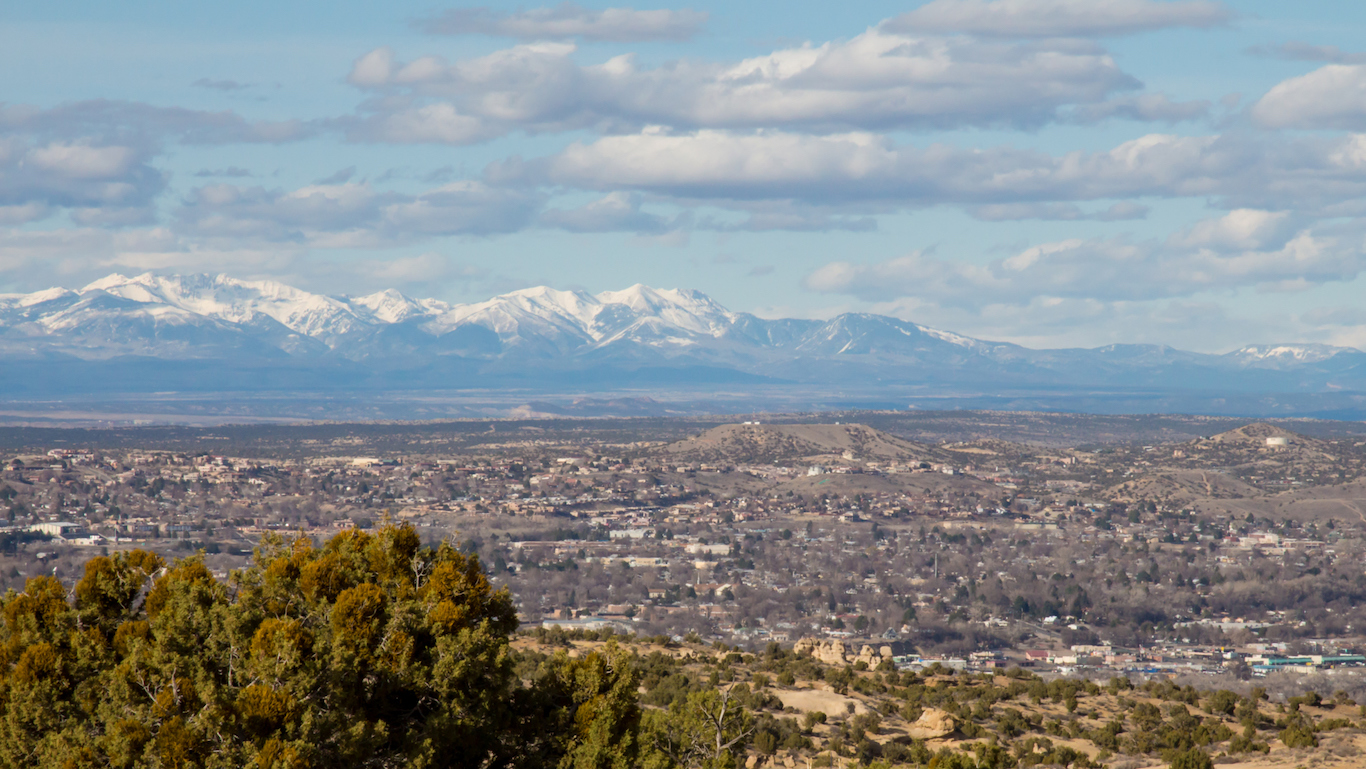
31. Farmington, New Mexico
> Poverty: 16.9%
> Avg. weekly hours worked: 39.8 (highest 25%)
> Unemployment: 6.9% (highest 10%)
> Violent crime: 947 per 100,000 people (highest 10%)
> Adults in fair/poor health: 19.9% (highest 25%)
[in-text-ad]

32. New York-Newark-Jersey City, New York
> Poverty: 13.5%
> Avg. weekly hours worked: 38.8
> Unemployment: 4.6%
> Violent crime: 355 per 100,000 people
> Adults in fair/poor health: 15.9%
[recirclink id=428770]
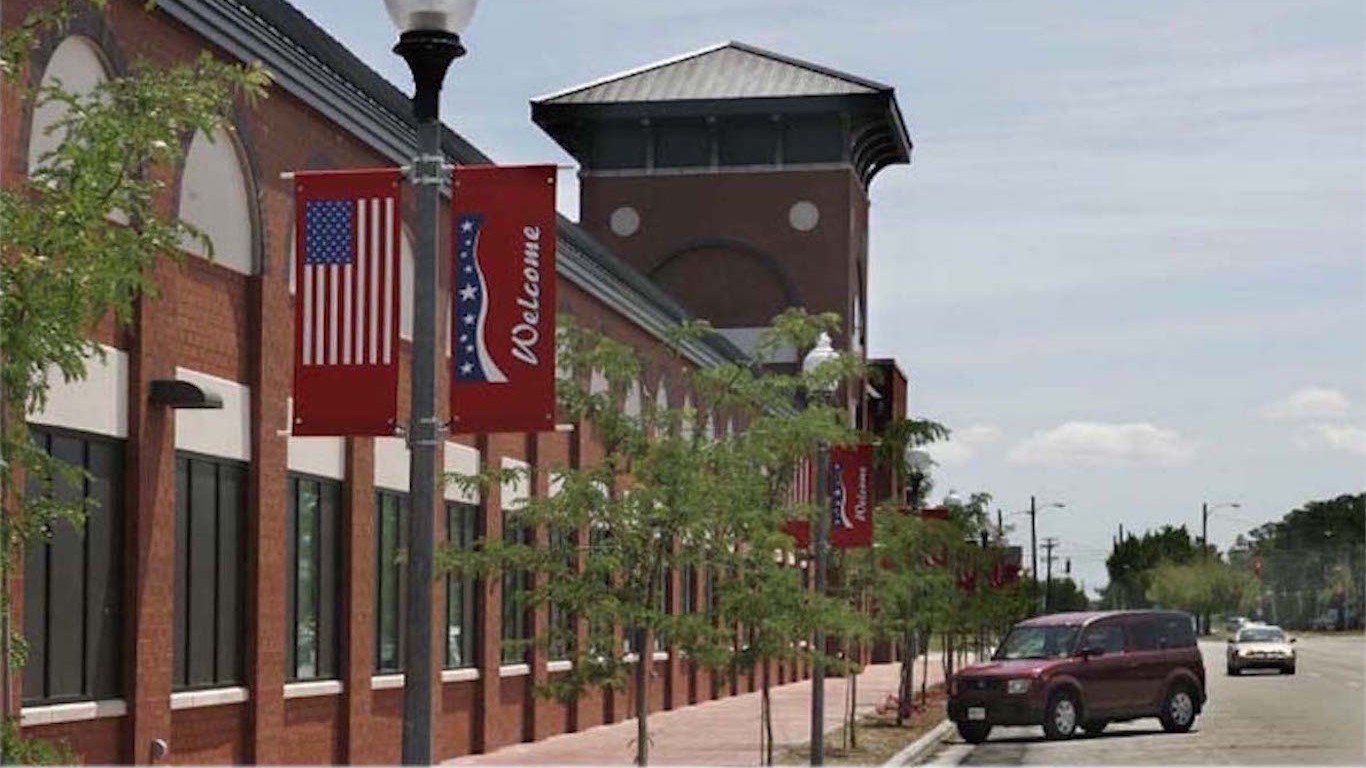
33. Jacksonville, North Carolina
> Poverty: 13.1%
> Avg. weekly hours worked: 43.0 (highest 10%)
> Unemployment: 4.9%
> Violent crime: N/A
> Adults in fair/poor health: 17.8%
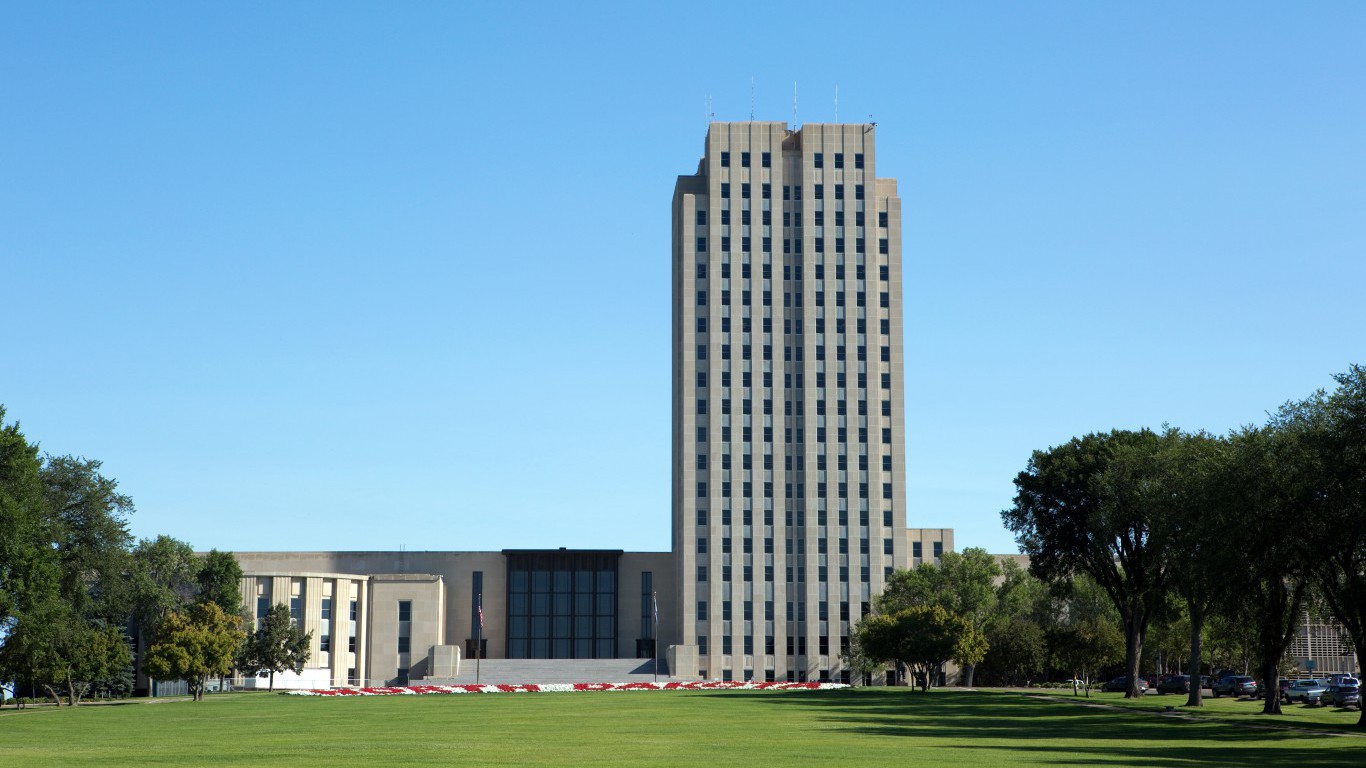
34. Bismarck, North Dakota
> Poverty: 9.2% (bottom 10%)
> Avg. weekly hours worked: 40.2 (highest 10%)
> Unemployment: 2.6% (bottom 10%)
> Violent crime: 294 per 100,000 people
> Adults in fair/poor health: 11.9% (bottom 10%)
[in-text-ad-2]

35. Cincinnati, Ohio
> Poverty: 12.6%
> Avg. weekly hours worked: 38.5
> Unemployment: 4.1%
> Violent crime: 257 per 100,000 people
> Adults in fair/poor health: 15.0%
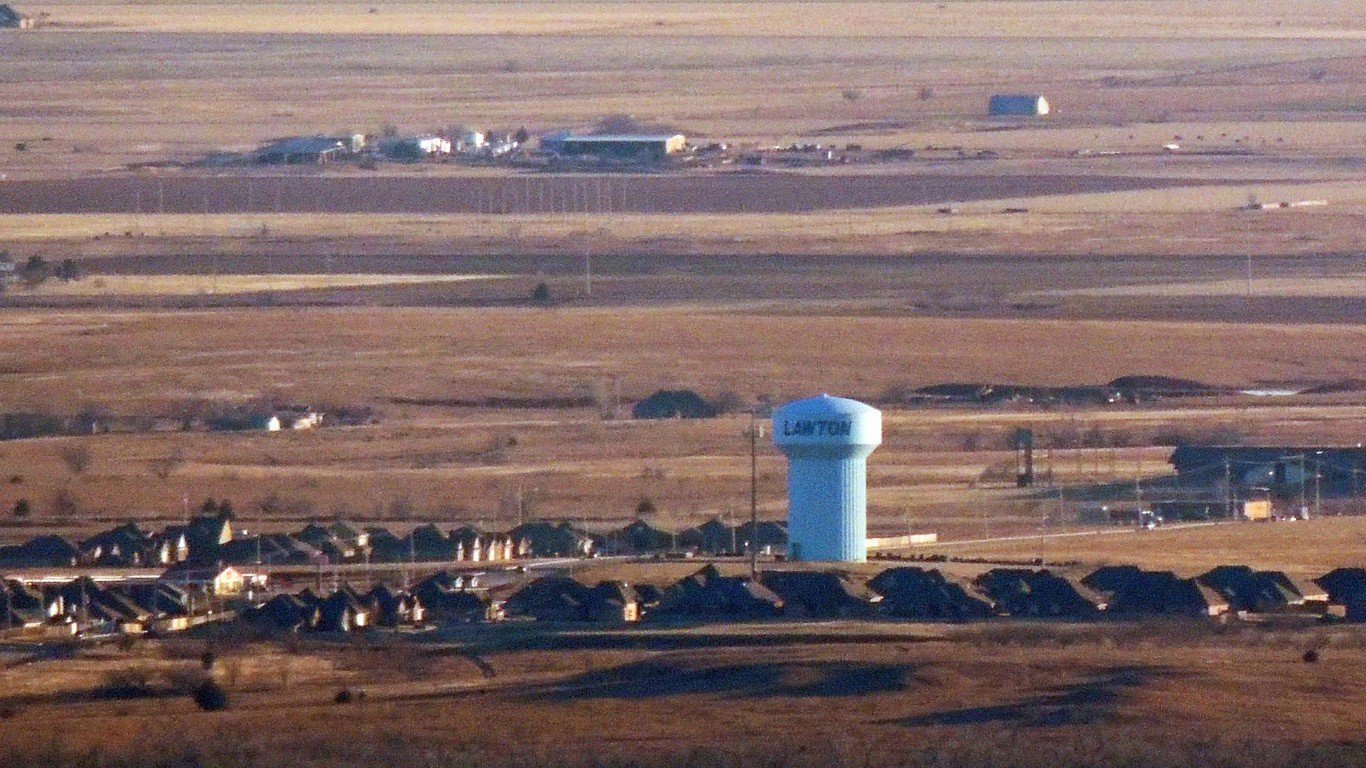
36. Lawton, Oklahoma
> Poverty: 14.8%
> Avg. weekly hours worked: 41.6 (highest 10%)
> Unemployment: 4.1%
> Violent crime: 628 per 100,000 people (highest 25%)
> Adults in fair/poor health: 20.1% (highest 25%)
[in-text-ad]

37. Albany, Oregon
> Poverty: 12.4%
> Avg. weekly hours worked: 38.6
> Unemployment: 4.4%
> Violent crime: 114 per 100,000 people (bottom 10%)
> Adults in fair/poor health: 17.1%
[recirclink id=428675]
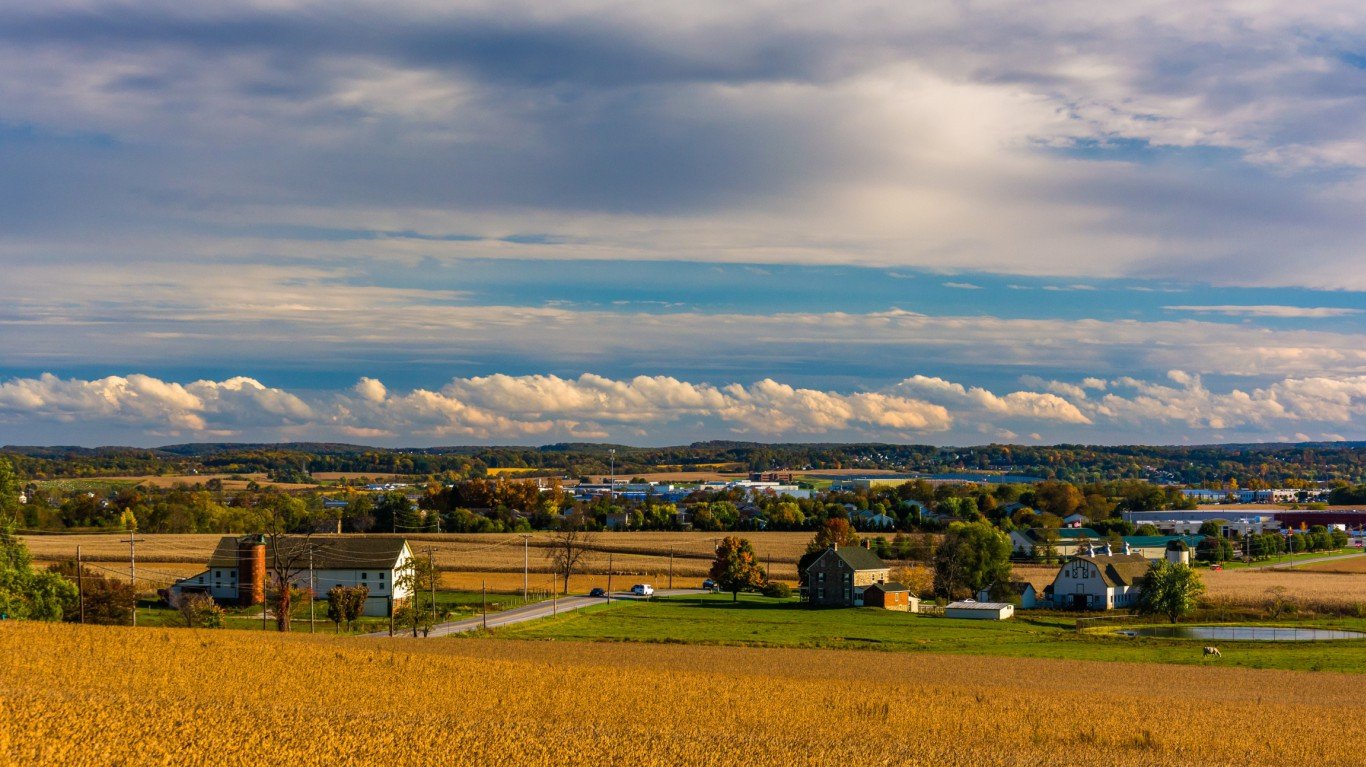
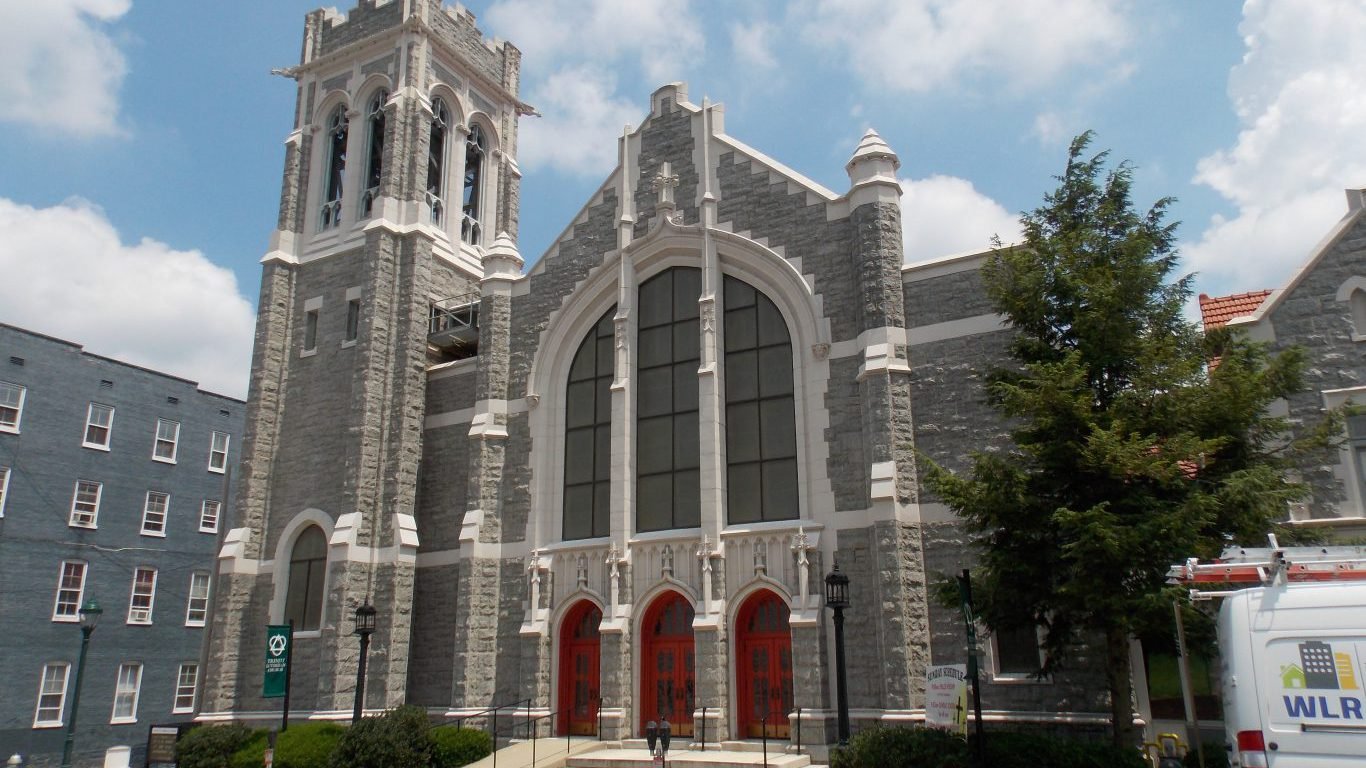
38. York-Hanover, Pennsylvania
> Poverty: 9.9% (lowest 25%)
> Avg. weekly hours worked: 39.2 (highest 25%)
> Unemployment: 4.2%
> Violent crime: 235 per 100,000 people (lowest 25%)
> Adults in fair/poor health: 12.6% (lowest 25%)

39. Providence-Warwick, Rhode Island
> Poverty: 12.0%
> Avg. weekly hours worked: 37.6 (lowest 25%)
> Unemployment: 4.6%
> Violent crime: 315 per 100,000 people
> Adults in fair/poor health: 15.2%
[in-text-ad-2]

40. Hilton Head Island-Bluffton-Beaufort, South Carolina
> Poverty: 10.3% (lowest 25%)
> Avg. weekly hours worked: 40.1 (highest 10%)
> Unemployment: 3.9%
> Violent crime: 315 per 100,000 people
> Adults in fair/poor health: 14.0%

41. Sioux Falls, South Dakota
> Poverty: 8.9% (bottom 10%)
> Avg. weekly hours worked: 40.0 (highest 10%)
> Unemployment: 3.0% (lowest 25%)
> Violent crime: 388 per 100,000 people
> Adults in fair/poor health: 10.5% (bottom 10%)
[in-text-ad]

42. Clarksville, Tennessee
> Poverty: 15.5%
> Avg. weekly hours worked: 42.1 (highest 10%)
> Unemployment: 4.3%
> Violent crime: 428 per 100,000 people
> Adults in fair/poor health: 22.1% (highest 10%)
[recirclink id=428583]
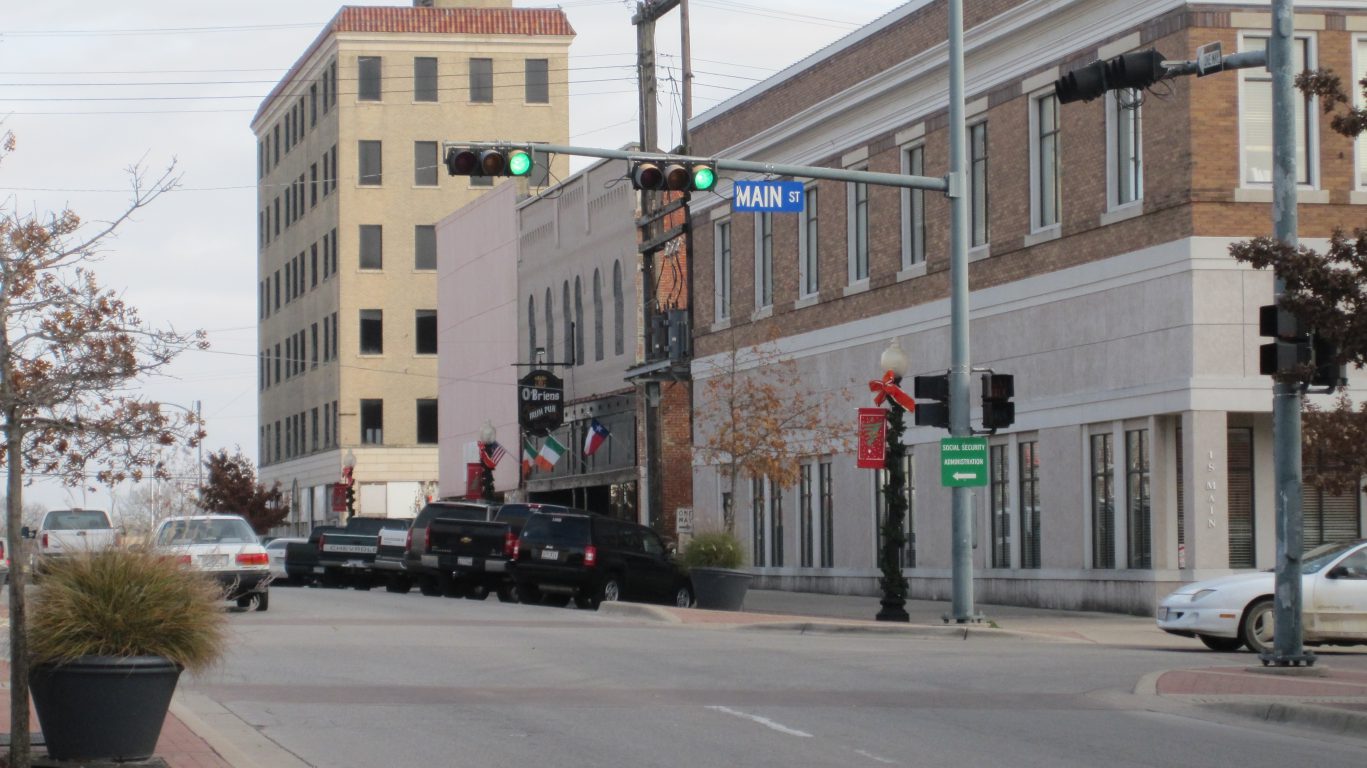
43. Killeen-Temple, Texas
> Poverty: 12.7%
> Avg. weekly hours worked: 41.3 (highest 10%)
> Unemployment: 3.7%
> Violent crime: 387 per 100,000 people
> Adults in fair/poor health: 16.4%

44. Ogden-Clearfield, Utah
> Poverty: 8.0% (bottom 10%)
> Avg. weekly hours worked: 37.8
> Unemployment: 3.3% (lowest 25%)
> Violent crime: 156 per 100,000 people (bottom 10%)
> Adults in fair/poor health: 11.9% (bottom 10%)
[in-text-ad-2]

45. Burlington-South Burlington, Vermont
> Poverty: 10.3% (lowest 25%)
> Avg. weekly hours worked: 38.4
> Unemployment: 2.3% (bottom 10%)
> Violent crime: N/A
> Adults in fair/poor health: 9.1% (bottom 10%)

46. Virginia Beach-Norfolk-Newport News, Virginia
> Poverty: 11.4% (lowest 25%)
> Avg. weekly hours worked: 39.5 (highest 25%)
> Unemployment: 4.3%
> Violent crime: 352 per 100,000 people
> Adults in fair/poor health: 14.8%
[in-text-ad]

47. Bremerton-Silverdale, Washington
> Poverty: 10.0% (lowest 25%)
> Avg. weekly hours worked: 40.5 (highest 10%)
> Unemployment: 4.6%
> Violent crime: 259 per 100,000 people
> Adults in fair/poor health: 11.9% (bottom 10%)
[recirclink id=428400]
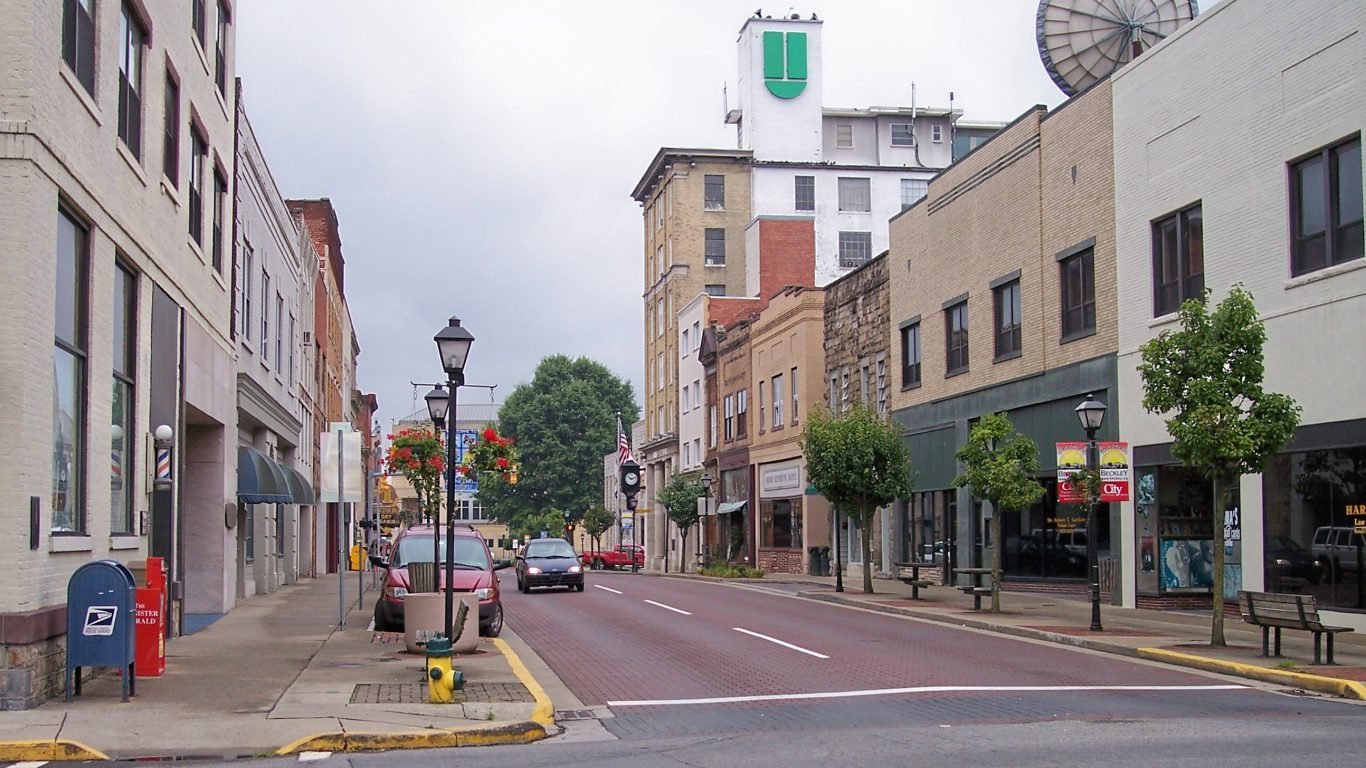
48. Beckley, West Virginia
> Poverty: 15.9%
> Avg. weekly hours worked: 39.5 (highest 25%)
> Unemployment: 6.2% (highest 10%)
> Violent crime: 417 per 100,000 people
> Adults in fair/poor health: 24.2% (highest 10%)

49. Janesville-Beloit, Wisconsin
> Poverty: 13.3%
> Avg. weekly hours worked: 38.6
> Unemployment: 3.3% (lowest 25%)
> Violent crime: 229 per 100,000 people (lowest 25%)
> Adults in fair/poor health: 14.8%
[in-text-ad-2]
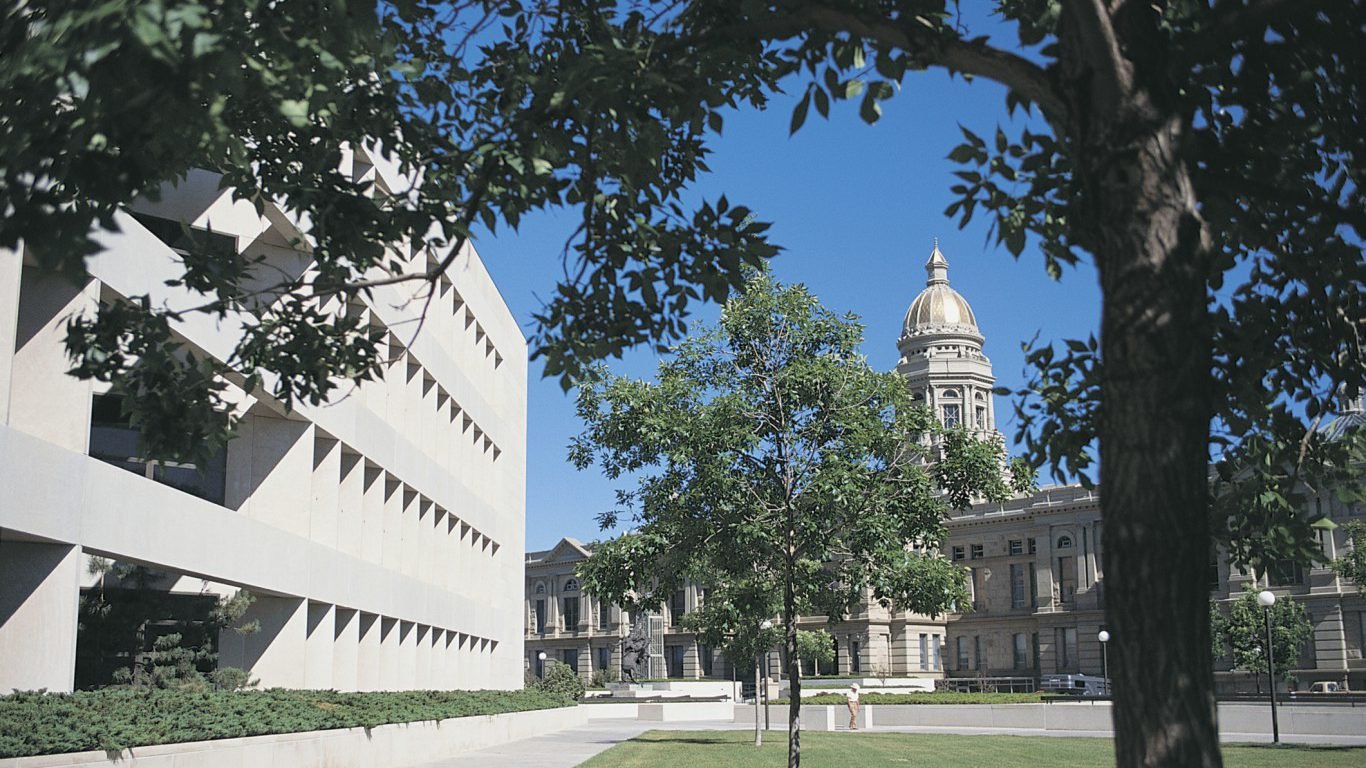
50. Cheyenne, Wyoming
> Poverty: 9.7% (lowest 25%)
> Avg. weekly hours worked: 40.6 (highest 10%)
> Unemployment: 3.8%
> Violent crime: 252 per 100,000 people
> Adults in fair/poor health: 13.7% (lowest 25%)
In an email to 24/7 Wall St., Vaile Wright, a director of research and special projects with the American Psychological Association (APA), noted one of these causes in particular. “[F]eelings about the future of our nation did differ in the different regions: Adults in the West (70 percent) were more likely than those in the South (63 percent), East (60 percent) and Midwest (56 percent) to consider the future of our nation as a somewhat or very significant source of stress.”
There are healthy and unhealthy ways to manage stress. The APA has found that poor individuals are more likely to engage in unhealthy behaviors to manage their stress, including smoking and drinking alcohol, and turning to violent behavior.
Nearly three-quarters of Americans surveyed reported feeling stressed about money at least sometimes, and nearly one-quarter reported money concerns as causing stress on a regular basis.
Metropolitan areas are often some of the most expensive places to live in a state, and areas where the population reports higher stress levels tend to be less affordable. Because of this, our stress factor index included the affordability ratio, which calculates how much homeowners spend on their homes as a share of their total income. We also included poverty levels as part of the stress factor index.
Americans tend to work longer hours than residents of other countries, and the United States is the only developed country where paid time off is not guaranteed. The typical American works about 35 hours a week. In the most stressed-out cities in 34 states, the average weekly hours spent at work exceed 35 hours. The likelihood of being stressed increases with work issues. This is why we also considered hours worked per week and unemployment levels.
High stress levels have tangible health consequences. “Stress is your body’s way of responding to adverse or just demanding circumstances. It usually involves a combination of both physical and emotional symptoms, such as headaches, stomach aches, discomfort, and feeling worried. But if left untreated or unmanaged, chronic stress can result in serious health conditions including anxiety, insomnia, muscle pain, cardiovascular disease, high blood pressure and a weakened immune system,” said Wright.
As one example, unhealthy reactions to stress such as overeating can result in higher obesity rates and, in turn, worse health outcomes. In 29 of the 50 stressed-out cities on this list, obesity rates are higher than the respective state figures.
To identify the most stressed city in every state, 24/7 Wall St. created an index of data measuring two of the most common sources of stress — money and work — in each state’s metropolitan areas. To capture money-related stress inputs we reviewed poverty rates, housing affordability, and food insecurity. For work-related stress inputs, we included average weekly work hours, average daily commute times in hours, and annual unemployment rates. With the exception of food insecurity and unemployment rates, which came from the United States Department of Agriculture (USDA) and the Bureau of Labor Statistics (BLS), respectively, all data used in the index came from the U.S. Census Bureau’s 2016 American Community Survey (ACS). The incidence of violent crime in each area is from the Federal Bureau of Investigation’s 2016 Uniform Crime Report. All data are for the most recent periods available. While the potential consequences of stress were not considered in our index, they were reviewed in each state’s MSAs. For states like Vermont and Hawaii, the most stressed city is the only metropolitan area in the state by default.
Contact [email protected] for any questions or corrections.