
[cnxvideo id=”625487″ placement=”ros”]The United States has added about 17 million people since the last major census in 2010, a 5.3% population growth. The increase has been steady over that time, at 0.7% to 0.8% a year. This growth, however, does little to reflect the constantly shifting landscape of this country, where over 1 in 10 people move each year.
Examining population change at a more local level, the county level, reveals that nationwide there are places that have lost more than 10% of the population since 2010, while there are places that added more than 20% to their populations.
While population growth rates vary, nearly every state in the country has at least one county or county equivalent where the population grew at a faster rate than the nation as a whole since 2010. Reviewing population change figures from the Census Bureau from July 2010 through July 2017, 24/7 Wall St. identified the fastest growing county in each state. In states that do not have counties, we reviewed what the Census Bureau treats as the equivalent to a county.
For the United States as a whole, natural growth — births minus deaths — accounts for the largest source of population growth. Following natural growth, immigration from other countries accounts for the rest of the population growth. In most of the fastest growing counties in each state, however, the lion’s share of population growth is due mostly to domestic migration.
The reasons Americans move to a certain place differ from county to county. Some counties have booming economies, evidenced by job growth and low unemployment. Others benefit from ongoing migration patterns from the Snow Belt and Midwest to the Sun Belt. Still others represent affordable housing opportunities as home prices continue to rise in the post-recession housing market recovery.
To identify the fastest growing county in every state, 24/7 Wall St. reviewed the seven-year population estimate change from the U.S Census Bureau’s Annual Estimates of the Resident Population from July 2010-July 2017. Only counties with a base population (from April 2010) greater than 10,000 were considered. If a county had a seven year population growth but either a two or three year population decline, it was excluded. Annual unemployment figures at both the state and county level are from the U.S. Bureau of Labor Statistics, and are 2017 annual figures.
Click here to see the fastest growing county in every state.
Click here to see the fastest shrinking county in every state.

1. Alabama: Baldwin County
> 2010-2017 population change: +16.1% (183,110 to 212,628)
> 2010-2017 population change, Alabama: +1.9% (4,785,579 to 4,874,747)
> 2010-2017 pop. change due to migration: +28,263
> 2017 unemployment: 4.0% (Alabama: 4.4%)
[in-text-ad]

2. Alaska: Matanuska-Susitna Borough
> 2010-2017 population change: +18.7% (89,738 to 106,532)
> 2010-2017 population change, Alaska: +3.6% (714,015 to 739,795)
> 2010-2017 pop. change due to migration: +11,098
> 2017 unemployment: 8.7% (Alaska: 7.2%)
[recirclink id=444492]

3. Arizona: Pinal County
> 2010-2017 population change: +13.4% (379,504 to 430,237)
> 2010-2017 population change, Arizona: +9.5% (6,407,002 to 7,016,270)
> 2010-2017 pop. change due to migration: +40,019
> 2017 unemployment: 5.0% (Arizona: 4.9%)

4. Arkansas: Benton County
> 2010-2017 population change: +19.7% (222,558 to 266,300)
> 2010-2017 population change, Arkansas: +2.8% (2,921,737 to 3,004,279)
> 2010-2017 pop. change due to migration: +31,685
> 2017 unemployment: 2.9% (Arkansas: 3.7%)
[in-text-ad-2]

5. California: Placer County
> 2010-2017 population change: +10.3% (350,034 to 386,166)
> 2010-2017 population change, California: +5.9% (37,327,690 to 39,536,653)
> 2010-2017 pop. change due to migration: +32,136
> 2017 unemployment: 3.8% (California: 4.8%)

6. Colorado: Broomfield County
> 2010-2017 population change: +21.6% (56,214 to 68,341)
> 2010-2017 population change, Colorado: +11.1% (5,048,029 to 5,607,154)
> 2010-2017 pop. change due to migration: +9,777
> 2017 unemployment: 2.6% (Colorado: 2.8%)
[in-text-ad]

7. Connecticut: Fairfield County
> 2010-2017 population change: +3.3% (919,749 to 949,921)
> 2010-2017 population change, Connecticut: +0.2% (3,580,171 to 3,588,184)
> 2010-2017 pop. change due to migration: +7,582
> 2017 unemployment: 4.5% (Connecticut: 4.7%)
[recirclink id=444468]

8. Delaware: Sussex County
> 2010-2017 population change: +13.9% (197,908 to 225,322)
> 2010-2017 population change, Delaware: +6.9% (899,712 to 961,939)
> 2010-2017 pop. change due to migration: +28,209
> 2017 unemployment: 4.6% (Delaware: 4.6%)

9. Florida: Sumter County
> 2010-2017 population change: +32.8% (94,279 to 125,165)
> 2010-2017 population change, Florida: +11.3% (18,846,461 to 20,984,400)
> 2010-2017 pop. change due to migration: +38,549
> 2017 unemployment: 6.0% (Florida: 4.2%)
[in-text-ad-2]

10. Georgia: Long County
> 2010-2017 population change: +29.6% (14,674 to 19,014)
> 2010-2017 population change, Georgia: +7.4% (9,712,696 to 10,429,379)
> 2010-2017 pop. change due to migration: +3,364
> 2017 unemployment: 5.0% (Georgia: 4.7%)

11. Hawaii: Hawaii County
> 2010-2017 population change: +8.1% (185,347 to 200,381)
> 2010-2017 population change, Hawaii: +4.7% (1,363,817 to 1,427,538)
> 2010-2017 pop. change due to migration: +9,774
> 2017 unemployment: 2.8% (Hawaii: 2.4%)
[in-text-ad]

12. Idaho: Ada County
> 2010-2017 population change: +16.1% (393,446 to 456,849)
> 2010-2017 population change, Idaho: +9.3% (1,570,912 to 1,716,943)
> 2010-2017 pop. change due to migration: +46,588
> 2017 unemployment: 2.8% (Idaho: 3.2%)
[recirclink id=444391]

13. Illinois: Kendall County
> 2010-2017 population change: +9.4% (115,378 to 126,218)
> 2010-2017 population change, Illinois: -0.3% (12,841,196 to 12,802,023)
> 2010-2017 pop. change due to migration: +3,263
> 2017 unemployment: 4.5% (Illinois: 5.0%)

14. Indiana: Hamilton County
> 2010-2017 population change: +17.1% (276,476 to 323,747)
> 2010-2017 population change, Indiana: +2.7% (6,490,029 to 6,666,818)
> 2010-2017 pop. change due to migration: +31,759
> 2017 unemployment: 2.7% (Indiana: 3.5%)
[in-text-ad-2]

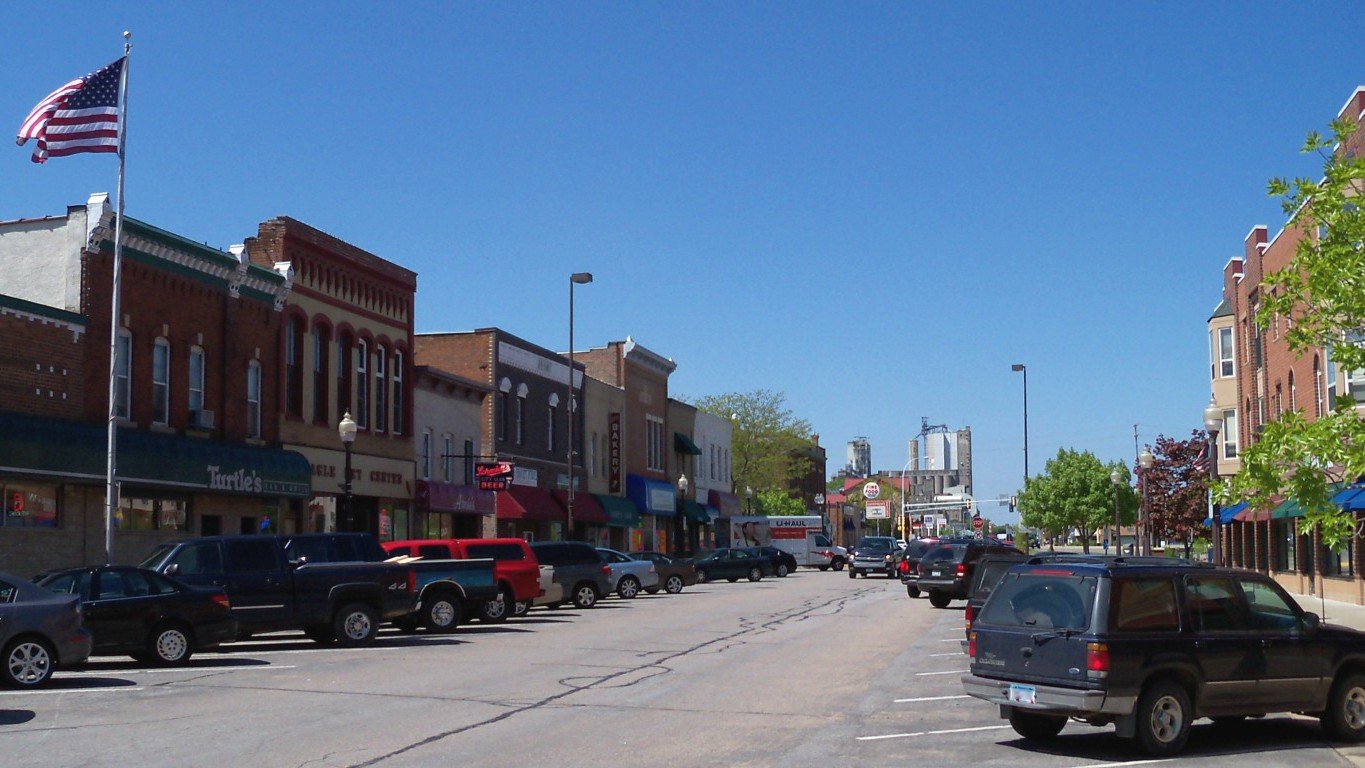
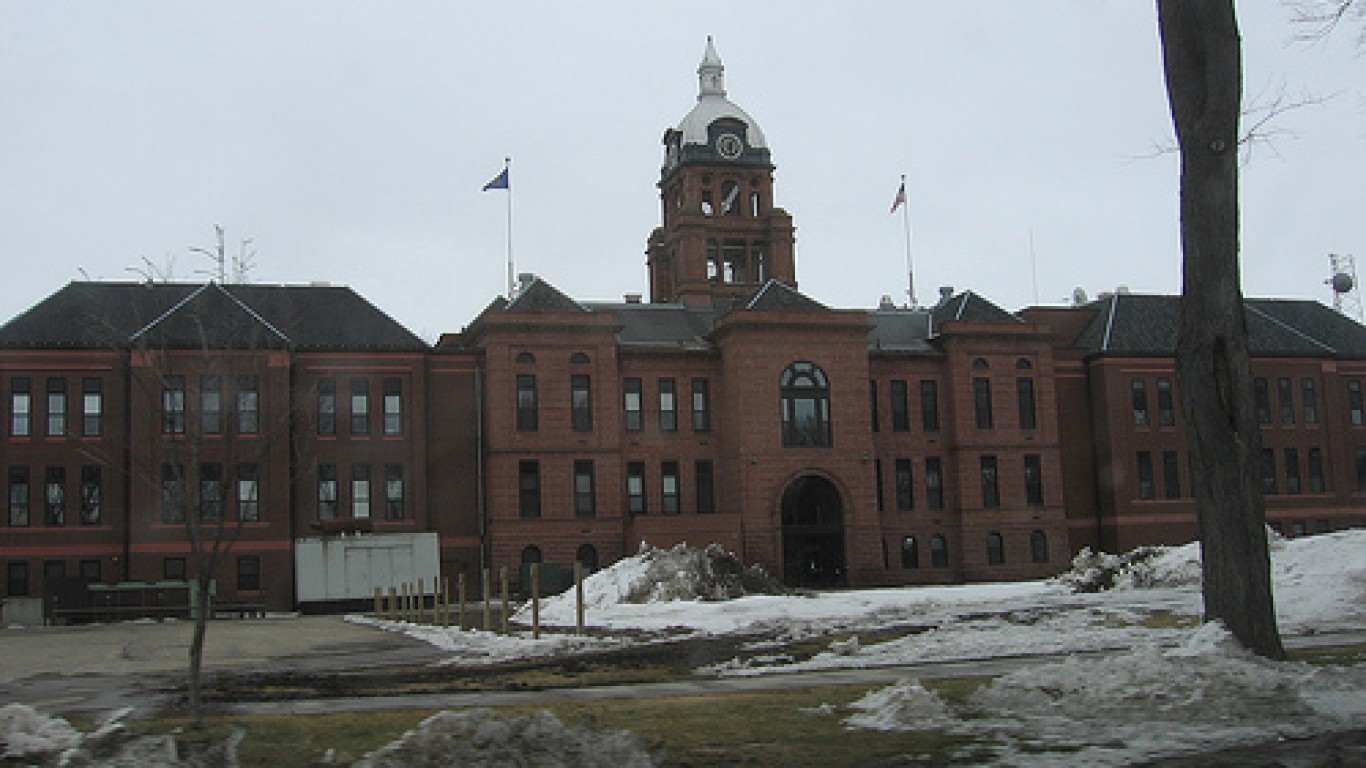
15. Iowa: Dallas County
> 2010-2017 population change: +30.7% (66,737 to 87,235)
> 2010-2017 population change, Iowa: +3.1% (3,050,223 to 3,145,711)
> 2010-2017 pop. change due to migration: +15,129
> 2017 unemployment: 2.1% (Iowa: 3.1%)

16. Kansas: Pottawatomie County
> 2010-2017 population change: +10.0% (21,729 to 23,908)
> 2010-2017 population change, Kansas: +1.9% (2,858,403 to 2,913,123)
> 2010-2017 pop. change due to migration: +940
> 2017 unemployment: 3.1% (Kansas: 3.6%)
[in-text-ad]

17. Kentucky: Scott County
> 2010-2017 population change: +15.9% (47,354 to 54,873)
> 2010-2017 population change, Kentucky: +2.4% (4,347,948 to 4,454,189)
> 2010-2017 pop. change due to migration: +5,200
> 2017 unemployment: 3.7% (Kentucky: 4.9%)
[recirclink id=444326]

18. Louisiana: St. Bernard Parish
> 2010-2017 population change: +25.5% (36,823 to 46,202)
> 2010-2017 population change, Louisiana: +3.1% (4,544,871 to 4,684,333)
> 2010-2017 pop. change due to migration: +7,807
> 2017 unemployment: 5.2% (Louisiana: 5.1%)

19. Maine: Cumberland County
> 2010-2017 population change: +3.9% (281,435 to 292,500)
> 2010-2017 population change, Maine: +0.6% (1,327,568 to 1,335,907)
> 2010-2017 pop. change due to migration: +9,322
> 2017 unemployment: 2.5% (Maine: 3.3%)
[in-text-ad-2]

20. Maryland: Howard County
> 2010-2017 population change: +11.3% (288,605 to 321,113)
> 2010-2017 population change, Maryland: +4.6% (5,788,099 to 6,052,177)
> 2010-2017 pop. change due to migration: +20,323
> 2017 unemployment: 3.1% (Maryland: 4.1%)

21. Massachusetts: Nantucket County
> 2010-2017 population change: +10.5% (10,164 to 11,229)
> 2010-2017 population change, Massachusetts: +4.5% (6,564,943 to 6,859,819)
> 2010-2017 pop. change due to migration: +425
> 2017 unemployment: 4.4% (Massachusetts: 3.7%)
[in-text-ad]

22. Michigan: Ottawa County
> 2010-2017 population change: +8.4% (264,096 to 286,383)
> 2010-2017 population change, Michigan: +0.9% (9,876,731 to 9,962,311)
> 2010-2017 pop. change due to migration: +11,307
> 2017 unemployment: 3.3% (Michigan: 4.6%)
[recirclink id=444046]
23. Minnesota: Scott County
> 2010-2017 population change: +11.7% (130,502 to 145,827)
> 2010-2017 population change, Minnesota: +5.0% (5,310,711 to 5,576,606)
> 2010-2017 pop. change due to migration: +6,636
> 2017 unemployment: 2.9% (Minnesota: 3.5%)

24. Mississippi: Lafayette County
> 2010-2017 population change: +14.3% (47,566 to 54,374)
> 2010-2017 population change, Mississippi: +0.5% (2,970,437 to 2,984,100)
> 2010-2017 pop. change due to migration: +5,560
> 2017 unemployment: 4.2% (Mississippi: 5.1%)
[in-text-ad-2]

25. Missouri: Platte County
> 2010-2017 population change: +12.8% (89,685 to 101,187)
> 2010-2017 population change, Missouri: +2.0% (5,995,681 to 6,113,532)
> 2010-2017 pop. change due to migration: +7,949
> 2017 unemployment: 3.2% (Missouri: 3.8%)
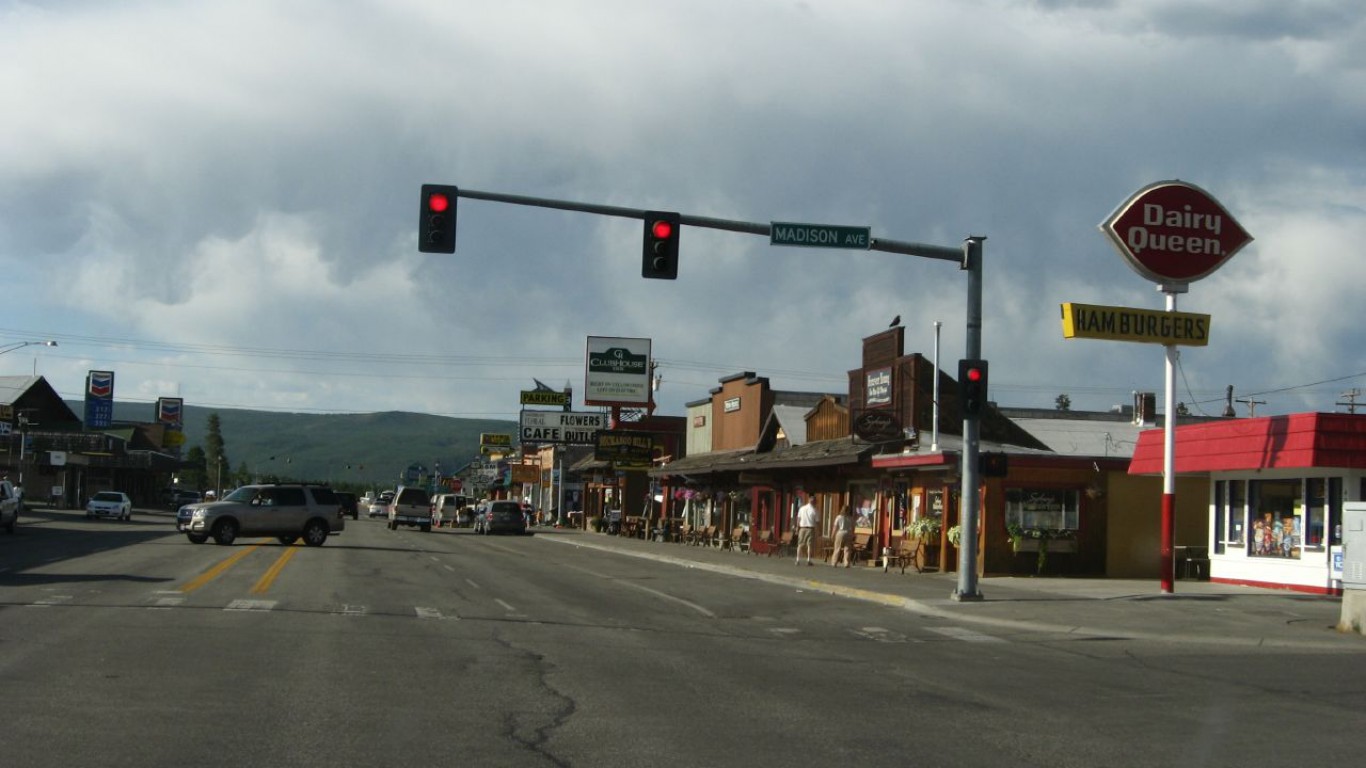
26. Montana: Gallatin County
> 2010-2017 population change: +20.3% (89,603 to 107,810)
> 2010-2017 population change, Montana: +6.1% (990,507 to 1,050,493)
> 2010-2017 pop. change due to migration: +13,540
> 2017 unemployment: 2.8% (Montana: 4.0%)
[in-text-ad]

27. Nebraska: Sarpy County
> 2010-2017 population change: +13.6% (159,737 to 181,439)
> 2010-2017 population change, Nebraska: +4.9% (1,829,956 to 1,920,076)
> 2010-2017 pop. change due to migration: +10,440
> 2017 unemployment: 2.8% (Nebraska: 2.9%)
[recirclink id=443940]

28. Nevada: Clark County
> 2010-2017 population change: +12.9% (1,952,906 to 2,204,079)
> 2010-2017 population change, Nevada: +10.9% (2,702,797 to 2,998,039)
> 2010-2017 pop. change due to migration: +166,153
> 2017 unemployment: 5.2% (Nevada: 5.0%)

29. New Hampshire: Strafford County
> 2010-2017 population change: +4.4% (123,180 to 128,613)
> 2010-2017 population change, New Hampshire: +2.0% (1,316,700 to 1,342,795)
> 2010-2017 pop. change due to migration: +3,704
> 2017 unemployment: 2.4% (New Hampshire: 2.7%)
[in-text-ad-2]

30. New Jersey: Hudson County
> 2010-2017 population change: +8.7% (636,345 to 691,643)
> 2010-2017 population change, New Jersey: +2.3% (8,803,708 to 9,005,644)
> 2010-2017 pop. change due to migration: +10,513
> 2017 unemployment: 4.4% (New Jersey: 4.6%)

31. New Mexico: Sandoval County
> 2010-2017 population change: +7.6% (132,385 to 142,507)
> 2010-2017 population change, New Mexico: +1.1% (2,064,607 to 2,088,070)
> 2010-2017 pop. change due to migration: +7,387
> 2017 unemployment: 6.2% (New Mexico: 6.2%)
[in-text-ad]

32. New York: Bronx County
> 2010-2017 population change: +6.0% (1,388,122 to 1,471,160)
> 2010-2017 population change, New York: +2.3% (19,405,185 to 19,849,399)
> 2010-2017 pop. change due to migration: -1,853
> 2017 unemployment: 6.2% (New York: 4.7%)
[recirclink id=443564]

33. North Carolina: Brunswick County
> 2010-2017 population change: +21.1% (108,068 to 130,897)
> 2010-2017 population change, North Carolina: +7.3% (9,574,247 to 10,273,419)
> 2010-2017 pop. change due to migration: +24,619
> 2017 unemployment: 5.7% (North Carolina: 4.6%)
34. North Dakota: Cass County
> 2010-2017 population change: +18.4% (150,208 to 177,787)
> 2010-2017 population change, North Dakota: +12.0% (674,518 to 755,393)
> 2010-2017 pop. change due to migration: +17,126
> 2017 unemployment: 2.1% (North Dakota: 2.6%)
[in-text-ad-2]

35. Ohio: Delaware County
> 2010-2017 population change: +14.5% (175,116 to 200,464)
> 2010-2017 population change, Ohio: +1.0% (11,539,282 to 11,658,609)
> 2010-2017 pop. change due to migration: +17,849
> 2017 unemployment: 3.5% (Ohio: 5.0%)
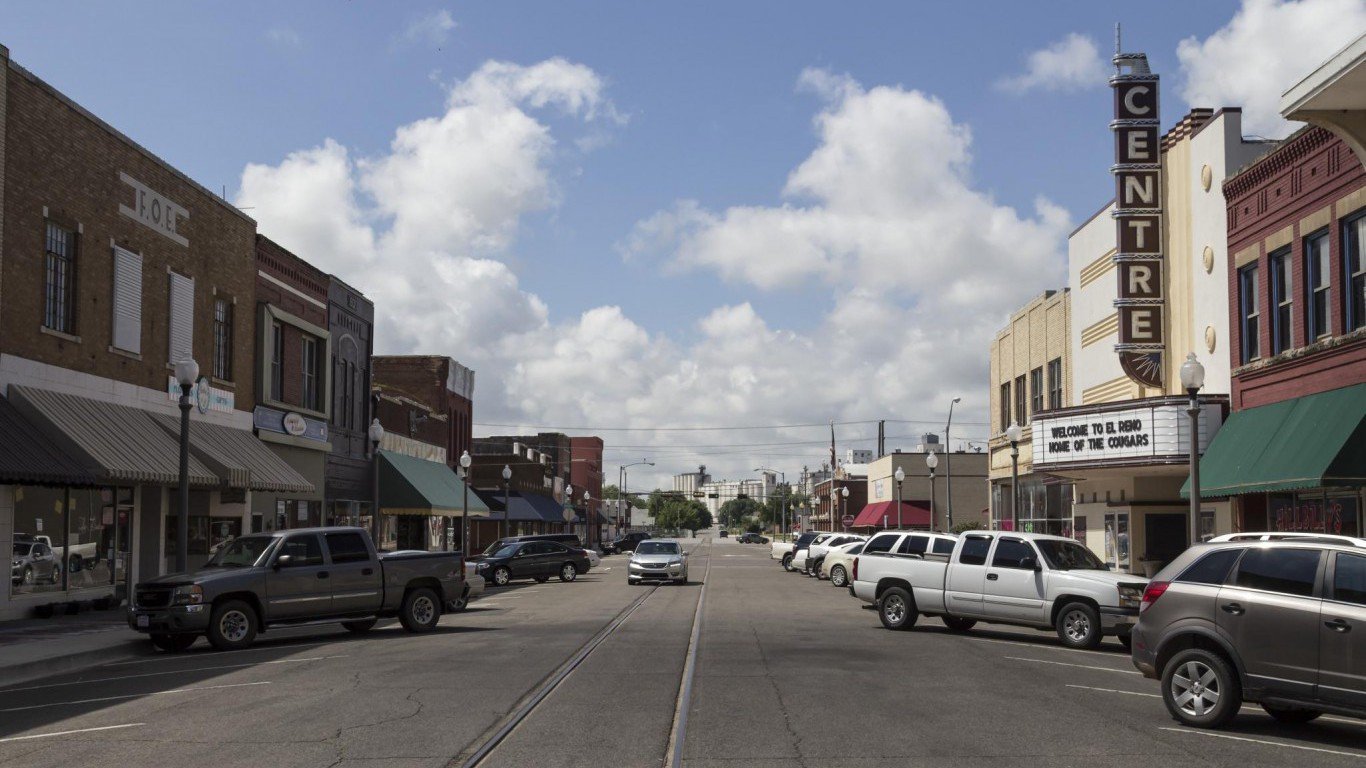
36. Oklahoma: Canadian County
> 2010-2017 population change: +20.3% (116,338 to 139,926)
> 2010-2017 population change, Oklahoma: +4.6% (3,759,529 to 3,930,864)
> 2010-2017 pop. change due to migration: +18,423
> 2017 unemployment: 3.6% (Oklahoma: 4.3%)
[in-text-ad]

37. Oregon: Deschutes County
> 2010-2017 population change: +18.5% (157,740 to 186,875)
> 2010-2017 population change, Oregon: +8.0% (3,837,073 to 4,142,776)
> 2010-2017 pop. change due to migration: +26,052
> 2017 unemployment: 4.2% (Oregon: 4.1%)
[recirclink id=443882]

38. Pennsylvania: Cumberland County
> 2010-2017 population change: +6.0% (235,897 to 250,066)
> 2010-2017 population change, Pennsylvania: +0.7% (12,711,063 to 12,805,537)
> 2010-2017 pop. change due to migration: +12,234
> 2017 unemployment: 3.8% (Pennsylvania: 4.9%)

39. Rhode Island: Providence County
> 2010-2017 population change: +1.6% (627,131 to 637,357)
> 2010-2017 population change, Rhode Island: +0.6% (1,053,169 to 1,059,639)
> 2010-2017 pop. change due to migration: -1,813
> 2017 unemployment: 4.8% (Rhode Island: 4.5%)
[in-text-ad-2]

40. South Carolina: Horry County
> 2010-2017 population change: +23.2% (270,438 to 333,268)
> 2010-2017 population change, South Carolina: +8.4% (4,635,834 to 5,024,369)
> 2010-2017 pop. change due to migration: +62,575
> 2017 unemployment: 5.0% (South Carolina: 4.3%)
41. South Dakota: Lincoln County
> 2010-2017 population change: +25.4% (45,186 to 56,664)
> 2010-2017 population change, South Dakota: +6.5% (816,227 to 869,666)
> 2010-2017 pop. change due to migration: +7,565
> 2017 unemployment: 2.5% (South Dakota: 3.3%)
[in-text-ad]

42. Tennessee: Williamson County
> 2010-2017 population change: +22.9% (184,130 to 226,257)
> 2010-2017 population change, Tennessee: +5.7% (6,355,882 to 6,715,984)
> 2010-2017 pop. change due to migration: +35,034
> 2017 unemployment: 2.7% (Tennessee: 3.7%)
[recirclink id=443620]

43. Texas: Hays County
> 2010-2017 population change: +35.6% (158,203 to 214,485)
> 2010-2017 population change, Texas: +12.1% (25,241,648 to 28,304,596)
> 2010-2017 pop. change due to migration: +46,658
> 2017 unemployment: 3.1% (Texas: 4.3%)

44. Utah: Wasatch County
> 2010-2017 population change: +35.8% (23,644 to 32,106)
> 2010-2017 population change, Utah: +11.8% (2,775,260 to 3,101,833)
> 2010-2017 pop. change due to migration: +6,396
> 2017 unemployment: 3.3% (Utah: 3.2%)
[in-text-ad-2]

45. Vermont: Chittenden County
> 2010-2017 population change: +3.6% (156,752 to 162,372)
> 2010-2017 population change, Vermont: -0.3% (625,842 to 623,657)
> 2010-2017 pop. change due to migration: +2,158
> 2017 unemployment: 2.3% (Vermont: 3.0%)

46. Virginia: Loudoun County
> 2010-2017 population change: +26.1% (315,600 to 398,080)
> 2010-2017 population change, Virginia: +5.5% (8,025,206 to 8,470,020)
> 2010-2017 pop. change due to migration: +56,561
> 2017 unemployment: 3.0% (Virginia: 3.8%)
[in-text-ad]

47. Washington: Franklin County
> 2010-2017 population change: +16.5% (79,093 to 92,125)
> 2010-2017 population change, Washington: +9.9% (6,741,386 to 7,405,743)
> 2010-2017 pop. change due to migration: +4,462
> 2017 unemployment: 6.3% (Washington: 4.8%)
[recirclink id=443575]

48. West Virginia: Berkeley County
> 2010-2017 population change: +9.8% (104,617 to 114,920)
> 2010-2017 population change, West Virginia: -2.1% (1,854,315 to 1,815,857)
> 2010-2017 pop. change due to migration: +7,641
> 2017 unemployment: 3.7% (West Virginia: 5.2%)

49. Wisconsin: Dane County
> 2010-2017 population change: +9.7% (489,207 to 536,416)
> 2010-2017 population change, Wisconsin: +1.8% (5,690,403 to 5,795,483)
> 2010-2017 pop. change due to migration: +26,370
> 2017 unemployment: 2.4% (Wisconsin: 3.3%)
[in-text-ad-2]

50. Wyoming: Teton County
> 2010-2017 population change: +9.3% (21,295 to 23,265)
> 2010-2017 population change, Wyoming: +2.6% (564,376 to 579,315)
> 2010-2017 pop. change due to migration: +689
> 2017 unemployment: 3.0% (Wyoming: 4.2%)
Contact [email protected] for any questions or corrections.