
[cnxvideo id=”625487″ placement=”ros”]The United States has added about 17 million people since 2010, but growth has been far from even nationwide. While some areas contributed considerably to the national population growth, others have been shrinking at a fast pace.
Though nationwide the population grew by 5.3% since 2010, there are many places in the United States that are losing hundreds, sometimes thousands of residents every year. Examining population changes at a more local level, the county levels, reveals that across the country there are some counties that have lost more than 10% of their populations since 2010.
In fact, in nearly every state in the country there is at least one county or county equivalent where the overall population has declined. Reviewing population change figures from the Census Bureau from July 2010 through July 2017, 24/7 Wall St. identified the fastest shrinking county in each state. In four states — Delaware, Oregon, Washington, and Hawaii — no county’s population has declined. In states that do not have counties we reviewed what the Census Bureau treats as the equivalent to a county.
For the United States as a whole, natural growth — births minus deaths — is the largest source of population growth. Following natural growth, immigration from other countries accounts for the rest of the population growth. In the fastest shrinking county in each state, however, most of the population decline is due to people moving away at a much faster rate than they are arriving.
24/7 Wall St. spoke to Dr. William Frey, a demographer with the Brookings Institution, about national migration trends. While he explained that there are many reasons for residents to leave a place, including the search for cheaper housing, Frey noted that jobs have traditionally been one of the main reasons people into or out of an area. In the vast majority of the fastest shrinking counties on this list, the unemployment rate is higher compared to the state unemployment rate.
To identify the fastest shrinking county in every state, 24/7 Wall St. reviewed the seven-year population estimate change from the U.S Census Bureau’s Annual Estimates of the Resident Population from July 2010-July 2017. Only counties with a base population (from April 2010) greater than 10,000 were considered. If a county had a seven year population decline but an increase over either the most recent three- or two-year period, it was, it was excluded.
Click here to see the fastest shrinking county in every state.
Click here to see the fastest growing county in every state.

1. Alabama: Macon County
> 2010-2017 population change: -12.8% (21,506 to 18,755)
> 2010-2017 population change, Alabama: +1.9% (4,785,579 to 4,874,747)
> 2010-2017 pop. change due to migration: -2,454
> 2017 unemployment: 5.8% (Alabama: 4.4%)
[in-text-ad]

2. Alaska: Kodiak Island Borough
> 2010-2017 population change: -1.5% (13,652 to 13,448)
> 2010-2017 population change, Alaska: +3.6% (714,015 to 739,795)
> 2010-2017 pop. change due to migration: -1,388
> 2017 unemployment: 5.1% (Alaska: 7.2%)
[recirclink id=444492]
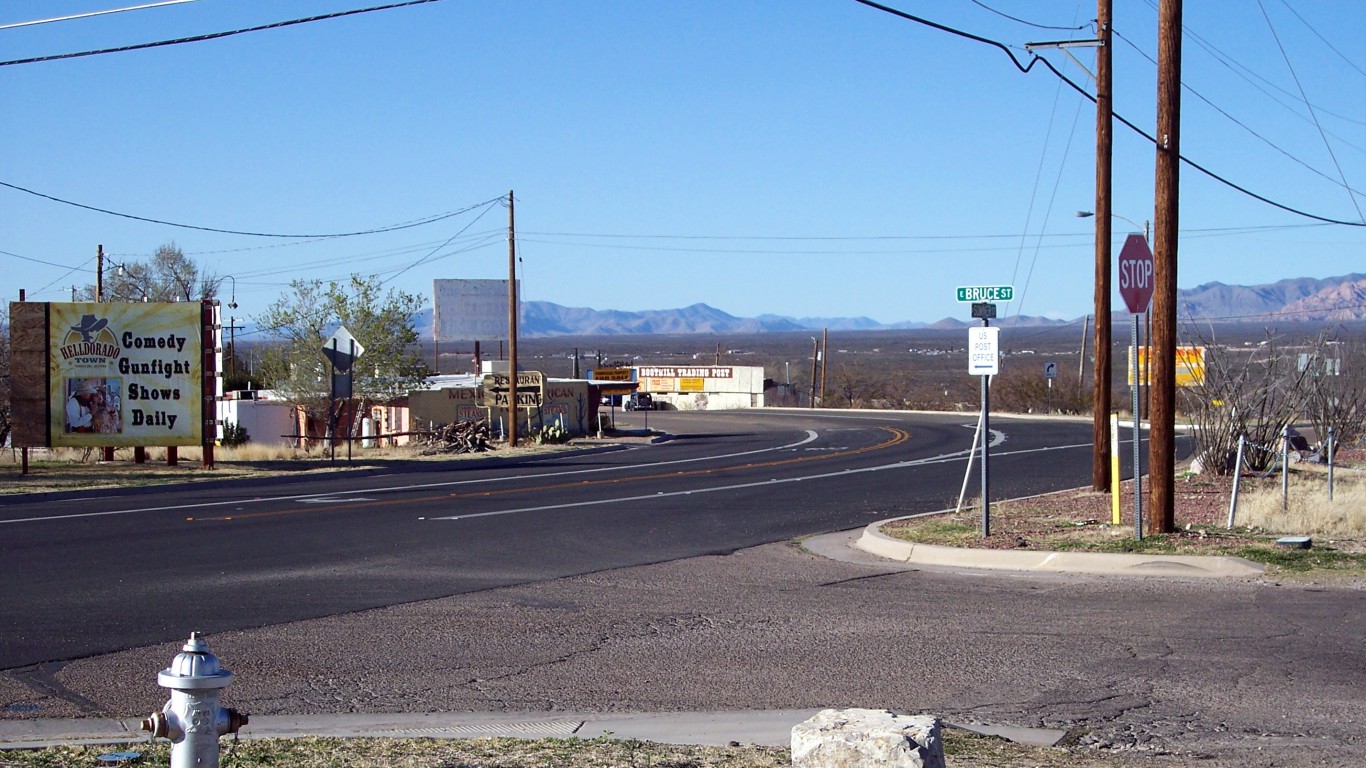
3. Arizona: Cochise County
> 2010-2017 population change: -5.3% (131,782 to 124,756)
> 2010-2017 population change, Arizona: +9.5% (6,407,002 to 7,016,270)
> 2010-2017 pop. change due to migration: -9,495
> 2017 unemployment: 5.6% (Arizona: 4.9%)

4. Arkansas: Phillips County
> 2010-2017 population change: -14.3% (21,675 to 18,572)
> 2010-2017 population change, Arkansas: +2.8% (2,921,737 to 3,004,279)
> 2010-2017 pop. change due to migration: -3,476
> 2017 unemployment: 5.8% (Arkansas: 3.7%)
[in-text-ad-2]

5. California: Lassen County
> 2010-2017 population change: -10.5% (34,831 to 31,163)
> 2010-2017 population change, California: +5.9% (37,327,690 to 39,536,653)
> 2010-2017 pop. change due to migration: -4,499
> 2017 unemployment: 5.6% (California: 4.8%)

6. Colorado: Rio Grande County
> 2010-2017 population change: -6.0% (12,025 to 11,301)
> 2010-2017 population change, Colorado: +11.1% (5,048,029 to 5,607,154)
> 2010-2017 pop. change due to migration: -817
> 2017 unemployment: 4.3% (Colorado: 2.8%)
[in-text-ad]

7. Connecticut: Litchfield County
> 2010-2017 population change: -4.0% (189,829 to 182,177)
> 2010-2017 population change, Connecticut: +0.2% (3,580,171 to 3,588,184)
> 2010-2017 pop. change due to migration: -5,572
> 2017 unemployment: 4.3% (Connecticut: 4.7%)
[recirclink id=444468]

8. Delaware: No county with population decline
> 2010-2017 population change, Delaware: +6.9% (899,712 to 961,939)

9. Florida: Madison County
> 2010-2017 population change: -4.2% (19,248 to 18,449)
> 2010-2017 population change, Florida: +11.3% (18,846,461 to 20,984,400)
> 2010-2017 pop. change due to migration: -652
> 2017 unemployment: 4.4% (Florida: 4.2%)
[in-text-ad-2]
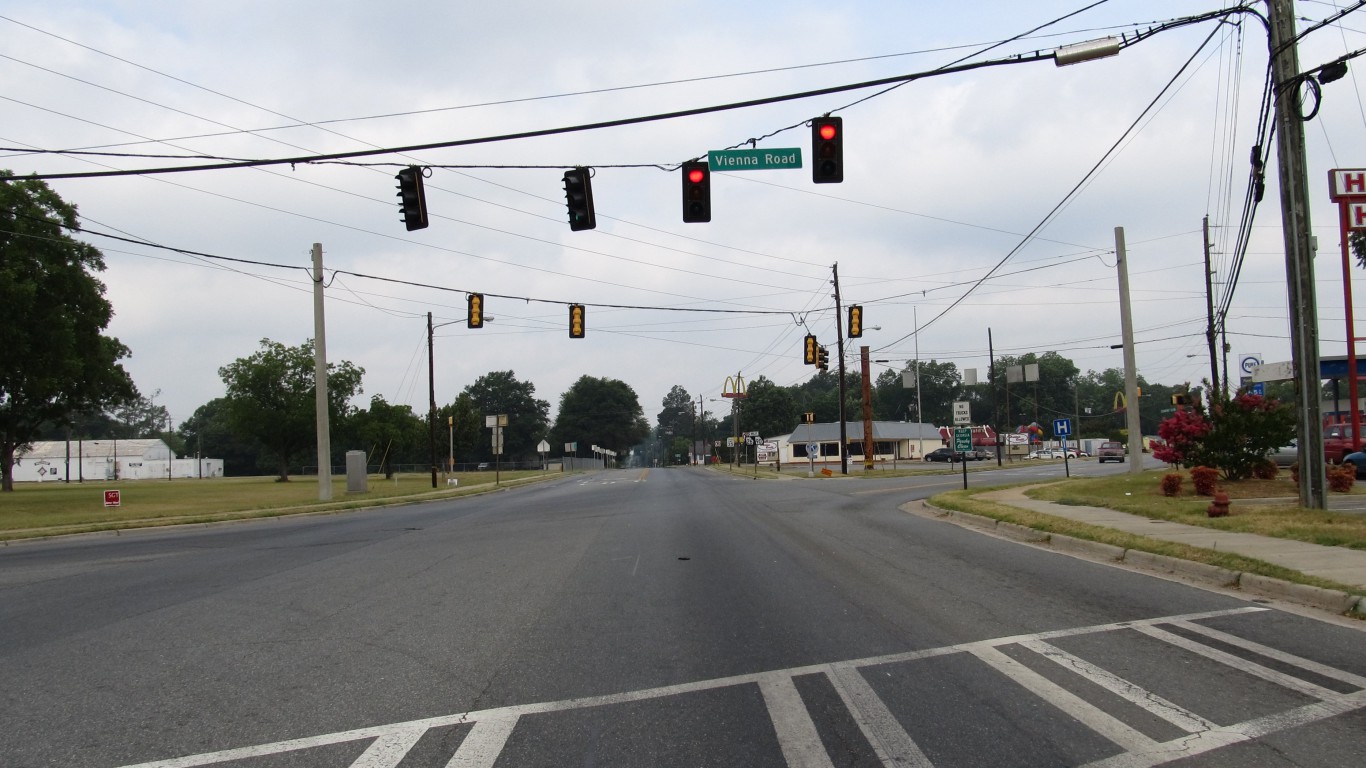
10. Georgia: Macon County
> 2010-2017 population change: -9.1% (14,641 to 13,314)
> 2010-2017 population change, Georgia: +7.4% (9,712,696 to 10,429,379)
> 2010-2017 pop. change due to migration: -1,377
> 2017 unemployment: 7.0% (Georgia: 4.7%)

11. Hawaii:: No county with population decline
> 2010-2017 population change, Hawaii: +4.7% (1,363,817 to 1,427,538)
[in-text-ad]

12. Idaho: Gooding County
> 2010-2017 population change: -2.2% (15,462 to 15,124)
> 2010-2017 population change, Idaho: +9.3% (1,570,912 to 1,716,943)
> 2010-2017 pop. change due to migration: -834
> 2017 unemployment: 2.4% (Idaho: 3.2%)
[recirclink id=444391]

13. Illinois: Cass County
> 2010-2017 population change: -8.3% (13,635 to 12,505)
> 2010-2017 population change, Illinois: -0.3% (12,841,196 to 12,802,023)
> 2010-2017 pop. change due to migration: -1,360
> 2017 unemployment: 4.5% (Illinois: 5.0%)

14. Indiana: Blackford County
> 2010-2017 population change: -6.2% (12,771 to 11,976)
> 2010-2017 population change, Indiana: +2.7% (6,490,029 to 6,666,818)
> 2010-2017 pop. change due to migration: -641
> 2017 unemployment: 4.0% (Indiana: 3.5%)
[in-text-ad-2]
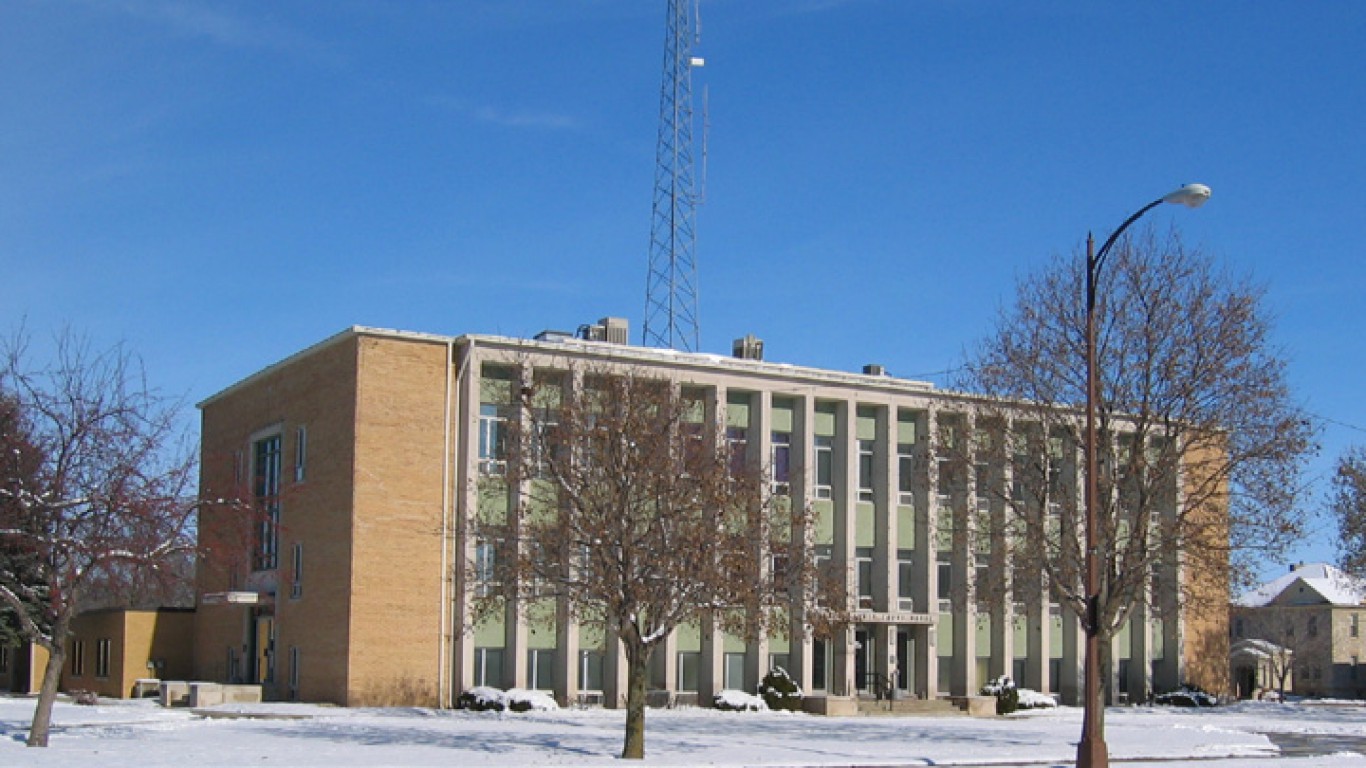
15. Iowa: Emmet County
> 2010-2017 population change: -8.1% (10,268 to 9,432)
> 2010-2017 population change, Iowa: +3.1% (3,050,223 to 3,145,711)
> 2010-2017 pop. change due to migration: -787
> 2017 unemployment: 3.2% (Iowa: 3.1%)

16. Kansas: Montgomery County
> 2010-2017 population change: -7.9% (35,353 to 32,556)
> 2010-2017 population change, Kansas: +1.9% (2,858,403 to 2,913,123)
> 2010-2017 pop. change due to migration: -3,113
> 2017 unemployment: 5.2% (Kansas: 3.6%)
[in-text-ad]
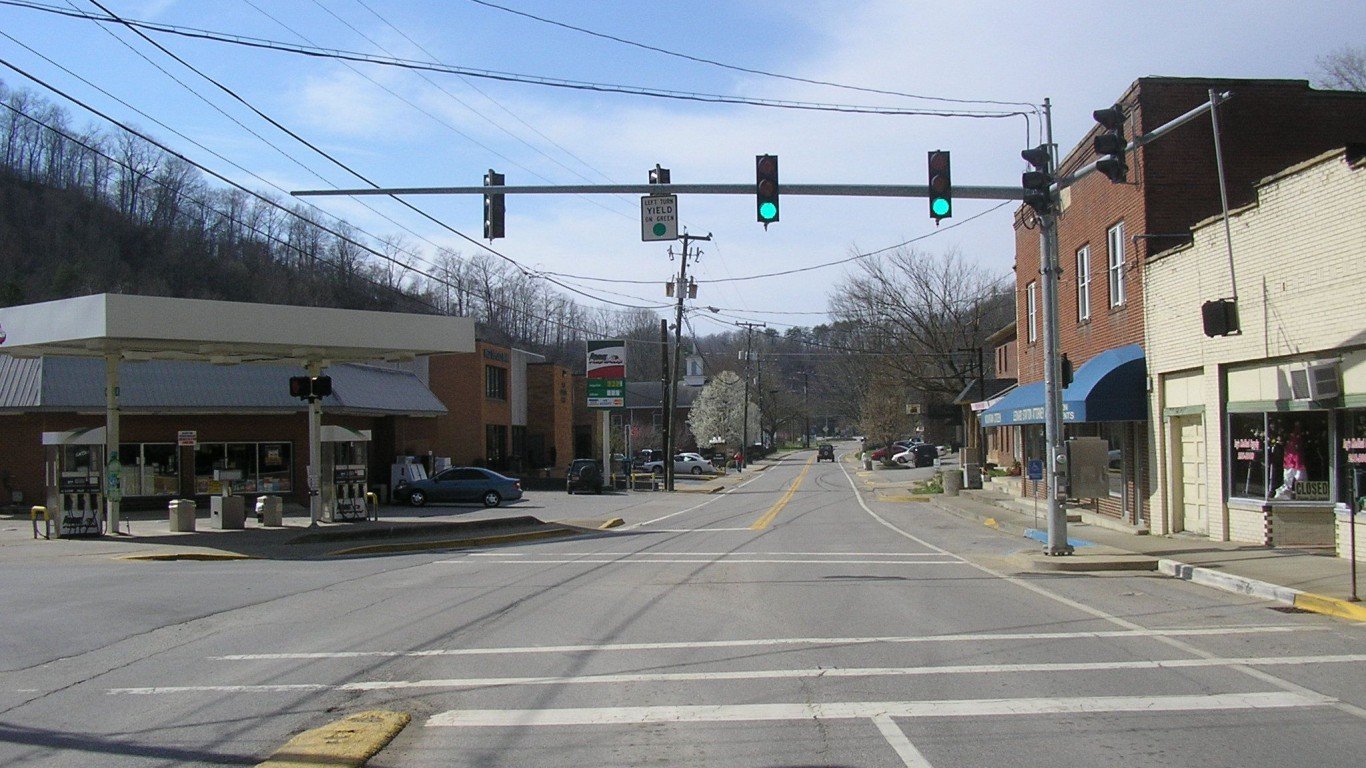
17. Kentucky: Martin County
> 2010-2017 population change: -11.3% (12,913 to 11,452)
> 2010-2017 population change, Kentucky: +2.4% (4,347,948 to 4,454,189)
> 2010-2017 pop. change due to migration: -1,413
> 2017 unemployment: 7.3% (Kentucky: 4.9%)
[recirclink id=444326]

18. Louisiana: Morehouse Parish
> 2010-2017 population change: -8.0% (27,872 to 25,641)
> 2010-2017 population change, Louisiana: +3.1% (4,544,871 to 4,684,333)
> 2010-2017 pop. change due to migration: -2,243
> 2017 unemployment: 8.0% (Louisiana: 5.1%)
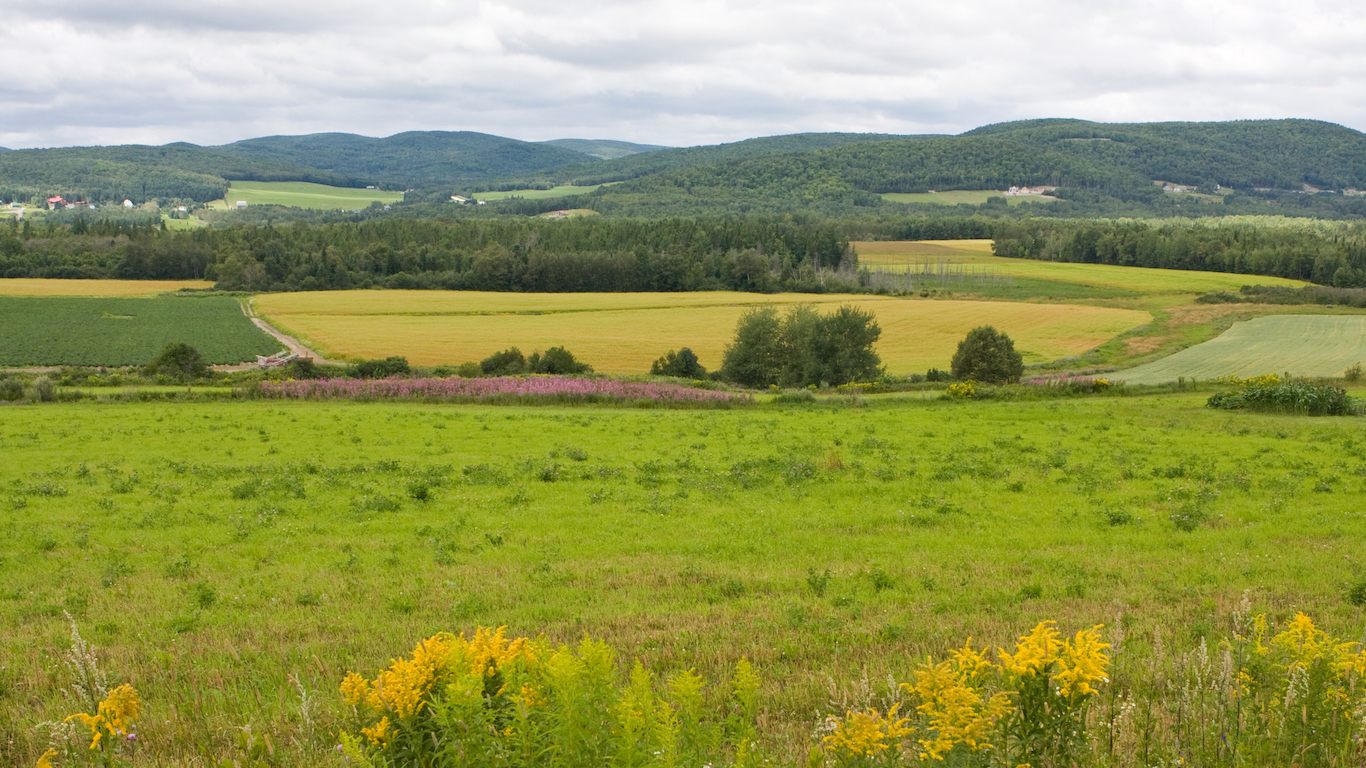
19. Maine: Aroostook County
> 2010-2017 population change: -5.6% (71,697 to 67,653)
> 2010-2017 population change, Maine: +0.6% (1,327,568 to 1,335,907)
> 2010-2017 pop. change due to migration: -2,861
> 2017 unemployment: 4.8% (Maine: 3.3%)
[in-text-ad-2]
20. Maryland: Allegany County
> 2010-2017 population change: -4.5% (74,977 to 71,615)
> 2010-2017 population change, Maryland: +4.6% (5,788,099 to 6,052,177)
> 2010-2017 pop. change due to migration: -1,872
> 2017 unemployment: 5.8% (Maryland: 4.1%)

21. Massachusetts: Berkshire County
> 2010-2017 population change: -3.8% (131,294 to 126,313)
> 2010-2017 population change, Massachusetts: +4.5% (6,564,943 to 6,859,819)
> 2010-2017 pop. change due to migration: -2,325
> 2017 unemployment: 4.3% (Massachusetts: 3.7%)
[in-text-ad]

22. Michigan: Gogebic County
> 2010-2017 population change: -6.4% (16,399 to 15,342)
> 2010-2017 population change, Michigan: +0.9% (9,876,731 to 9,962,311)
> 2010-2017 pop. change due to migration: -440
> 2017 unemployment: 6.1% (Michigan: 4.6%)
[recirclink id=444046]

23. Minnesota: Renville County
> 2010-2017 population change: -6.6% (15,685 to 14,645)
> 2010-2017 population change, Minnesota: +5.0% (5,310,711 to 5,576,606)
> 2010-2017 pop. change due to migration: -1,001
> 2017 unemployment: 4.5% (Minnesota: 3.5%)
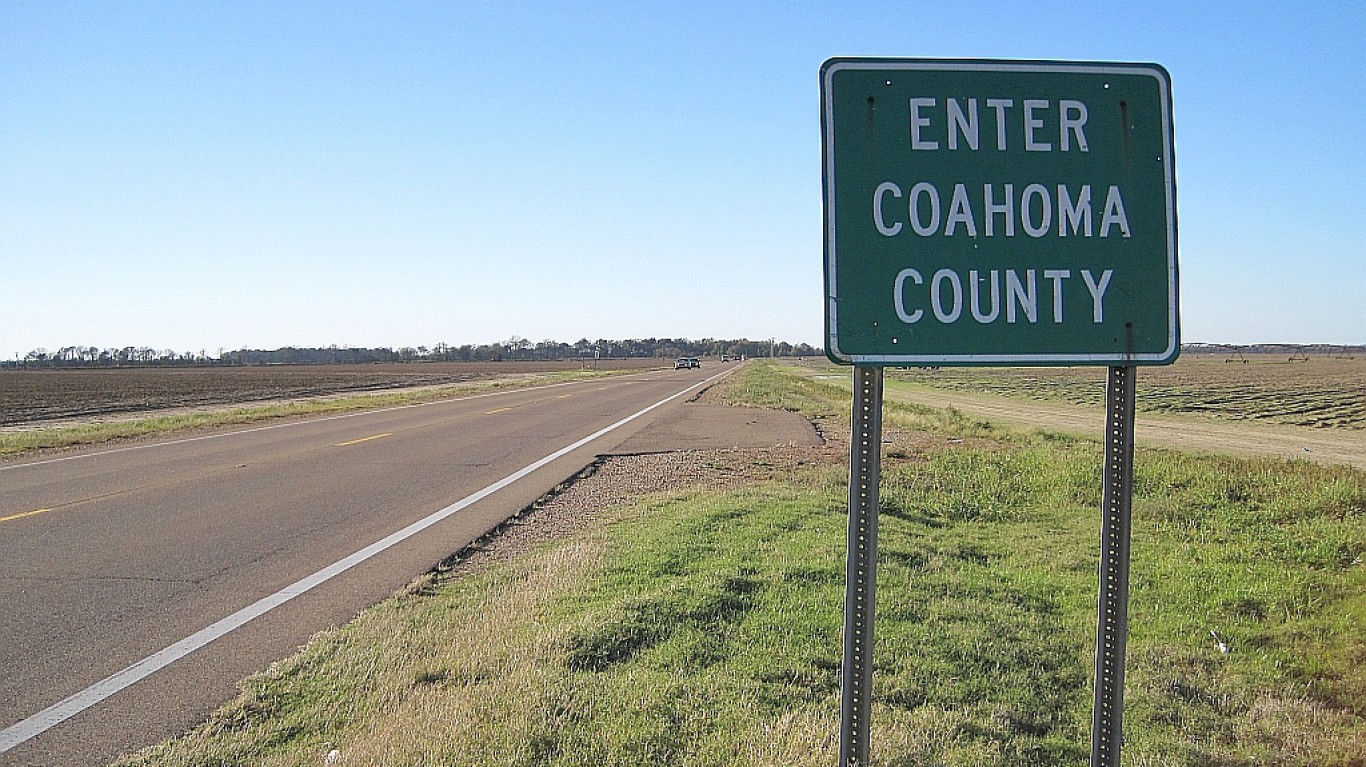
24. Mississippi: Coahoma County
> 2010-2017 population change: -11.3% (26,106 to 23,154)
> 2010-2017 population change, Mississippi: +0.5% (2,970,437 to 2,984,100)
> 2010-2017 pop. change due to migration: -3,910
> 2017 unemployment: 7.3% (Mississippi: 5.1%)
[in-text-ad-2]

25. Missouri: Pemiscot County
> 2010-2017 population change: -7.9% (18,271 to 16,826)
> 2010-2017 population change, Missouri: +2.0% (5,995,681 to 6,113,532)
> 2010-2017 pop. change due to migration: -1,784
> 2017 unemployment: 7.6% (Missouri: 3.8%)

26. Montana: Fergus County
> 2010-2017 population change: -2.5% (11,580 to 11,291)
> 2010-2017 population change, Montana: +6.1% (990,507 to 1,050,493)
> 2010-2017 pop. change due to migration: -35
> 2017 unemployment: 4.0% (Montana: 4.0%)
[in-text-ad]

27. Nebraska: Dakota County
> 2010-2017 population change: -4.0% (21,032 to 20,186)
> 2010-2017 population change, Nebraska: +4.9% (1,829,956 to 1,920,076)
> 2010-2017 pop. change due to migration: -2,351
> 2017 unemployment: 4.1% (Nebraska: 2.9%)
[recirclink id=443940]
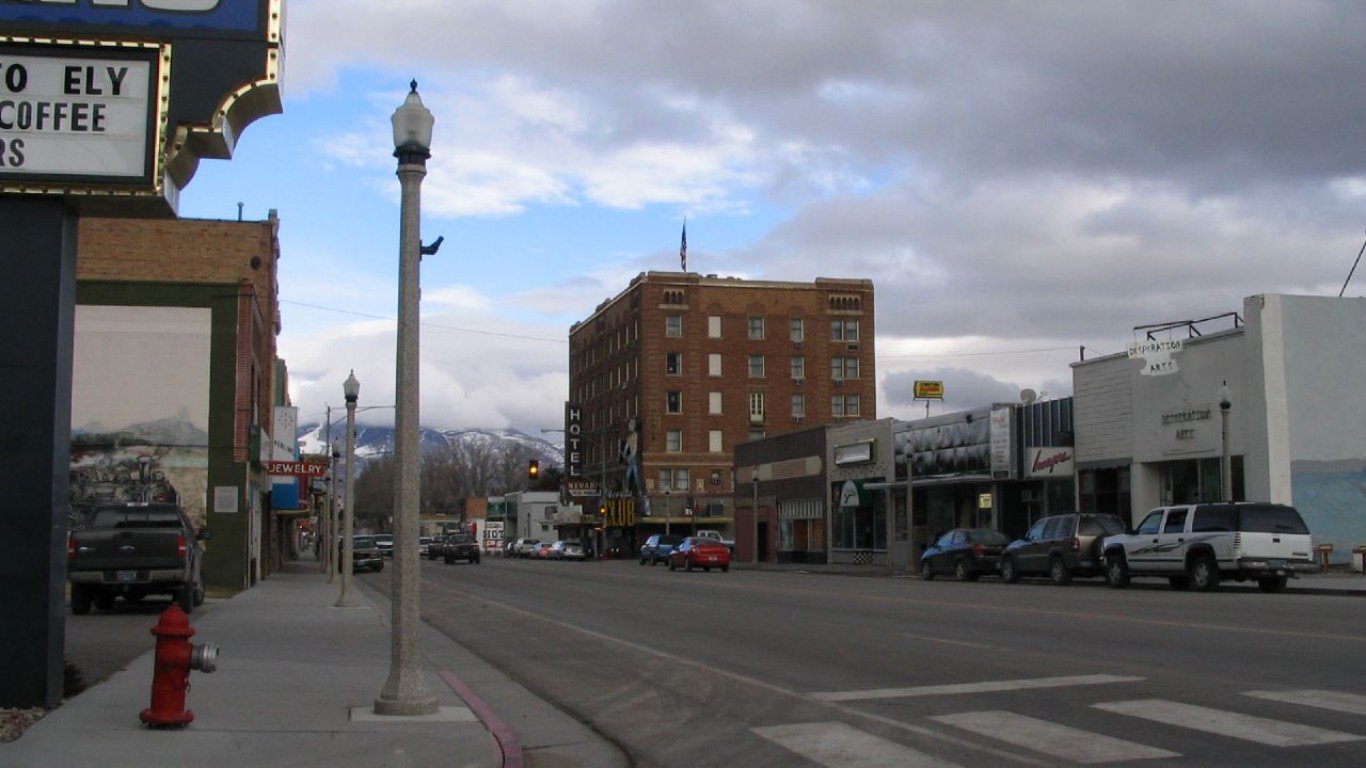
28. Nevada: White Pine County
> 2010-2017 population change: -4.4% (10,030 to 9,592)
> 2010-2017 population change, Nevada: +10.9% (2,702,797 to 2,998,039)
> 2010-2017 pop. change due to migration: -507
> 2017 unemployment: 4.0% (Nevada: 5.0%)

29. New Hampshire: Coos County
> 2010-2017 population change: -4.1% (32,974 to 31,634)
> 2010-2017 population change, New Hampshire: +2.0% (1,316,700 to 1,342,795)
> 2010-2017 pop. change due to migration: -212
> 2017 unemployment: 3.4% (New Hampshire: 2.7%)
[in-text-ad-2]

30. New Jersey: Salem County
> 2010-2017 population change: -4.8% (65,982 to 62,792)
> 2010-2017 population change, New Jersey: +2.3% (8,803,708 to 9,005,644)
> 2010-2017 pop. change due to migration: -3,020
> 2017 unemployment: 6.1% (New Jersey: 4.6%)
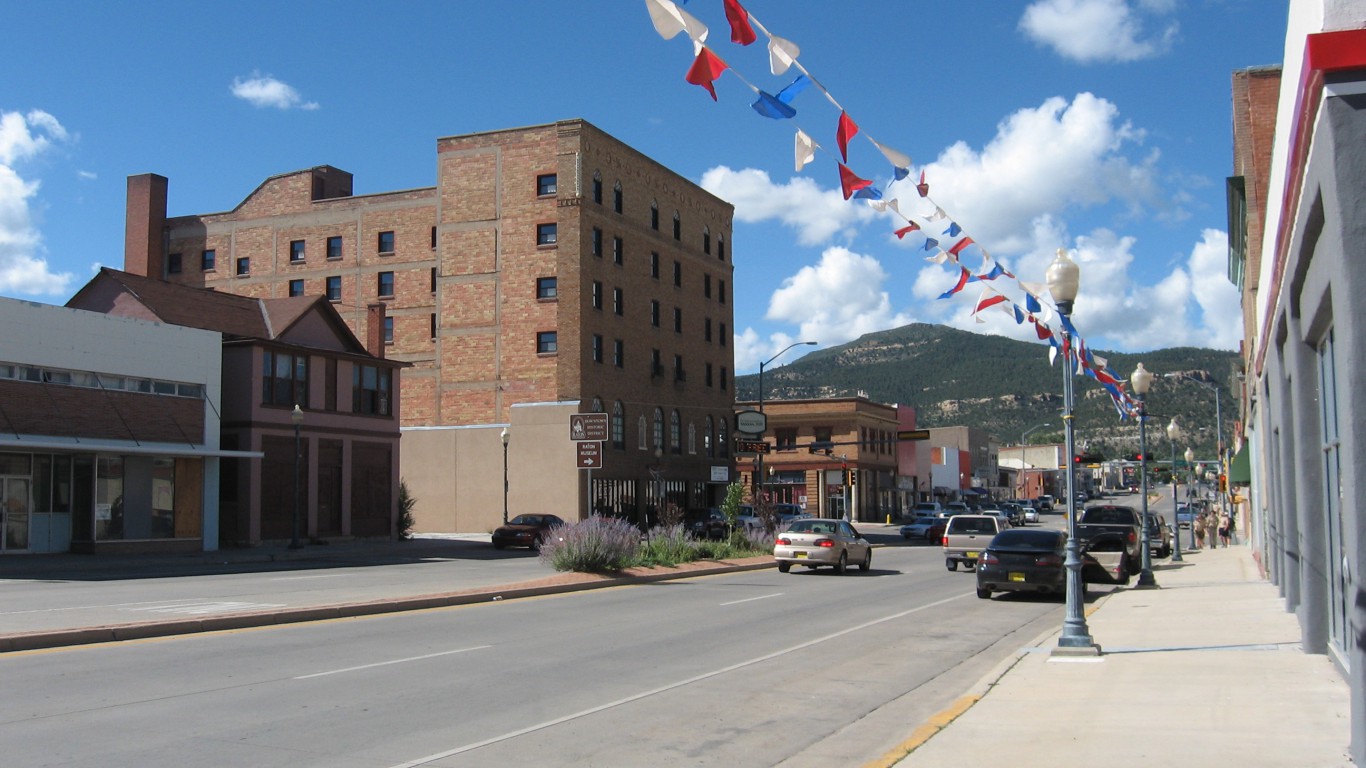
31. New Mexico: Colfax County
> 2010-2017 population change: -11.4% (13,733 to 12,174)
> 2010-2017 population change, New Mexico: +1.1% (2,064,607 to 2,088,070)
> 2010-2017 pop. change due to migration: -1,449
> 2017 unemployment: 6.0% (New Mexico: 6.2%)
[in-text-ad]

32. New York: Delaware County
> 2010-2017 population change: -6.0% (47,888 to 45,001)
> 2010-2017 population change, New York: +2.3% (19,405,185 to 19,849,399)
> 2010-2017 pop. change due to migration: -1,887
> 2017 unemployment: 5.6% (New York: 4.7%)
[recirclink id=443564]

33. North Carolina: Northampton County
> 2010-2017 population change: -9.9% (22,034 to 19,862)
> 2010-2017 population change, North Carolina: +7.3% (9,574,247 to 10,273,419)
> 2010-2017 pop. change due to migration: -1,585
> 2017 unemployment: 6.3% (North Carolina: 4.6%)

34. North Dakota: Barnes County
> 2010-2017 population change: -2.9% (11,060 to 10,734)
> 2010-2017 population change, North Dakota: +12.0% (674,518 to 755,393)
> 2010-2017 pop. change due to migration: -217
> 2017 unemployment: 2.7% (North Dakota: 2.6%)
[in-text-ad-2]
35. Ohio: Carroll County
> 2010-2017 population change: -5.1% (28,848 to 27,385)
> 2010-2017 population change, Ohio: +1.0% (11,539,282 to 11,658,609)
> 2010-2017 pop. change due to migration: -1,271
> 2017 unemployment: 5.9% (Ohio: 5.0%)

36. Oklahoma: Latimer County
> 2010-2017 population change: -6.7% (11,153 to 10,411)
> 2010-2017 population change, Oklahoma: +4.6% (3,759,529 to 3,930,864)
> 2010-2017 pop. change due to migration: -772
> 2017 unemployment: 7.5% (Oklahoma: 4.3%)
[in-text-ad]

37. Oregon: No county with population decline
> 2010-2017 population change, Oregon: +8.0% (3,837,073 to 4,142,776)
[recirclink id=443882]

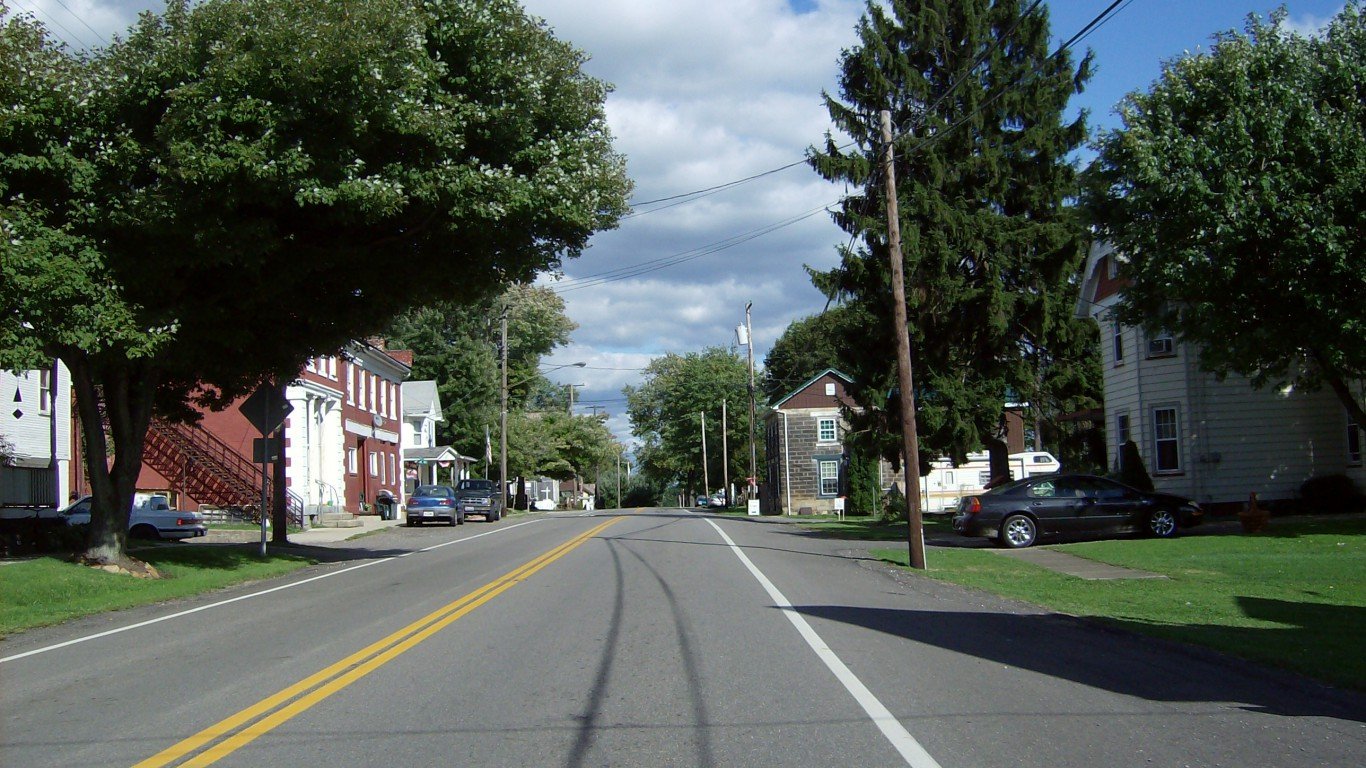
38. Pennsylvania: Cambria County
> 2010-2017 population change: -7.2% (143,452 to 133,054)
> 2010-2017 population change, Pennsylvania: +0.7% (12,711,063 to 12,805,537)
> 2010-2017 pop. change due to migration: -7,070
> 2017 unemployment: 6.1% (Pennsylvania: 4.9%)

39. Rhode Island: Bristol County
> 2010-2017 population change: -1.8% (49,808 to 48,912)
> 2010-2017 population change, Rhode Island: +0.6% (1,053,169 to 1,059,639)
> 2010-2017 pop. change due to migration: +202
> 2017 unemployment: 3.8% (Rhode Island: 4.5%)
[in-text-ad-2]

40. South Carolina: Allendale County
> 2010-2017 population change: -13.1% (10,354 to 9,002)
> 2010-2017 population change, South Carolina: +8.4% (4,635,834 to 5,024,369)
> 2010-2017 pop. change due to migration: -1,308
> 2017 unemployment: 6.9% (South Carolina: 4.3%)

41. South Dakota: Butte County
> 2010-2017 population change: -0.4% (10,145 to 10,107)
> 2010-2017 population change, South Dakota: +6.5% (816,227 to 869,666)
> 2010-2017 pop. change due to migration: -152
> 2017 unemployment: 3.7% (South Dakota: 3.3%)
[in-text-ad]

42. Tennessee: Lauderdale County
> 2010-2017 population change: -8.8% (27,719 to 25,274)
> 2010-2017 population change, Tennessee: +5.7% (6,355,882 to 6,715,984)
> 2010-2017 pop. change due to migration: -2,691
> 2017 unemployment: 5.9% (Tennessee: 3.7%)
[recirclink id=443620]

43. Texas: Dawson County
> 2010-2017 population change: -7.3% (13,827 to 12,813)
> 2010-2017 population change, Texas: +12.1% (25,241,648 to 28,304,596)
> 2010-2017 pop. change due to migration: -1,416
> 2017 unemployment: 4.9% (Texas: 4.3%)
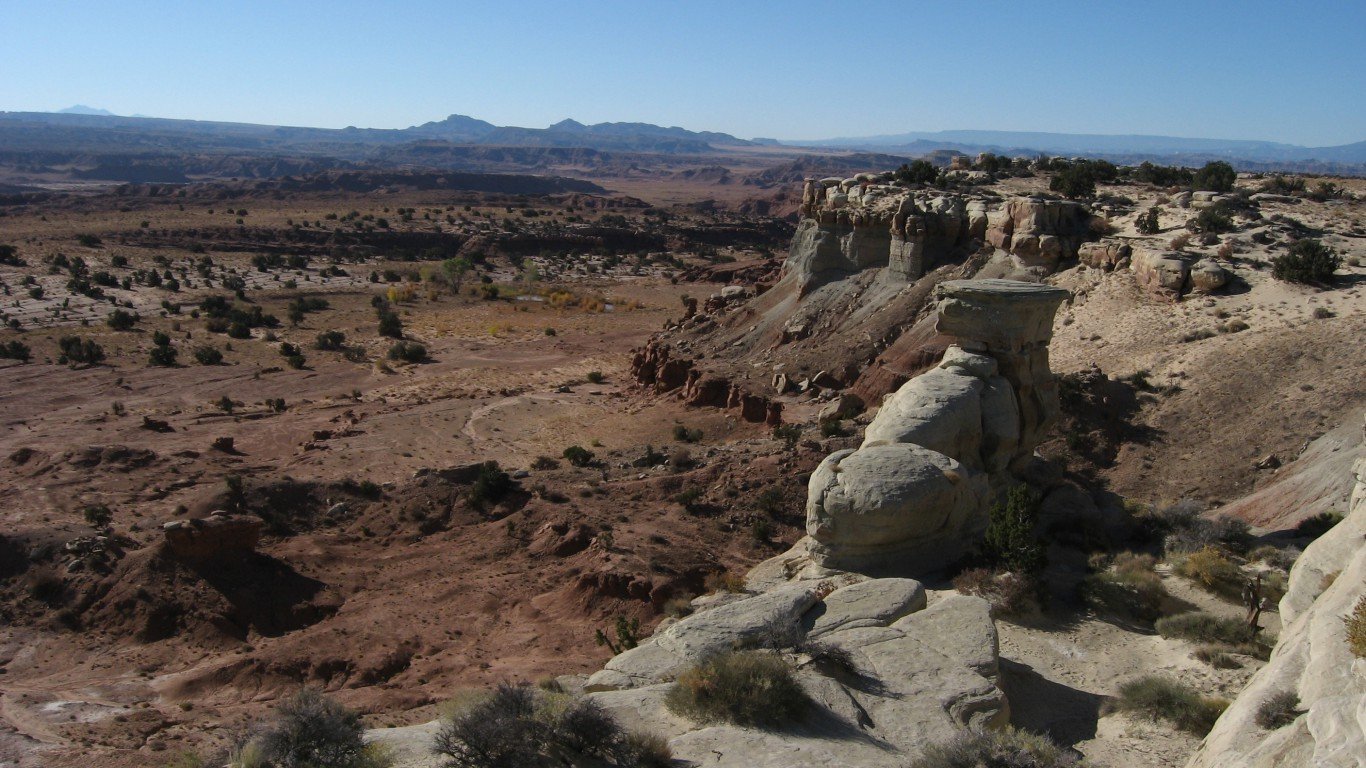
44. Utah: Emery County
> 2010-2017 population change: -8.4% (11,005 to 10,077)
> 2010-2017 population change, Utah: +11.8% (2,775,260 to 3,101,833)
> 2010-2017 pop. change due to migration: -1,418
> 2017 unemployment: 5.2% (Utah: 3.2%)
[in-text-ad-2]
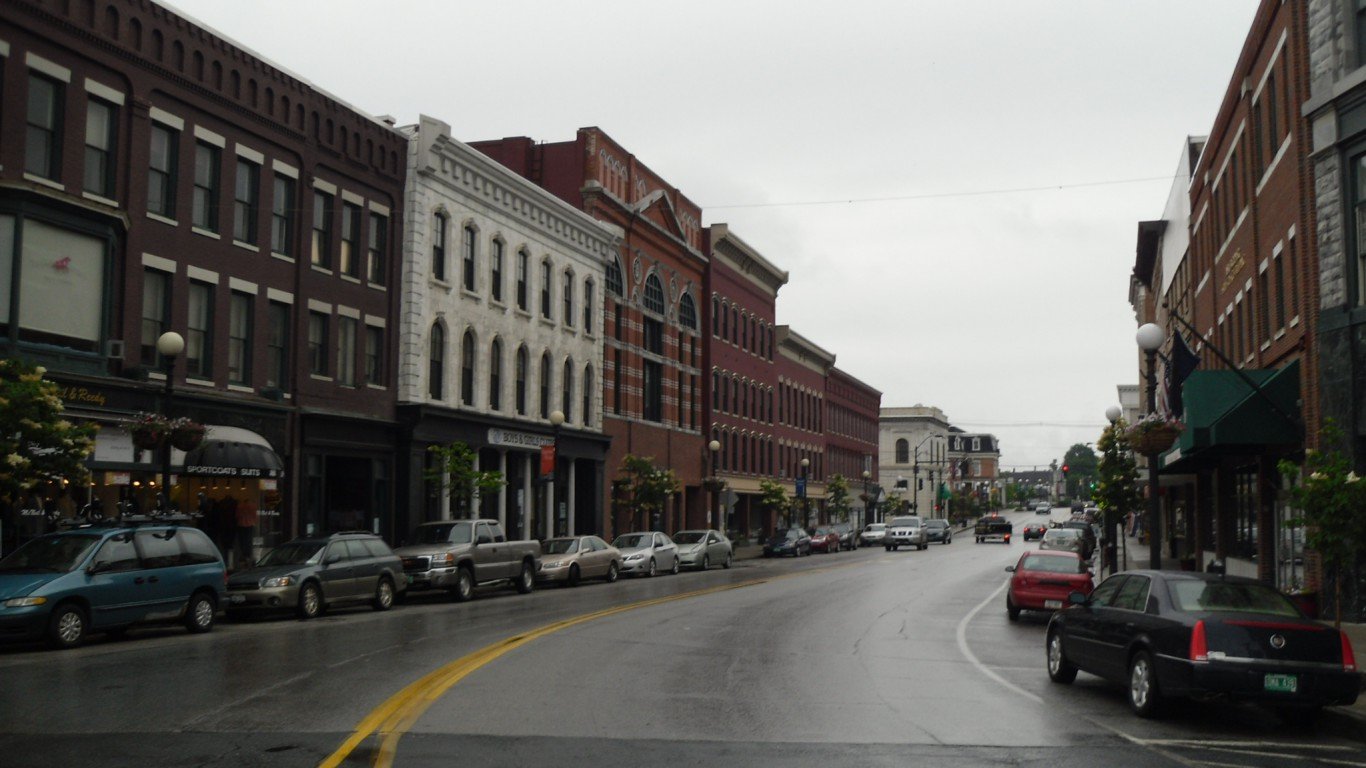
45. Vermont: Rutland County
> 2010-2017 population change: -4.0% (61,573 to 59,087)
> 2010-2017 population change, Vermont: -0.3% (625,842 to 623,657)
> 2010-2017 pop. change due to migration: -1,658
> 2017 unemployment: 3.5% (Vermont: 3.0%)
![]()
46. Virginia: Buchanan County
> 2010-2017 population change: -10.7% (24,082 to 21,514)
> 2010-2017 population change, Virginia: +5.5% (8,025,206 to 8,470,020)
> 2010-2017 pop. change due to migration: -1,917
> 2017 unemployment: 7.6% (Virginia: 3.8%)
[in-text-ad]

47. Washington: No county with population decline
> 2010-2017 population change, Washington: +9.9% (6,741,386 to 7,405,743)
[recirclink id=443575]
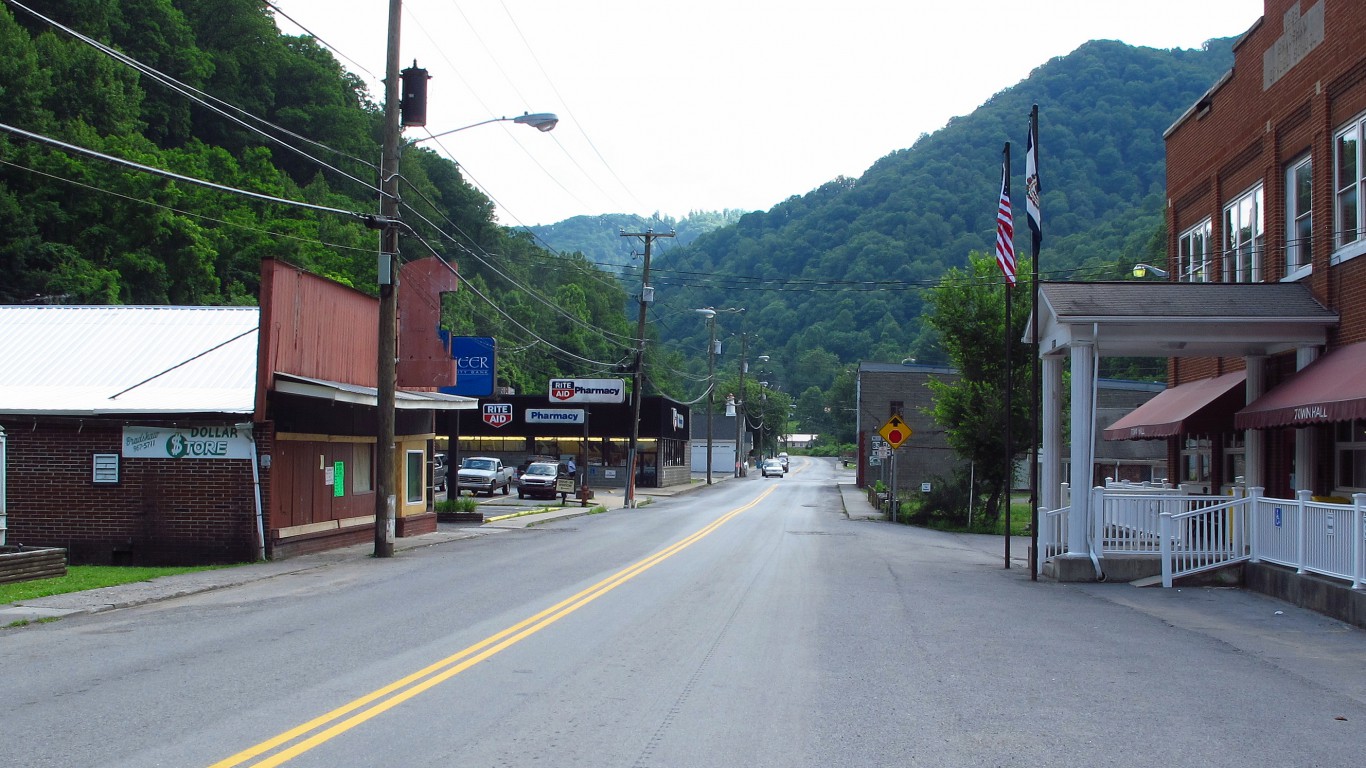
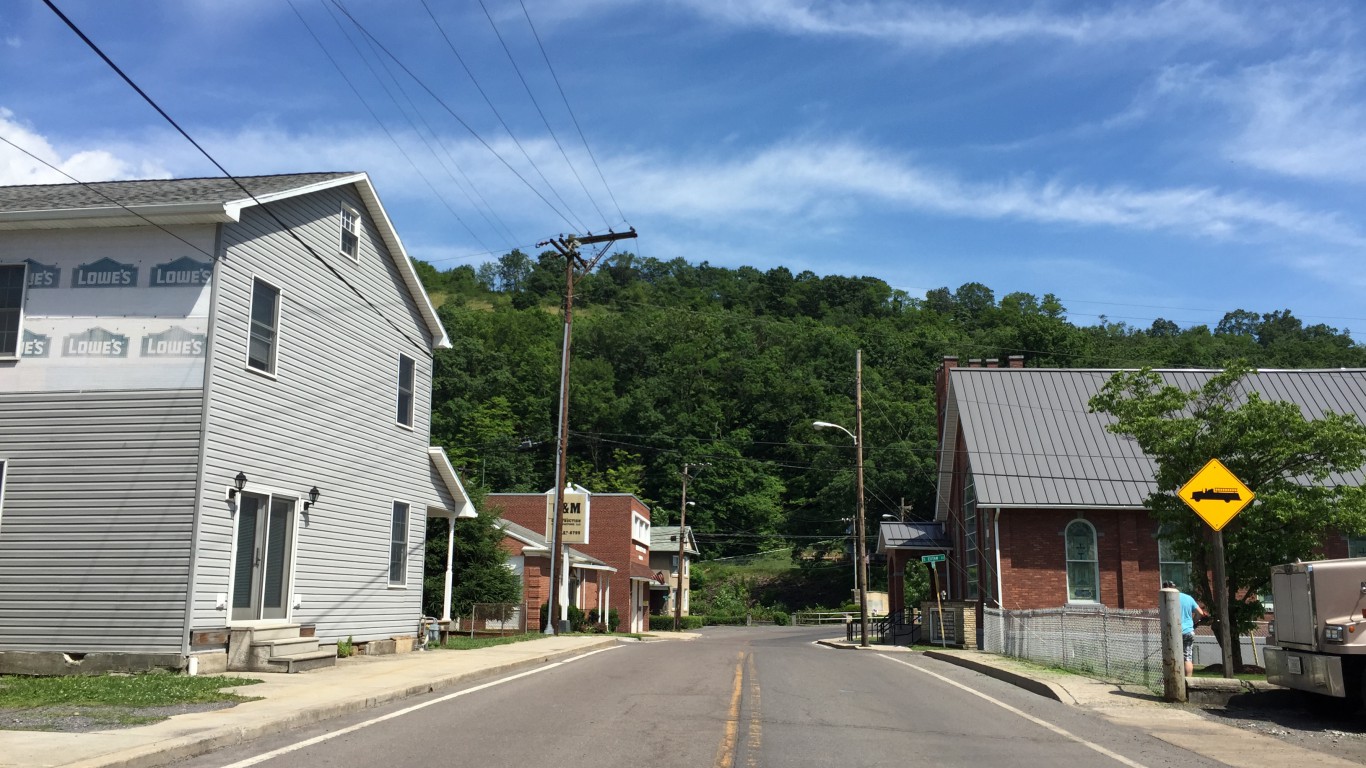
48. West Virginia: McDowell County
> 2010-2017 population change: -16.5% (22,099 to 18,456)
> 2010-2017 population change, West Virginia: -2.1% (1,854,315 to 1,815,857)
> 2010-2017 pop. change due to migration: -2,900
> 2017 unemployment: 8.5% (West Virginia: 5.2%)
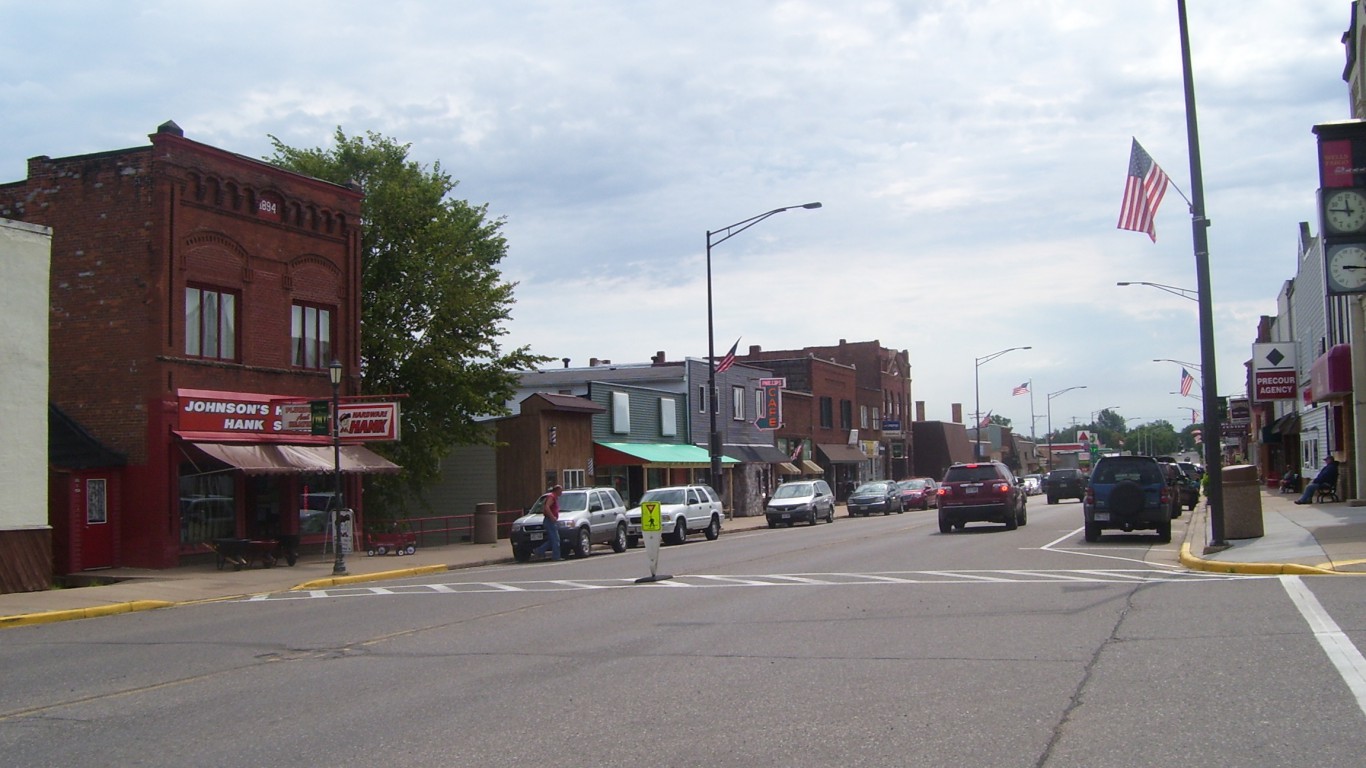
49. Wisconsin: Price County
> 2010-2017 population change: -4.6% (14,096 to 13,442)
> 2010-2017 population change, Wisconsin: +1.8% (5,690,403 to 5,795,483)
> 2010-2017 pop. change due to migration: -221
> 2017 unemployment: 3.8% (Wisconsin: 3.3%)
[in-text-ad-2]
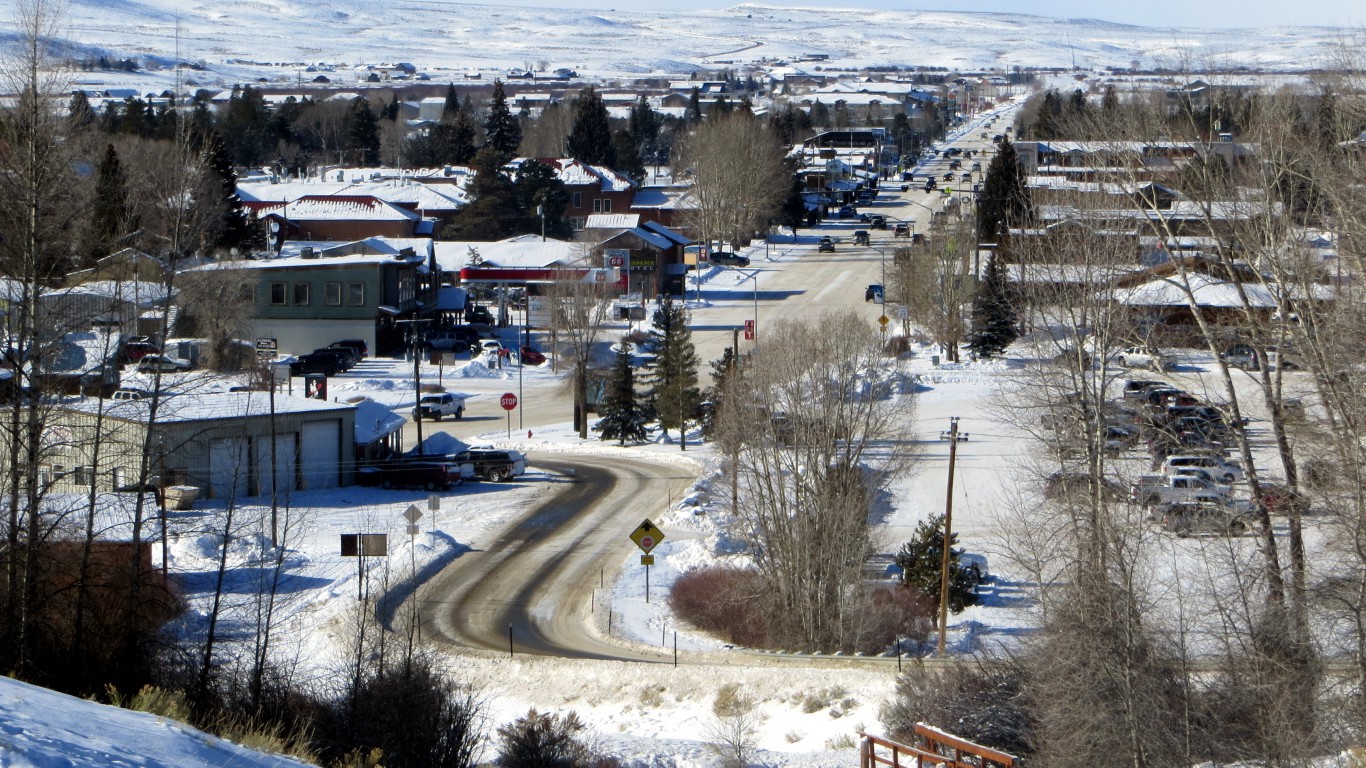
50. Wyoming: Sublette County
> 2010-2017 population change: -4.4% (10,254 to 9,799)
> 2010-2017 population change, Wyoming: +2.6% (564,376 to 579,315)
> 2010-2017 pop. change due to migration: -1,059
> 2017 unemployment: 4.4% (Wyoming: 4.2%)
Contact [email protected] for any questions or corrections.