
[cnxvideo id=”625450″ placement=”ros”]According to the Health Resources & Services Administration, the United States needs an additional 15,000 primary care physicians to meet its current demand for health care services. Physician shortages can make it difficult for patients to access the health care they need and contribute to negative health consequences.
As the aging baby boom generation continues to require increased medical care, demand for health care professionals will likely increase, and the national doctor shortage will likely worsen.
In some more rural parts of the country, the shortage of doctors is far more acute. While the HRSA defines an area with a population-to-primary care physician ratio greater than 3,500-to-1 as underserved, there are counties with more than 20,000 residents that are served by just one doctor. Faced with declining populations and low educational attainment, these rural counties struggle to attract and retain physicians.
To determine the counties in every state where there are no doctors, 24/7 Wall St. analyzed data on primary care physicians per capita from County Health Rankings & Roadmaps, a collaboration between the Robert Wood Johnson Foundation and the University of Wisconsin Population Health Institute.
Click here to see the counties in every state where there are no doctors.
Click here to see our detailed findings and methodology.

1. Alabama: Lowndes County
> Primary care physicians per 100,000: 9.5 (county), 65.4 (state)
> Poverty rate: 28.7% (county), 18.4% (state)
> Babies born w/ low birthweight: 14.7% (county), 10.1% (state)
> Population change, 2011-16: -8.4% (county), +2.0% (state)
[in-text-ad]

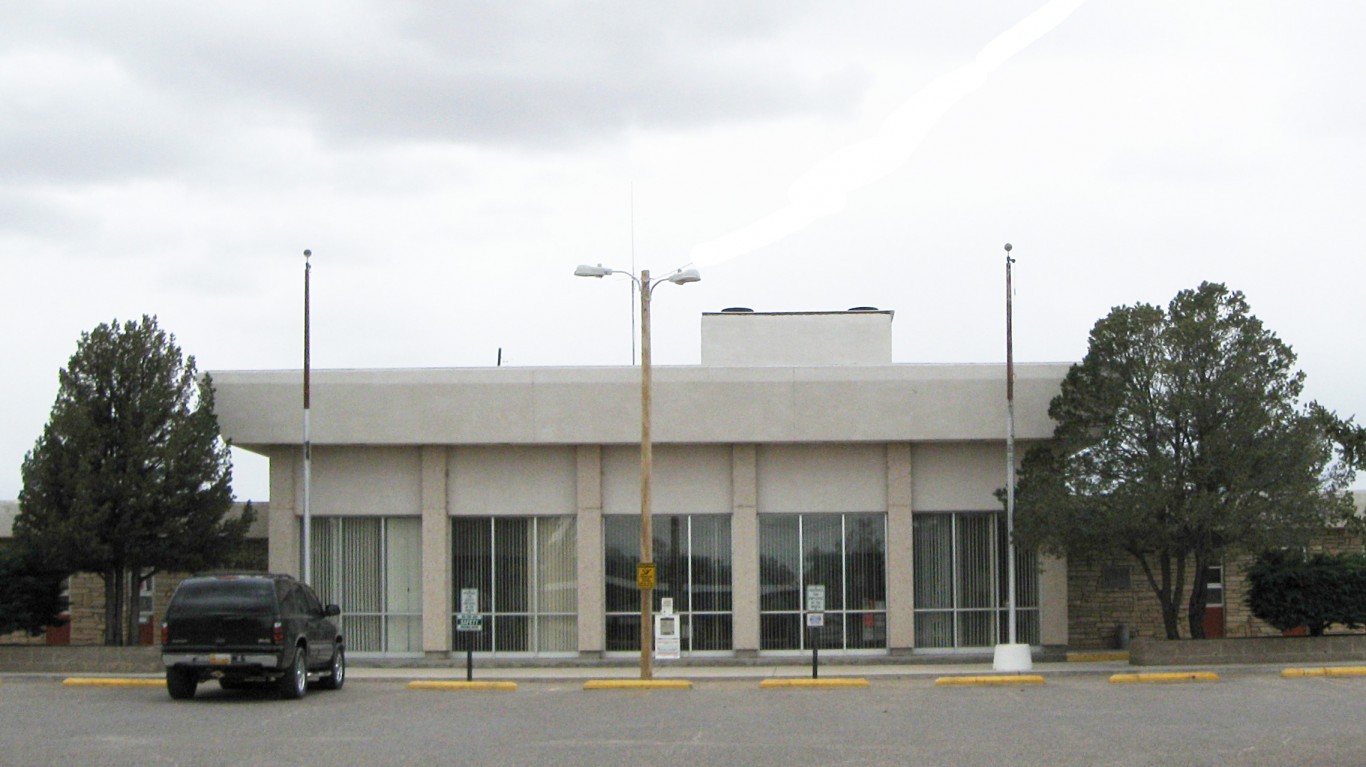
2. Alaska: Aleutians West Census Area
> Primary care physicians per 100,000: 17.5 (county), 88.6 (state)
> Poverty rate: 7.7% (county), 10.1% (state)
> Babies born w/ low birthweight: 8.2% (county), 5.8% (state)
> Population change, 2011-16: +4.1% (county), +5.2% (state)
[recirclink id=444492]
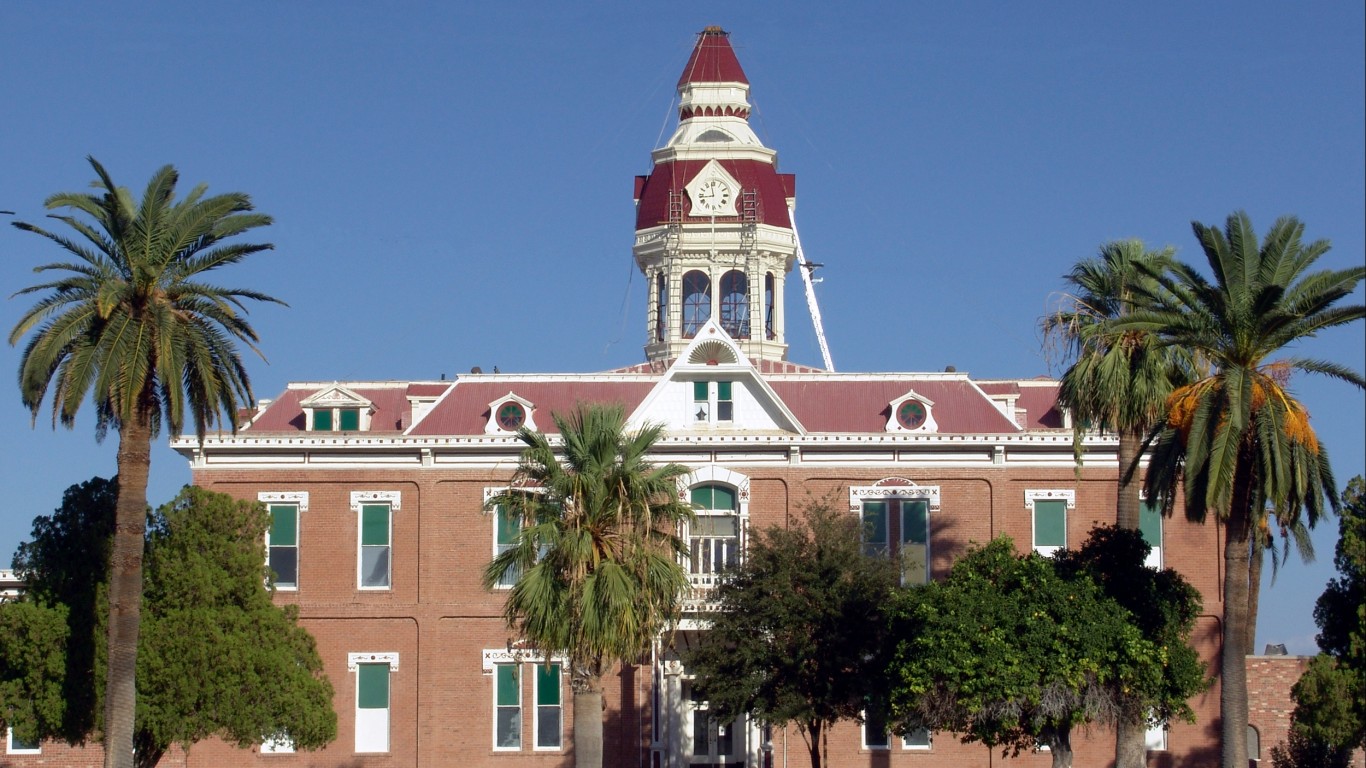
3. Arizona: Pinal County
> Primary care physicians per 100,000: 17.9 (county), 66.8 (state)
> Poverty rate: 16.5% (county), 17.7% (state)
> Babies born w/ low birthweight: 6.9% (county), 7.1% (state)
> Population change, 2011-16: +13.0% (county), +6.2% (state)

4. Arkansas: Izard County
> Primary care physicians per 100,000: 7.4 (county), 65.9 (state)
> Poverty rate: 22.0% (county), 18.8% (state)
> Babies born w/ low birthweight: 7.9% (county), 8.9% (state)
> Population change, 2011-16: -1.0% (county), +2.5% (state)
[in-text-ad-2]

5. California: Imperial County
> Primary care physicians per 100,000: 21.3 (county), 79.0 (state)
> Poverty rate: 24.1% (county), 15.8% (state)
> Babies born w/ low birthweight: 5.5% (county), 6.8% (state)
> Population change, 2011-16: +4.4% (county), +4.6% (state)
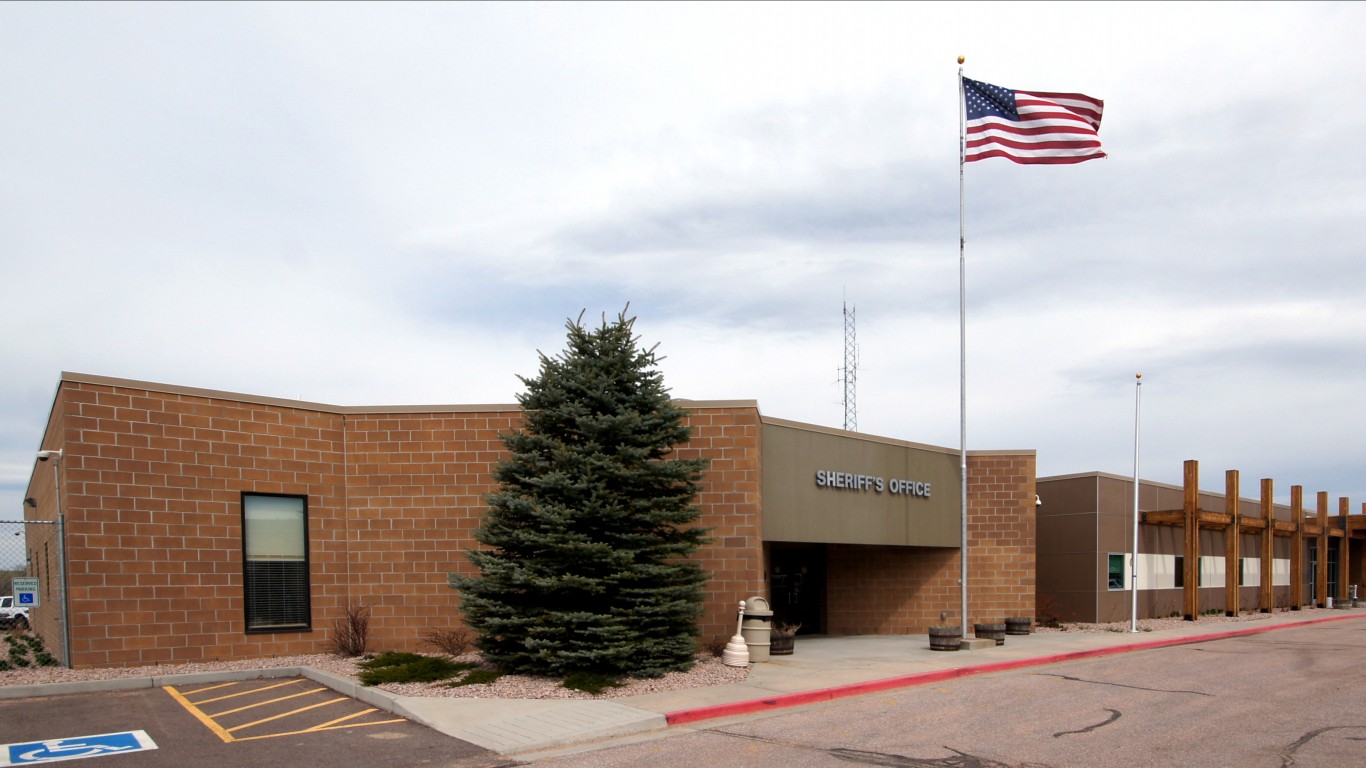
6. Colorado: Elbert County
> Primary care physicians per 100,000: 4.1 (county), 81.9 (state)
> Poverty rate: 5.1% (county), 12.2% (state)
> Babies born w/ low birthweight: 9.1% (county), 8.8% (state)
> Population change, 2011-16: +6.0% (county), +7.9% (state)
[in-text-ad]

7. Connecticut: Windham County
> Primary care physicians per 100,000: 50.4 (county), 84.8 (state)
> Poverty rate: 11.2% (county), 10.4% (state)
> Babies born w/ low birthweight: 7.4% (county), 7.8% (state)
> Population change, 2011-16: -0.8% (county), +0.9% (state)
[recirclink id=444468]

8. Delaware: Kent County
> Primary care physicians per 100,000: 46.1 (county), 72.1 (state)
> Poverty rate: 13.2% (county), 12.0% (state)
> Babies born w/ low birthweight: 8.9% (county), 8.6% (state)
> Population change, 2011-16: +7.2% (county), +4.9% (state)

9. Florida: Madison County
> Primary care physicians per 100,000: 10.8 (county), 73.9 (state)
> Poverty rate: 28.5% (county), 16.1% (state)
> Babies born w/ low birthweight: 12.3% (county), 8.6% (state)
> Population change, 2011-16: -3.7% (county), +6.7% (state)
[in-text-ad-2]

10. Georgia: Oglethorpe County
> Primary care physicians per 100,000: 6.8 (county), 66.6 (state)
> Poverty rate: 17.9% (county), 17.8% (state)
> Babies born w/ low birthweight: 8.1% (county), 9.5% (state)
> Population change, 2011-16: +0.4% (county), +5.2% (state)

11. Hawaii: Kauai County
> Primary care physicians per 100,000: 73.8 (county), 88.4 (state)
> Poverty rate: 9.6% (county), 10.8% (state)
> Babies born w/ low birthweight: 7.4% (county), 8.2% (state)
> Population change, 2011-16: +6.2% (county), +5.0% (state)
[in-text-ad]

12. Idaho: Fremont County
> Primary care physicians per 100,000: 7.8 (county), 65.1 (state)
> Poverty rate: 12.0% (county), 15.2% (state)
> Babies born w/ low birthweight: 7.0% (county), 6.6% (state)
> Population change, 2011-16: -1.8% (county), +5.5% (state)
[recirclink id=444391]

13. Illinois: Johnson County
> Primary care physicians per 100,000: 7.8 (county), 80.7 (state)
> Poverty rate: 12.6% (county), 14.0% (state)
> Babies born w/ low birthweight: 6.1% (county), 8.2% (state)
> Population change, 2011-16: +1.6% (county), +0.5% (state)

14. Indiana: Owen County
> Primary care physicians per 100,000: 4.8 (county), 66.8 (state)
> Poverty rate: 14.8% (county), 15.0% (state)
> Babies born w/ low birthweight: 7.2% (county), 8.0% (state)
> Population change, 2011-16: -2.9% (county), +2.1% (state)
[in-text-ad-2]

15. Iowa: Louisa County
> Primary care physicians per 100,000: 8.9 (county), 73.8 (state)
> Poverty rate: 12.6% (county), 12.3% (state)
> Babies born w/ low birthweight: 6.8% (county), 6.7% (state)
> Population change, 2011-16: -2.8% (county), +2.5% (state)

16. Kansas: Osage County
> Primary care physicians per 100,000: 6.2 (county), 76.1 (state)
> Poverty rate: 11.6% (county), 13.3% (state)
> Babies born w/ low birthweight: 6.2% (county), 7.0% (state)
> Population change, 2011-16: -2.2% (county), +2.4% (state)
[in-text-ad]

17. Kentucky: Casey County
> Primary care physicians per 100,000: 6.3 (county), 66.6 (state)
> Poverty rate: 26.4% (county), 18.8% (state)
> Babies born w/ low birthweight: 9.2% (county), 8.9% (state)
> Population change, 2011-16: -0.1% (county), +2.2% (state)
[recirclink id=444326]

18. Louisiana: Grant Parish
> Primary care physicians per 100,000: 8.9 (county), 65.8 (state)
> Poverty rate: 19.0% (county), 19.7% (state)
> Babies born w/ low birthweight: 8.8% (county), 10.7% (state)
> Population change, 2011-16: +2.2% (county), +3.6% (state)
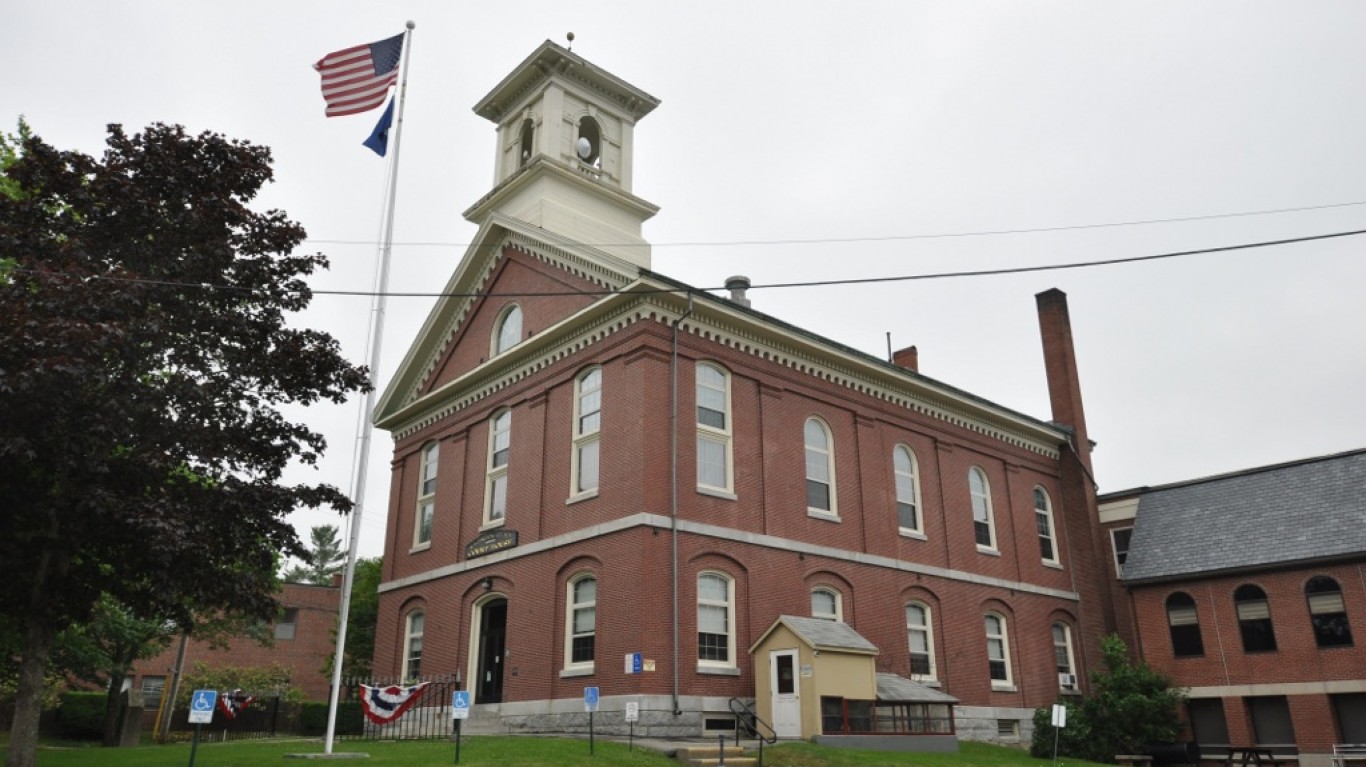
19. Maine: Washington County
> Primary care physicians per 100,000: 56.4 (county), 111.1 (state)
> Poverty rate: 18.0% (county), 13.5% (state)
> Babies born w/ low birthweight: 6.4% (county), 6.9% (state)
> Population change, 2011-16: -3.3% (county), +0.1% (state)
[in-text-ad-2]

20. Maryland: Somerset County
> Primary care physicians per 100,000: 30.9 (county), 88.7 (state)
> Poverty rate: 25.1% (county), 9.9% (state)
> Babies born w/ low birthweight: 8.1% (county), 8.7% (state)
> Population change, 2011-16: -2.1% (county), +3.9% (state)

21. Massachusetts: Bristol County
> Primary care physicians per 100,000: 55.0 (county), 105.7 (state)
> Poverty rate: 12.5% (county), 11.4% (state)
> Babies born w/ low birthweight: 7.9% (county), 7.6% (state)
> Population change, 2011-16: +1.4% (county), +3.5% (state)
[in-text-ad]

22. Michigan: Presque Isle County
> Primary care physicians per 100,000: 7.7 (county), 79.8 (state)
> Poverty rate: 13.5% (county), 16.3% (state)
> Babies born w/ low birthweight: 7.5% (county), 8.4% (state)
> Population change, 2011-16: -4.2% (county), -0.1% (state)
[recirclink id=444046]

23. Minnesota: Le Sueur County
> Primary care physicians per 100,000: 10.8 (county), 90.7 (state)
> Poverty rate: 8.5% (county), 10.8% (state)
> Babies born w/ low birthweight: 5.6% (county), 6.5% (state)
> Population change, 2011-16: -0.4% (county), +3.3% (state)

24. Mississippi: Smith County
> Primary care physicians per 100,000: 6.2 (county), 53.2 (state)
> Poverty rate: 22.7% (county), 22.3% (state)
> Babies born w/ low birthweight: 10.4% (county), 11.6% (state)
> Population change, 2011-16: -1.9% (county), +1.1% (state)
[in-text-ad-2]

25. Missouri: Crawford County
> Primary care physicians per 100,000: 4.1 (county), 70.8 (state)
> Poverty rate: 21.4% (county), 15.3% (state)
> Babies born w/ low birthweight: 8.2% (county), 8.2% (state)
> Population change, 2011-16: -0.7% (county), +1.7% (state)

26. Montana: Teton County
> Primary care physicians per 100,000: 16.5 (county), 77.2 (state)
> Poverty rate: 10.6% (county), 14.9% (state)
> Babies born w/ low birthweight: 7.6% (county), 7.4% (state)
> Population change, 2011-16: -0.6% (county), +4.1% (state)
[in-text-ad]

27. Nebraska: Dakota County
> Primary care physicians per 100,000: 4.8 (county), 75.3 (state)
> Poverty rate: 16.0% (county), 12.4% (state)
> Babies born w/ low birthweight: 5.9% (county), 6.8% (state)
> Population change, 2011-16: -0.5% (county), +3.8% (state)
[recirclink id=443940]

28. Nevada: Lyon County
> Primary care physicians per 100,000: 17.3 (county), 57.7 (state)
> Poverty rate: 15.3% (county), 14.9% (state)
> Babies born w/ low birthweight: 8.2% (county), 8.3% (state)
> Population change, 2011-16: -0.1% (county), +6.2% (state)

29. New Hampshire: Strafford County
> Primary care physicians per 100,000: 69.1 (county), 91.3 (state)
> Poverty rate: 10.1% (county), 8.5% (state)
> Babies born w/ low birthweight: 6.7% (county), 6.9% (state)
> Population change, 2011-16: +2.5% (county), +0.9% (state)
[in-text-ad-2]
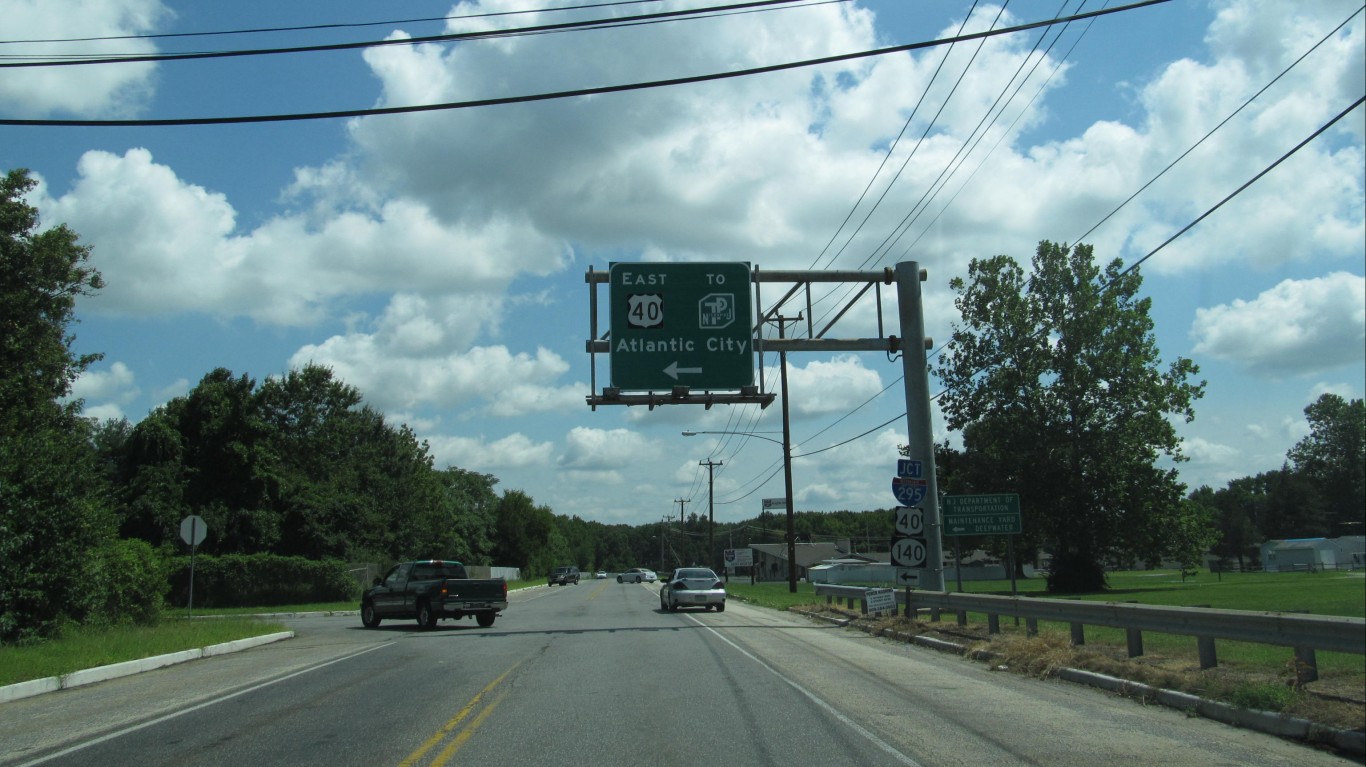
30. New Jersey: Salem County
> Primary care physicians per 100,000: 37.2 (county), 84.8 (state)
> Poverty rate: 13.8% (county), 10.9% (state)
> Babies born w/ low birthweight: 7.8% (county), 8.2% (state)
> Population change, 2011-16: -2.2% (county), +1.9% (state)
31. New Mexico: Torrance County
> Primary care physicians per 100,000: 6.4 (county), 75.6 (state)
> Poverty rate: 31.1% (county), 20.9% (state)
> Babies born w/ low birthweight: 10.1% (county), 8.8% (state)
> Population change, 2011-16: -4.8% (county), +2.2% (state)
[in-text-ad]

32. New York: Orleans County
> Primary care physicians per 100,000: 7.2 (county), 83.6 (state)
> Poverty rate: 15.6% (county), 15.5% (state)
> Babies born w/ low birthweight: 7.0% (county), 8.0% (state)
> Population change, 2011-16: -2.5% (county), +2.0% (state)
[recirclink id=443564]

33. North Carolina: Northampton County
> Primary care physicians per 100,000: 9.7 (county), 71.3 (state)
> Poverty rate: 28.5% (county), 16.8% (state)
> Babies born w/ low birthweight: 11.7% (county), 9.0% (state)
> Population change, 2011-16: -6.7% (county), +5.5% (state)
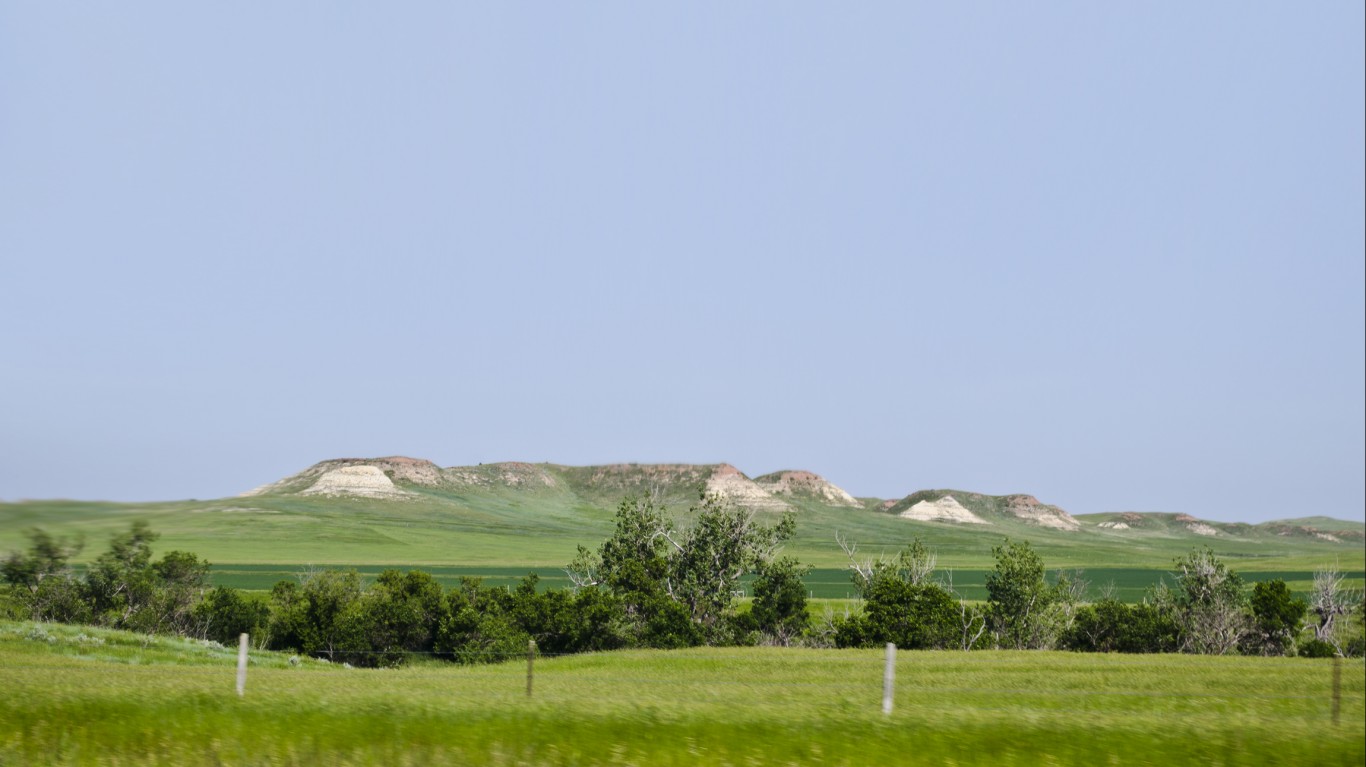
34. North Dakota: McKenzie County
> Primary care physicians per 100,000: 9.3 (county), 77.2 (state)
> Poverty rate: 12.8% (county), 11.2% (state)
> Babies born w/ low birthweight: 6.0% (county), 6.4% (state)
> Population change, 2011-16: +71.2% (county), +10.4% (state)
[in-text-ad-2]

35. Ohio: Morgan County
> Primary care physicians per 100,000: 6.7 (county), 76.7 (state)
> Poverty rate: 20.3% (county), 15.4% (state)
> Babies born w/ low birthweight: 8.8% (county), 8.6% (state)
> Population change, 2011-16: -1.5% (county), +0.5% (state)
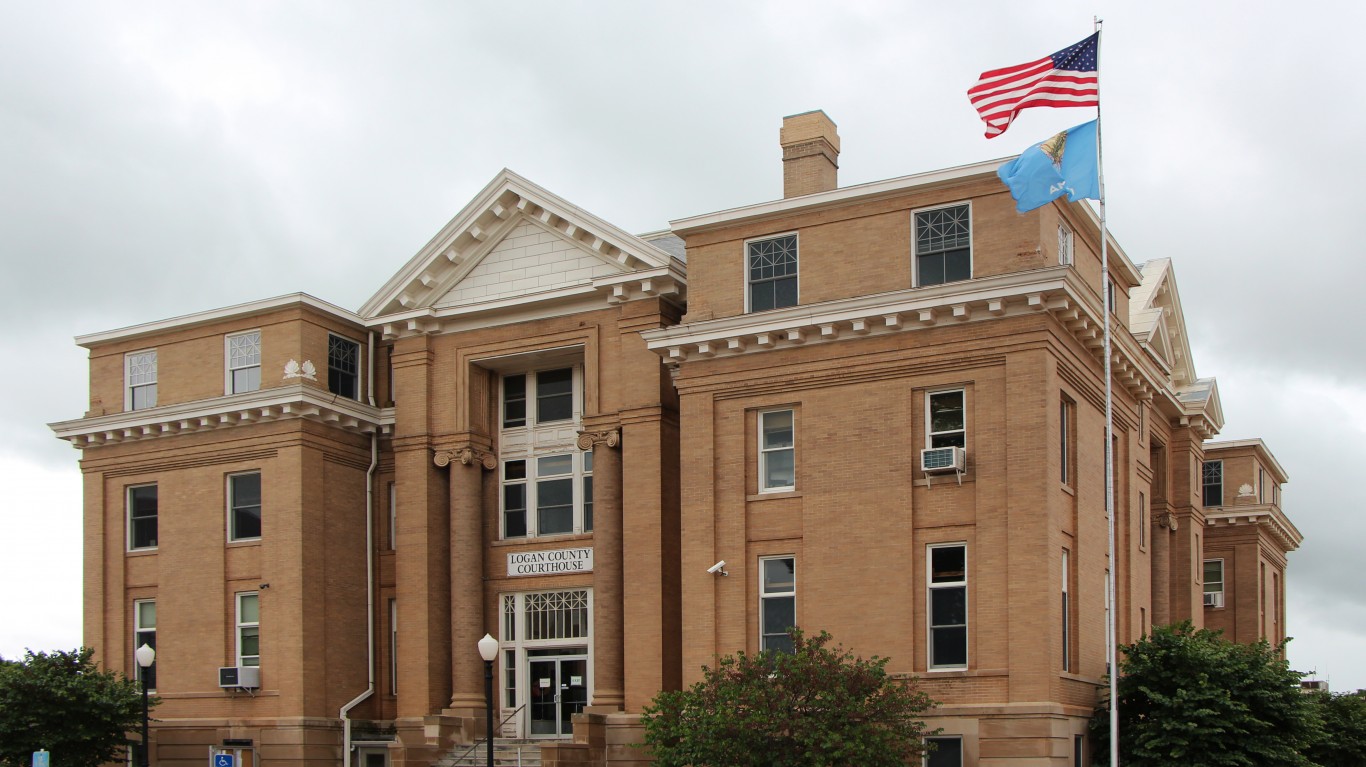
36. Oklahoma: Logan County
> Primary care physicians per 100,000: 2.2 (county), 63.6 (state)
> Poverty rate: 12.3% (county), 16.5% (state)
> Babies born w/ low birthweight: 7.0% (county), 8.1% (state)
> Population change, 2011-16: +10.5% (county), +4.3% (state)
[in-text-ad]

37. Oregon: Malheur County
> Primary care physicians per 100,000: 29.5 (county), 94.6 (state)
> Poverty rate: 24.8% (county), 15.7% (state)
> Babies born w/ low birthweight: 6.7% (county), 6.3% (state)
> Population change, 2011-16: -2.6% (county), +4.7% (state)
[recirclink id=443882]

38. Pennsylvania: Sullivan County
> Primary care physicians per 100,000: 15.9 (county), 81.3 (state)
> Poverty rate: 12.0% (county), 13.3% (state)
> Babies born w/ low birthweight: 6.7% (county), 8.2% (state)
> Population change, 2011-16: -2.6% (county), +1.0% (state)

39. Rhode Island: Kent County
> Primary care physicians per 100,000: 80.1 (county), 96.0 (state)
> Poverty rate: 8.2% (county), 13.8% (state)
> Babies born w/ low birthweight: 6.9% (county), 7.5% (state)
> Population change, 2011-16: -1.0% (county), +0.1% (state)
[in-text-ad-2]

40. South Carolina: Williamsburg County
> Primary care physicians per 100,000: 9.1 (county), 68.3 (state)
> Poverty rate: 29.3% (county), 17.2% (state)
> Babies born w/ low birthweight: 13.4% (county), 9.6% (state)
> Population change, 2011-16: -5.5% (county), +5.7% (state)

41. South Dakota: Todd County
> Primary care physicians per 100,000: 10.0 (county), 78.0 (state)
> Poverty rate: 47.1% (county), 14.0% (state)
> Babies born w/ low birthweight: 7.4% (county), 6.4% (state)
> Population change, 2011-16: +3.9% (county), +5.4% (state)
[in-text-ad]

42. Tennessee: Crockett County
> Primary care physicians per 100,000: 6.9 (county), 72.9 (state)
> Poverty rate: 18.3% (county), 17.2% (state)
> Babies born w/ low birthweight: 7.3% (county), 9.1% (state)
> Population change, 2011-16: +0.1% (county), +4.0% (state)
[recirclink id=443620]

43. Texas: Leon County
> Primary care physicians per 100,000: 5.9 (county), 61.0 (state)
> Poverty rate: 16.0% (county), 16.7% (state)
> Babies born w/ low birthweight: 8.2% (county), 8.3% (state)
> Population change, 2011-16: +1.0% (county), +8.8% (state)

44. Utah: Emery County
> Primary care physicians per 100,000: 18.9 (county), 58.3 (state)
> Poverty rate: 12.0% (county), 11.7% (state)
> Babies born w/ low birthweight: 8.1% (county), 7.0% (state)
> Population change, 2011-16: -2.4% (county), +8.6% (state)
[in-text-ad-2]

45. Vermont: Essex County
> Primary care physicians per 100,000: 32.4 (county), 112.4 (state)
> Poverty rate: 14.8% (county), 11.6% (state)
> Babies born w/ low birthweight: 6.0% (county), 6.6% (state)
> Population change, 2011-16: -2.8% (county), +0.2% (state)

46. Virginia: Pittsylvania County
> Primary care physicians per 100,000: 6.4 (county), 76.6 (state)
> Poverty rate: 15.1% (county), 11.4% (state)
> Babies born w/ low birthweight: 7.7% (county), 8.0% (state)
> Population change, 2011-16: -1.3% (county), +4.8% (state)
[in-text-ad]

47. Washington: Pacific County
> Primary care physicians per 100,000: 24.1 (county), 84.3 (state)
> Poverty rate: 18.7% (county), 12.7% (state)
> Babies born w/ low birthweight: 7.5% (county), 6.3% (state)
> Population change, 2011-16: -1.8% (county), +6.3% (state)
[recirclink id=443575]

48. West Virginia: Wirt County
> Primary care physicians per 100,000: 17.2 (county), 78.5 (state)
> Poverty rate: 15.2% (county), 17.7% (state)
> Babies born w/ low birthweight: 8.3% (county), 9.4% (state)
> Population change, 2011-16: +1.3% (county), -0.0% (state)

49. Wisconsin: Adams County
> Primary care physicians per 100,000: 4.9 (county), 80.4 (state)
> Poverty rate: 12.7% (county), 12.7% (state)
> Babies born w/ low birthweight: 7.4% (county), 7.2% (state)
> Population change, 2011-16: -3.2% (county), +1.6% (state)
[in-text-ad-2]

50. Wyoming: Big Horn County
> Primary care physicians per 100,000: 16.8 (county), 67.1 (state)
> Poverty rate: 11.9% (county), 11.6% (state)
> Babies born w/ low birthweight: 7.8% (county), 8.6% (state)
> Population change, 2011-16: +3.3% (county), +5.1% (state)
Detailed Findings
All of these counties are sparsely populated, rural areas. According to the nonprofit National Rural Health Association, while 19.3% of the U.S. population lives in rural areas, just 11.4% of U.S. physicians practice in rural settings. Of 50 of the counties on this list, 46 have a larger share of the population living in rural households than the nation as a whole, and 18 are classified as 100% rural.
There are multiple factors that contribute to the lack of doctors in rural areas. These communities often struggle to attract and retain well-trained health care professionals. Physician salaries are typically lower in rural areas, and certain lifestyle considerations may lead many doctors to choose to practice in urban communities over rural ones.
“Our training systems are biased towards cities and big urban centers,” said Dr. Vikas Saini, president of the Lown Institute, a think tank dedicated to transforming the U.S. health care system, in an interview with 24/7 Wall St.
Many of the counties with the fewest doctors per capita have difficulty attracting and retaining residents overall. In 41 of the 50 counties on this list, the populations either declined over the last five years or grew slower than the 3.9% national growth rate. The vacancy rate, an indication of housing desirability, is greater than the 12.2% national figure in 40 of the 50 counties.
Education also plays a major role in the physician workforce. Rural areas with lower quality schools and lower educational attainment rates are either less likely to attract medical students or lack nearby educational institutions to train physicians locally.
“Where people train tend to be where people practice,” Dr. Saini said. And rural communities without major training programs are less likely to attract medical professionals to the area. In 47 of the 50 schools on this list, the share of adults with a bachelor’s degree is smaller than the 30.3% national figure.
The negative health consequences of doctor shortages are also exacerbated in rural areas. Rural residents tend to be poorer and older, and they are more likely to rely on Supplemental Nutrition Assistance Program (SNAP) benefits. They have greater transportation difficulties reaching health care providers too, and are more likely to smoke, less likely to have health insurance, and are less healthy overall. Overburdened by health problems and underserved by health workers, Americans living in rural areas are more likely to face negative health consequences than their urban counterparts.
Many of these counties have been classified as Health Professional Shortage Areas by the Health Resources & Services Administration. In addition to the population-to-doctor ratio, the HRSA takes into account the levels of poverty, infant mortality, low birthweight, and distance to the nearest source of care in order to determine whether a community has a shortage of primary care services. The HPSA program identifies areas in which residents are more likely to suffer negative health consequences as a result of physician shortages, and make certain areas eligible for federal resources that combat health workforce shortages. In 34 of the 50 counties on this list, either the low-income population within a county or the entire county itself was designated as a HPSA.
While there are programs designed to increase patient access to health care in rural areas, the number of doctors per capita is just one small piece of the health care puzzle. The urban-rural health disparity is a systemic problem, and the physician shortage is just one of many factors contributing to negative health consequences in rural America.
“By most estimates of life expectancy and mortality over the last hundred years, health care contributes only 15% — some say 10% some say 20% — to overall longevity,” Dr. Saini said.
Methodology
To determine the counties in every state where there are no doctors, 24/7 Wall St. analyzed data on primary care physicians per capita from County Health Rankings & Roadmaps, a collaboration between the Robert Wood Johnson Foundation and the University of Wisconsin Population Health Institute. Data on low birthweight also came from County Health Rankings & Roadmaps. Data on the share of the population living in a rural area came from the U.S. Census Bureau’s 2010 Decennial Census. Data on poverty came from the Census Bureau’s American Community Survey and is a five-year average over the period 2011 to 2016. Only counties with at least 3,500 residents were considered.
Contact [email protected] for any questions or corrections.