
Late last year the National Center for Health Statistics reported that U.S. life expectancy fell for the second year in a row. Americans born in 2016 can expect to live 78.6 years. Life expectancy is one of the main measures of a population’s overall health, so the declines are concerning.
Still, life expectancy varies significantly across the United States. Different aspects, from socioeconomic factors to climate to culture and behaviors, can affect life expectancy in an area. And there are some parts of the country where the average resident can expect to live several years longer than the average American.
To determine the counties where people live the longest, 24/7 Wall St. reviewed 2014 county-level life expectancy at birth figures from the Institute for Health Metrics and Evaluation, a global research center affiliated with the University of Washington.
While nearly all states might have counties where life expectancy is longer than the national average, only about half of all states have at least one county where life expectancy is significantly longer.
The majority of the 50 counties with the highest life expectancy are located in healthy states like California, Minnesota, and New York. Colorado, which has one of the healthier populations, is home to 10 of the longest lived counties.
Still, in less healthy states, there are counties that are outliers. States like Michigan, Nevada, and New Mexico, where the average resident can expect to live a shorter life than the average American, are each home to one county where people live years longer than the average state resident and American.
Residents of counties with longer life expectancy tend to exhibit the kind of healthy behaviors that lead to longer lives. Relatively fewer adults in these counties smoke or are obese, and more tend to be physically active. Many of these counties also are quite affluent — one of the factors most clearly associated with good health.
Click here to see the counties where people live the longest.

50. Ozaukee County, Wisconsin
> Life expectancy: 82.13
> County seat: Port Washington
> Change in life expectancy, 1980-2014: +7.1%
> Poverty: 5.5%
> Adult obesity: 25.6%
[in-text-ad]

49. Storey County, Nevada
> Life expectancy: 82.13
> County seat: Virginia City
> Change in life expectancy, 1980-2014: +7.6%
> Poverty: 7.2%
> Adult obesity: 26.2%
[recirclink id=488456]

48. Bremer County, Iowa
> Life expectancy: 82.14
> County seat: Waverly
> Change in life expectancy, 1980-2014: +6.6%
> Poverty: 7.3%
> Adult obesity: 33.2%
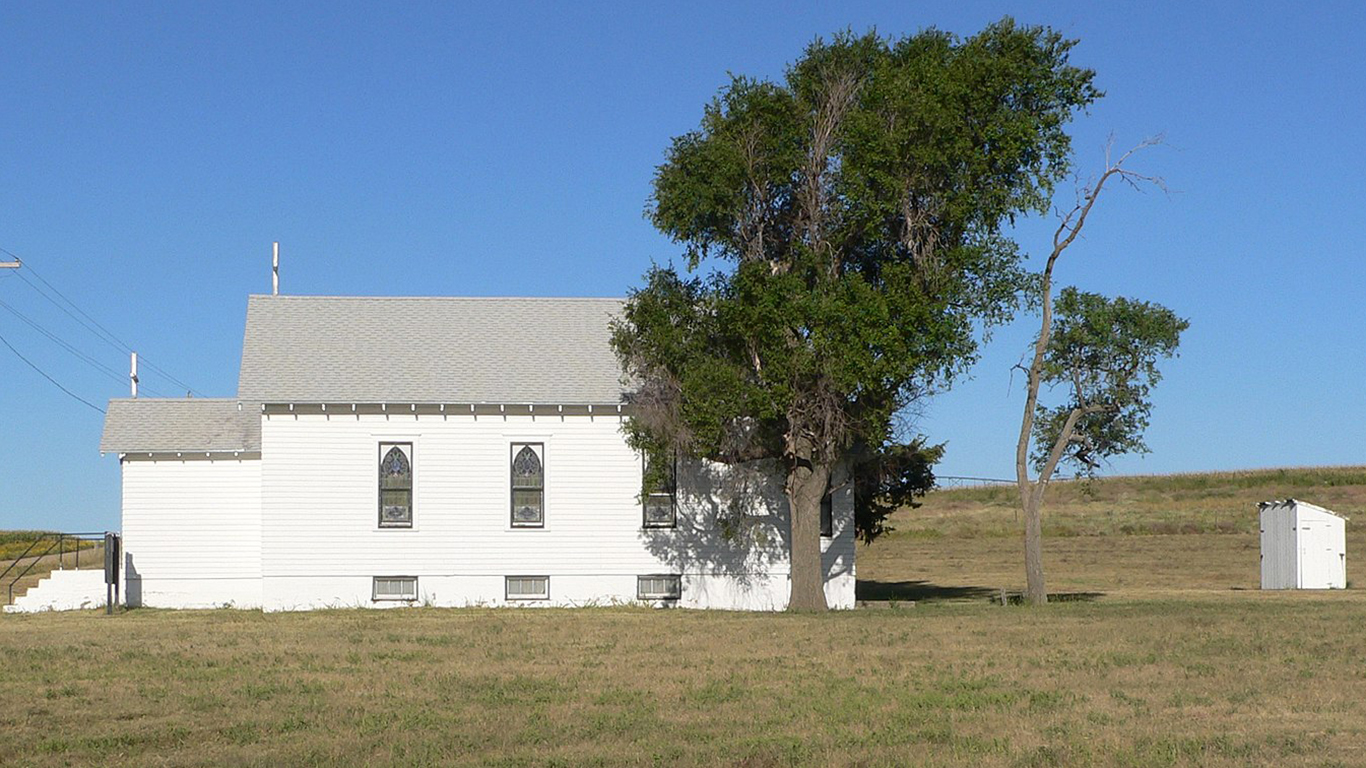
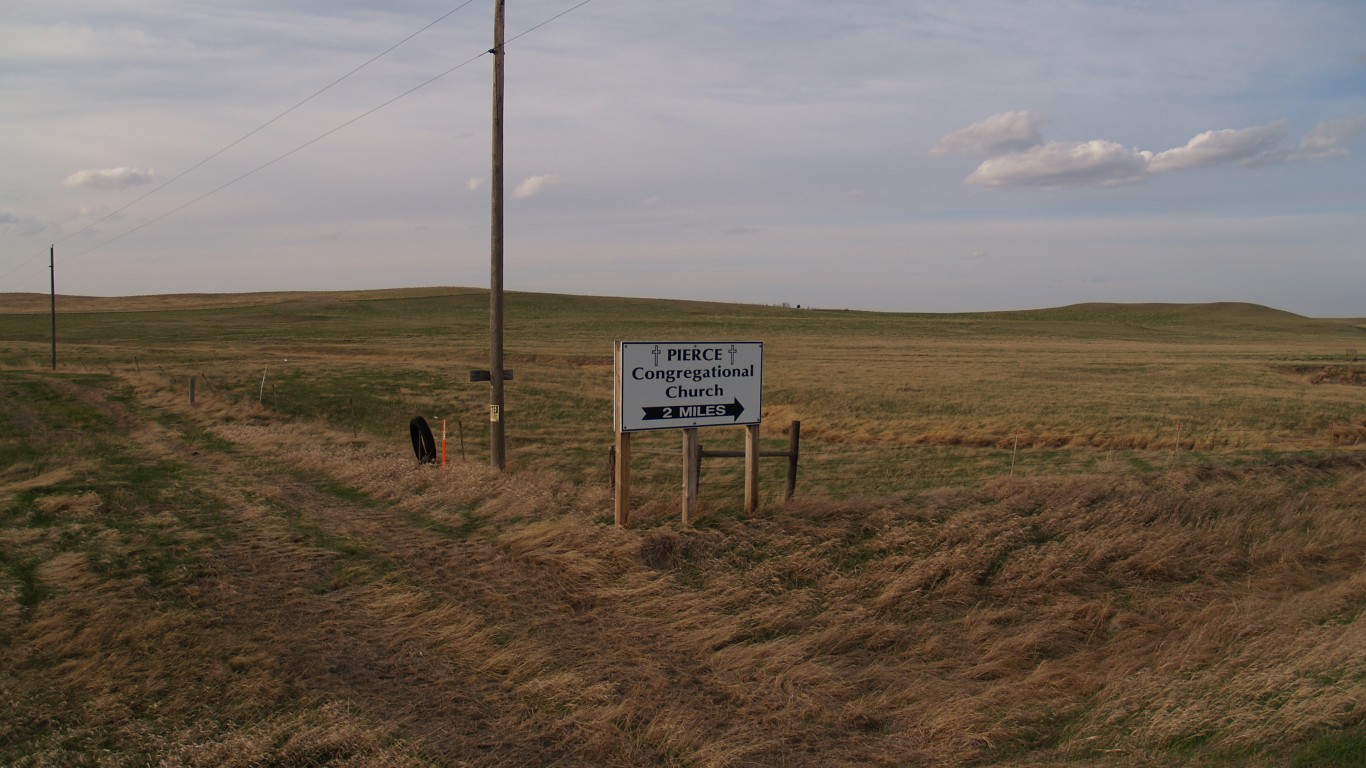
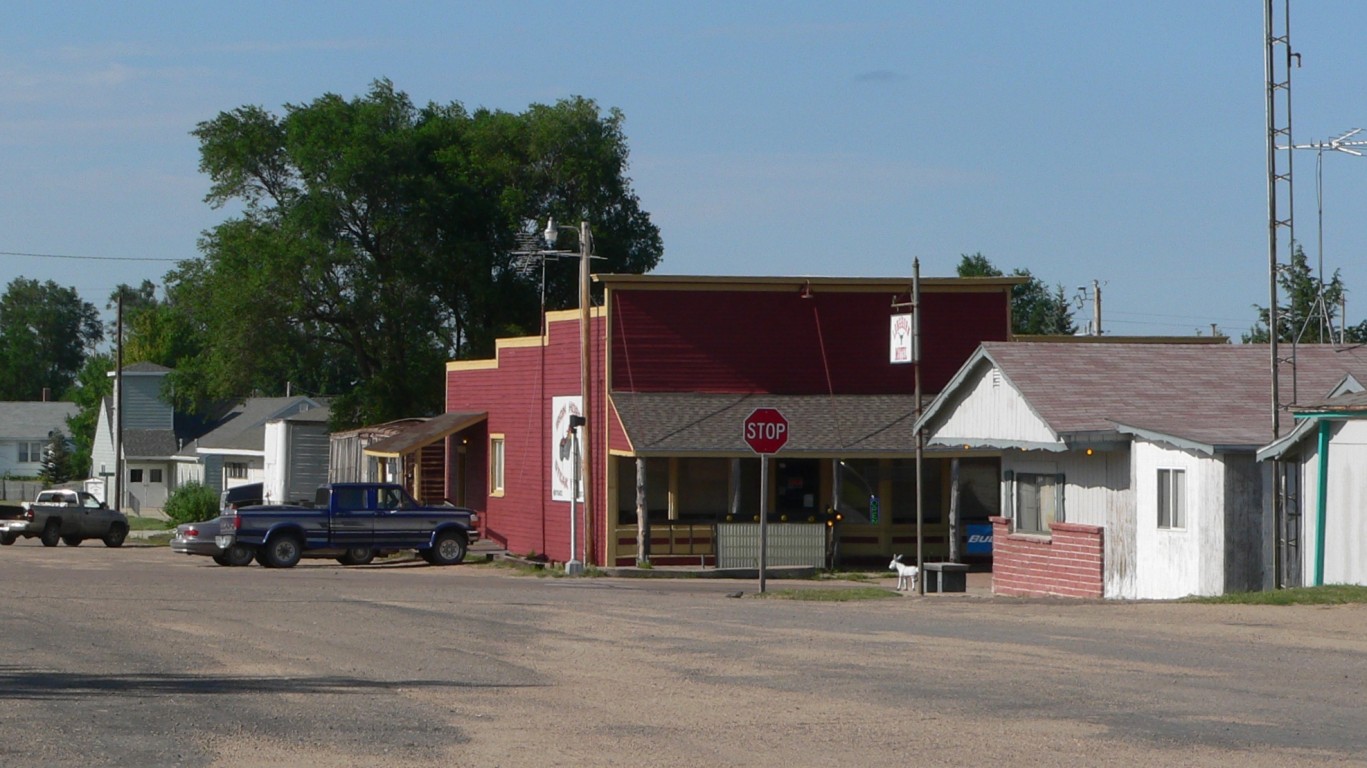
47. Hayes County, Nebraska
> Life expectancy: 82.14
> County seat: Hayes Center
> Change in life expectancy, 1980-2014: +6.2%
> Poverty: 7.9%
> Adult obesity: 34.6%
[in-text-ad-2]

46. Oliver County, North Dakota
> Life expectancy: 82.19
> County seat: Center
> Change in life expectancy, 1980-2014: +6.3%
> Poverty: 4.1%
> Adult obesity: 33.3%

45. Nassau County, New York
> Life expectancy: 82.21
> County seat: Mineola
> Change in life expectancy, 1980-2014: +10.6%
> Poverty: 6.0%
> Adult obesity: 23.0%
[in-text-ad]

44. Stevens County, Minnesota
> Life expectancy: 82.22
> County seat: Morris
> Change in life expectancy, 1980-2014: +7.2%
> Poverty: 17.4%
> Adult obesity: 32.7%
[recirclink id=488594]

43. Olmsted County, Minnesota
> Life expectancy: 82.24
> County seat: Rochester
> Change in life expectancy, 1980-2014: +6.2%
> Poverty: 9.2%
> Adult obesity: 27.0%

42. Orange County, California
> Life expectancy: 82.27
> County seat: Santa Ana
> Change in life expectancy, 1980-2014: +8.0%
> Poverty: 12.5%
> Adult obesity: 19.2%
[in-text-ad-2]

41. Westchester County, New York
> Life expectancy: 82.29
> County seat: White Plains
> Change in life expectancy, 1980-2014: +9.6%
> Poverty: 9.8%
> Adult obesity: 20.8%
40. Slope County, North Dakota
> Life expectancy: 82.36
> County seat: Amidon
> Change in life expectancy, 1980-2014: +6.6%
> Poverty: 10.1%
> Adult obesity: 27.8%
[in-text-ad]

39. Park County, Colorado
> Life expectancy: 82.37
> County seat: Fairplay
> Change in life expectancy, 1980-2014: +9.0%
> Poverty: 6.3%
> Adult obesity: 19.3%
[recirclink id=488561]

38. Summit County, Utah
> Life expectancy: 82.39
> County seat: Coalville
> Change in life expectancy, 1980-2014: +7.6%
> Poverty: 7.9%
> Adult obesity: 14.6%
37. McPherson County, Nebraska
> Life expectancy: 82.41
> County seat: Tryon
> Change in life expectancy, 1980-2014: +7.8%
> Poverty: 18.4%
> Adult obesity: 32.0%
[in-text-ad-2]

36. Sheridan County, North Dakota
> Life expectancy: 82.44
> County seat: McClusky
> Change in life expectancy, 1980-2014: +6.3%
> Poverty: 16.9%
> Adult obesity: 33.7%

35. Hunterdon County, New Jersey
> Life expectancy: 82.45
> County seat: Flemington
> Change in life expectancy, 1980-2014: +8.9%
> Poverty: 4.5%
> Adult obesity: 21.4%
[in-text-ad]

34. Bergen County, New Jersey
> Life expectancy: 82.47
> County seat: Hackensack
> Change in life expectancy, 1980-2014: +9.6%
> Poverty: 7.5%
> Adult obesity: 22.1%
[recirclink id=488514]

33. Rockland County, New York
> Life expectancy: 82.54
> County seat: New City
> Change in life expectancy, 1980-2014: +10.5%
> Poverty: 14.5%
> Adult obesity: 23.5%

32. Sioux County, Nebraska
> Life expectancy: 82.57
> County seat: Harrison
> Change in life expectancy, 1980-2014: +8.1%
> Poverty: 11.0%
> Adult obesity: 27.6%
[in-text-ad-2]
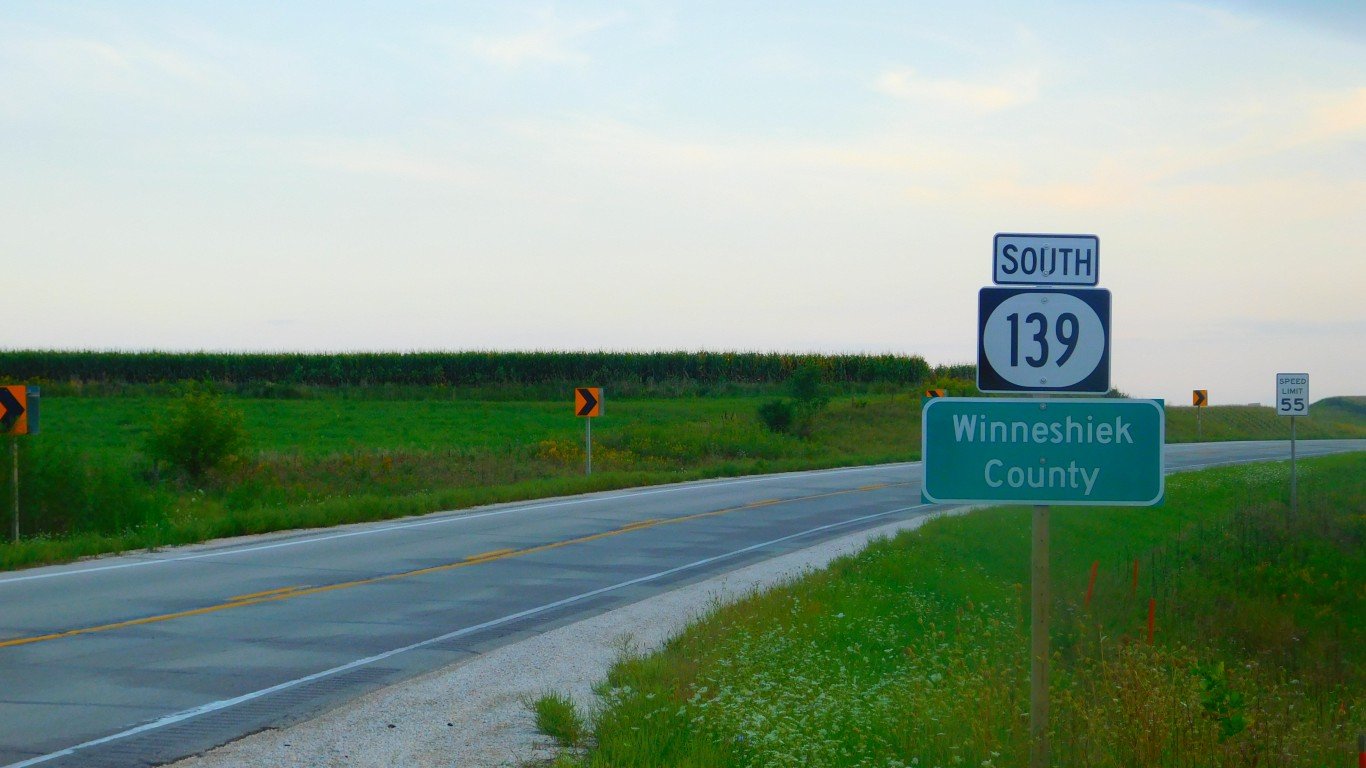
31. Winneshiek County, Iowa
> Life expectancy: 82.62
> County seat: Decorah
> Change in life expectancy, 1980-2014: +7.0%
> Poverty: 8.0%
> Adult obesity: 29.1%
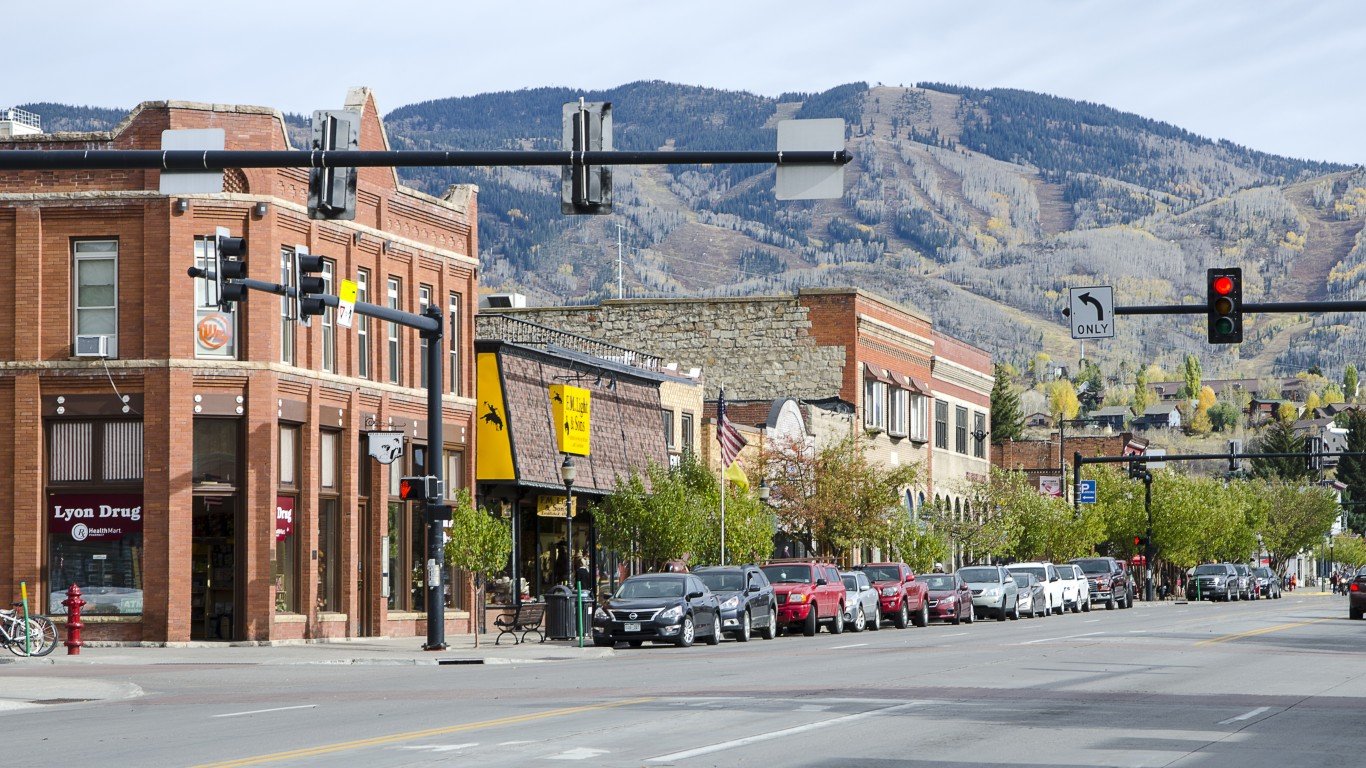
30. Routt County, Colorado
> Life expectancy: 82.73
> County seat: Steamboat Springs
> Change in life expectancy, 1980-2014: +9.0%
> Poverty: 10.2%
> Adult obesity: 13.6%
[in-text-ad]

29. Grand County, Colorado
> Life expectancy: 82.73
> County seat: Hot Sulphur Springs
> Change in life expectancy, 1980-2014: +9.4%
> Poverty: 10.6%
> Adult obesity: 16.9%
[recirclink id=488498]

28. Arlington County, Virginia
> Life expectancy: 82.76
> County seat: Arlington
> Change in life expectancy, 1980-2014: +8.9%
> Poverty: 8.7%
> Adult obesity: 18.3%

27. Carver County, Minnesota
> Life expectancy: 82.80
> County seat: Chaska
> Change in life expectancy, 1980-2014: +8.0%
> Poverty: 4.1%
> Adult obesity: 22.3%
[in-text-ad-2]

26. Wayne County, Nebraska
> Life expectancy: 82.82
> County seat: Wayne
> Change in life expectancy, 1980-2014: +6.7%
> Poverty: 12.1%
> Adult obesity: 32.1%
25. Sioux County, Iowa
> Life expectancy: 82.86
> County seat: Orange City
> Change in life expectancy, 1980-2014: +6.0%
> Poverty: 7.6%
> Adult obesity: 28.5%
[in-text-ad]

24. Mono County, California
> Life expectancy: 82.96
> County seat: Bridgeport
> Change in life expectancy, 1980-2014: +9.1%
> Poverty: 8.8%
> Adult obesity: 22.8%
[recirclink id=488094]

23. Howard County, Maryland
> Life expectancy: 82.98
> County seat: Ellicott City
> Change in life expectancy, 1980-2014: +10.4%
> Poverty: 4.9%
> Adult obesity: 22.7%

22. Blaine County, Idaho
> Life expectancy: 82.99
> County seat: Hailey
> Change in life expectancy, 1980-2014: +8.0%
> Poverty: 12.7%
> Adult obesity: 18.3%
[in-text-ad-2]

21. Ouray County, Colorado
> Life expectancy: 83.00
> County seat: Ouray
> Change in life expectancy, 1980-2014: +8.5%
> Poverty: 9.2%
> Adult obesity: 18.4%
20. Lincoln County, South Dakota
> Life expectancy: 83.03
> County seat: Canton
> Change in life expectancy, 1980-2014: +7.5%
> Poverty: 3.7%
> Adult obesity: 29.2%
[in-text-ad]

19. Leelanau County, Michigan
> Life expectancy: 83.10
> County seat: Leland
> Change in life expectancy, 1980-2014: +9.4%
> Poverty: 8.7%
> Adult obesity: 29.1%
[recirclink id=488247]

18. San Mateo County, California
> Life expectancy: 83.11
> County seat: Redwood City
> Change in life expectancy, 1980-2014: +9.8%
> Poverty: 7.7%
> Adult obesity: 18.7%

17. Santa Clara County, California
> Life expectancy: 83.14
> County seat: San Jose
> Change in life expectancy, 1980-2014: +9.7%
> Poverty: 9.3%
> Adult obesity: 19.7%
[in-text-ad-2]

16. Loudoun County, Virginia
> Life expectancy: 83.19
> County seat: Leesburg
> Change in life expectancy, 1980-2014: +12.5%
> Poverty: 4.0%
> Adult obesity: 21.5%

15. Collier County, Florida
> Life expectancy: 83.43%
> County seat: Naples
> Change in life expectancy, 1980-2014: +12.0%
> Poverty: 13.2%
> Adult obesity: 20.3%
[in-text-ad]

14. Teton County, Wyoming
> Life expectancy: 83.46
> County seat: Jackson
> Change in life expectancy, 1980-2014: +9.3%
> Poverty: 7.3%
> Adult obesity: 13.3%
[recirclink id=488174]

13. Los Alamos County, New Mexico
> Life expectancy: 83.49
> County seat: Los Alamos
> Change in life expectancy, 1980-2014: +7.4%
> Poverty: 5.1%
> Adult obesity: 20.4%

12. Hinsdale County, Colorado
> Life expectancy: 83.66
> County seat: Lake City
> Change in life expectancy, 1980-2014: +9.0%
> Poverty: 11.2%
> Adult obesity: 19.9%
[in-text-ad-2]

11. San Juan County, Washington
> Life expectancy: 83.70
> County seat: Friday Harbor
> Change in life expectancy, 1980-2014: +8.1%
> Poverty: 11.1%
> Adult obesity: 20.4%
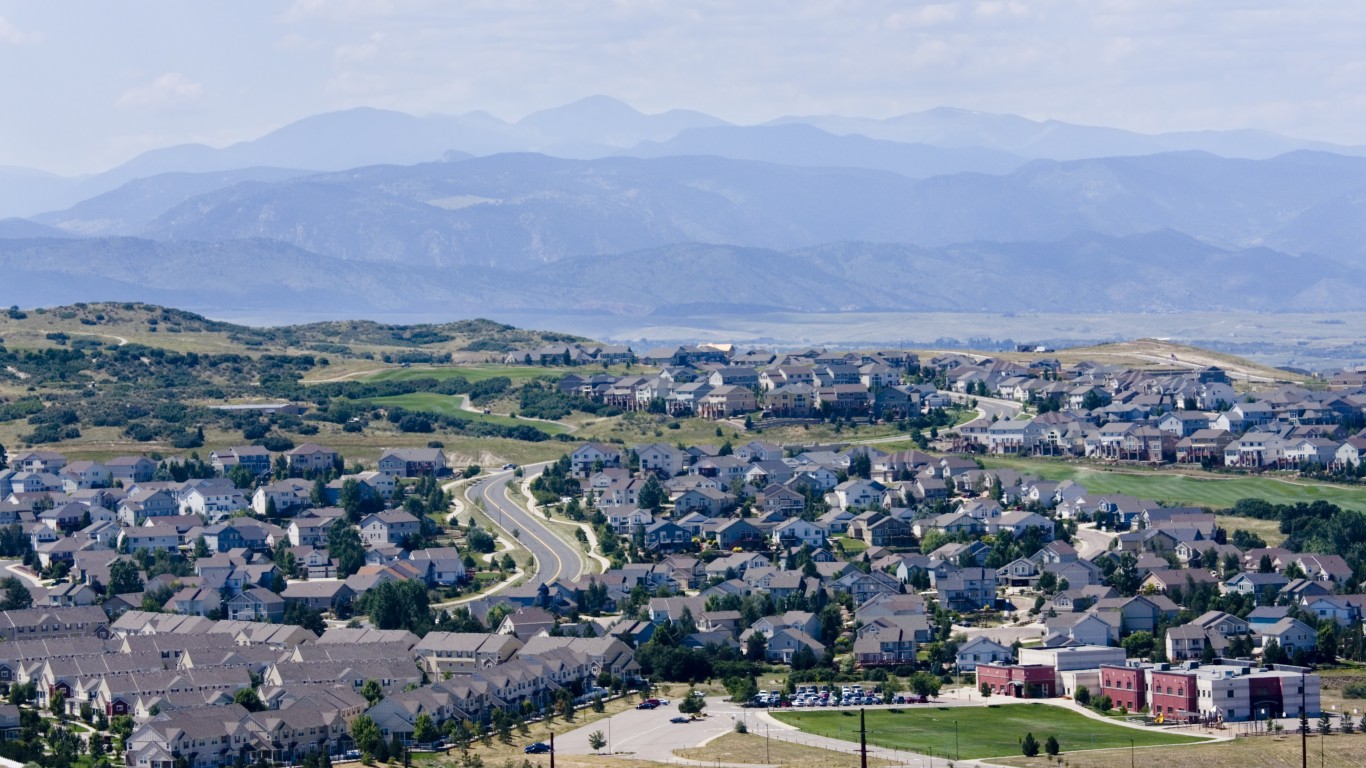
10. Douglas County, Colorado
> Life expectancy: 83.72
> County seat: Castle Rock
> Change in life expectancy, 1980-2014: +8.9%
> Poverty: 3.8%
> Adult obesity: 17.5%
[in-text-ad]

9. Presidio County, Texas
> Life expectancy: 83.72
> County seat: Marfa
> Change in life expectancy, 1980-2014: +11.2%
> Poverty: 24.5%
> Adult obesity: 26.5%
[recirclink id=487977]

8. Fairfax County, Virginia
> Life expectancy: 83.73
> County seat: Herndon
> Change in life expectancy, 1980-2014: +9.2%
> Poverty: 6.0%
> Adult obesity: 23.5%
[in-text-ad-2]
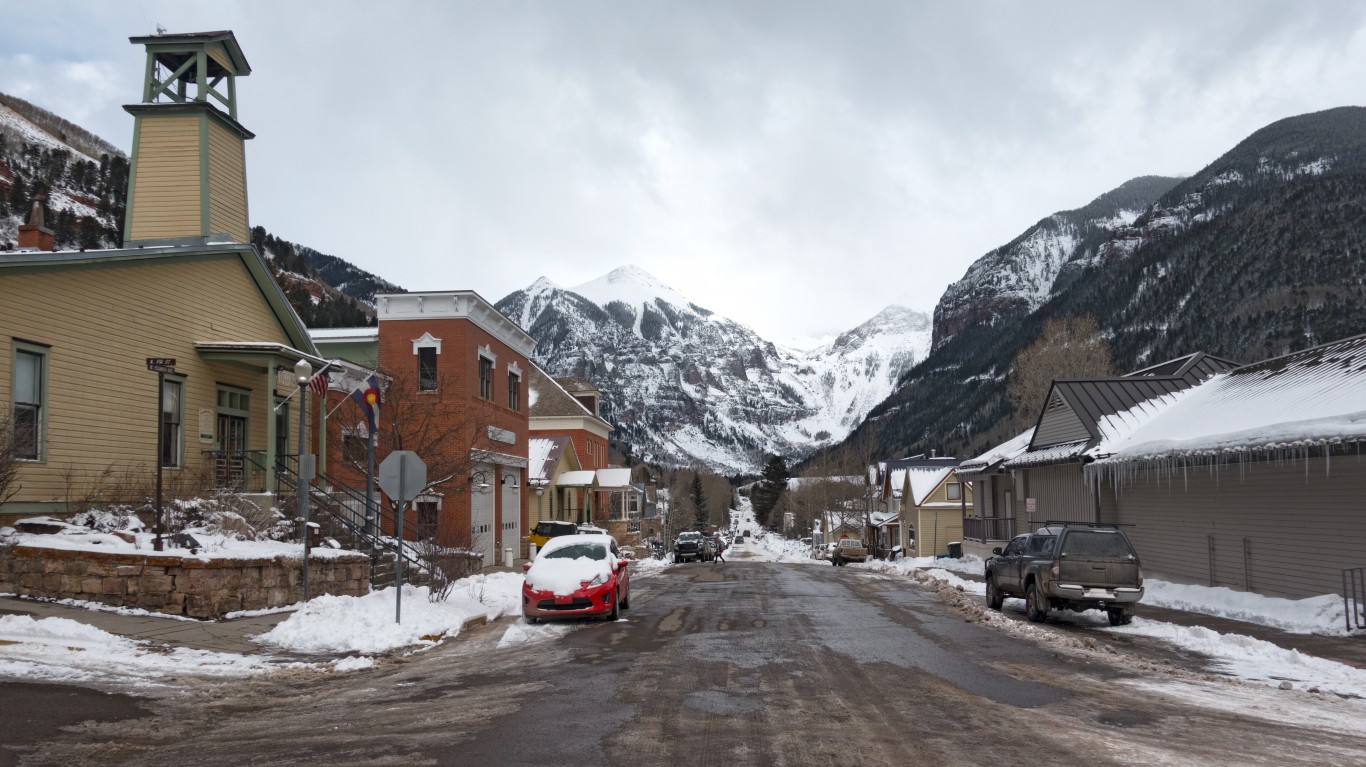
7. San Miguel County, Colorado
> Life expectancy: 83.73
> County seat: Telluride
> Change in life expectancy, 1980-2014: +7.9%
> Poverty: 11.9%
> Adult obesity: 18.3%

6. Aleutians East Borough, Alaska
> Life expectancy: 83.73
> County seat: Sand Point
> Change in life expectancy, 1980-2014: +18.3%
> Poverty: 15.5%
> Adult obesity: 34.9%

5. Marin County, California
> Life expectancy: 83.80
> County seat: San Rafael
> Change in life expectancy, 1980-2014: +10.8%
> Poverty: 8.1%
> Adult obesity: 18.1%
[in-text-ad]
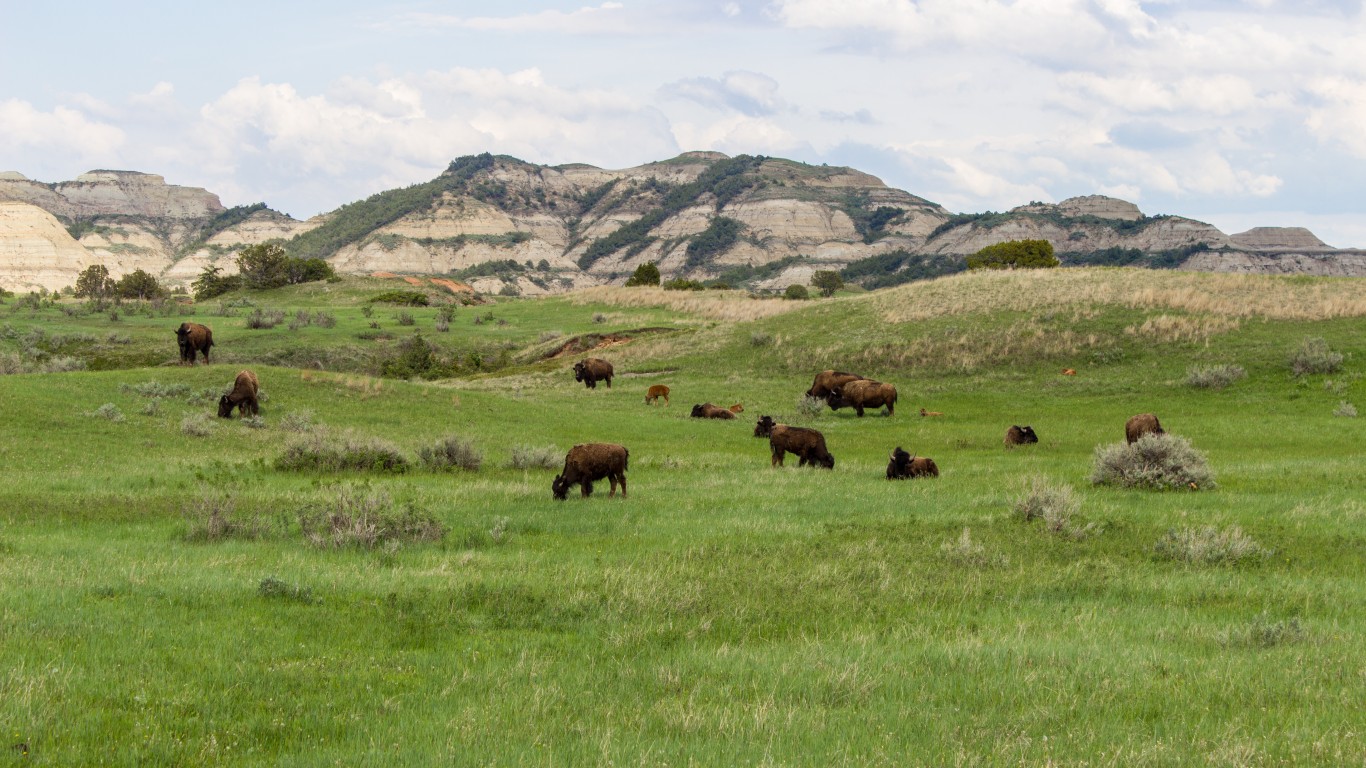
4. Billings County, North Dakota
> Life expectancy: 84.04
> County seat: Medora
> Change in life expectancy, 1980-2014: +5.8%
> Poverty: 11.0%
> Adult obesity: 28.1%
[recirclink id=487572]

3. Eagle County, Colorado
> Life expectancy: 85.94
> County seat: Eagle
> Change in life expectancy, 1980-2014: +11.3%
> Poverty: 8.1%
> Adult obesity: 12.8%
[in-text-ad-2]

2. Pitkin County, Colorado
> Life expectancy: 86.52
> County seat: Aspen
> Change in life expectancy, 1980-2014: +9.8%
> Poverty: 8.6%
> Adult obesity: 15.4%

1. Summit County, Colorado
> Life expectancy: 86.83
> County seat: Breckenridge
> Change in life expectancy, 1980-2014: +9.7%
> Poverty: 12.1%
> Adult obesity: 14.9%
Detailed Findings and Methodology:
The association between wealth and longevity is not fully understood but well established. For a variety of reasons, including access to higher quality medical care, less financial-related stress, and living in better-served high income areas, wealthier individuals tend to be healthier than poorer individuals.
Adults living in poverty are nearly five times more likely to report being in poor or fair health than more affluent American adults. According to a 2016 study published in the Journal of the American Medical Association, the richest 1% of Americans live on average nearly 15 years longer than the poorest 1%. In 47 of the 50 counties on this list, the poverty rate is lower than the national rate of 15.1%.
To determine the counties where people live the longest, 24/7 Wall St. reviewed 2014 county-level life expectancy at birth figures provided by the Institute for Health Metrics and Evaluation (IHME), a global research center affiliated with the University of Washington. The data came from the report, “United States Life Expectancy Estimates by County 1985-2014.” Using death records data from the National Center for Health Statistics, researchers estimated age-specific mortality rates for U.S. counties from 1985 to 2014. County estimates were weighted by 5-year population figures from the 2016 American Community Survey (ACS).
County-level poverty rates came from the U.S. Census Bureau’s 2016 American Community Survey. Obesity rates came from County Health Rankings & Roadmaps program, a collaboration between the Robert Wood Johnson Foundation and the University of Wisconsin Population Health Institute.
Contact [email protected] for any questions or corrections.