[cnxvideo id=”655234″ placement=”prodege”]The U.S. Census Bureau released its annual report on income and poverty in the United States earlier this week. The report revealed that median household income climbed 4.7% nationwide, from $57,617 in 2016 to $60,336 in 2017. For many, the progress did not come as a surprise given the country’s near record-low unemployment rate and a booming stock market.
The latest Census release also reinforces another, less encouraging trend: the increasing concentration of wealth at the top of the income distribution. According to research conducted by the Economic Policy Institute, a nonprofit nonpartisan think tank, incomes for the top 5% of earners climbed six times faster than incomes for the bottom 20%.
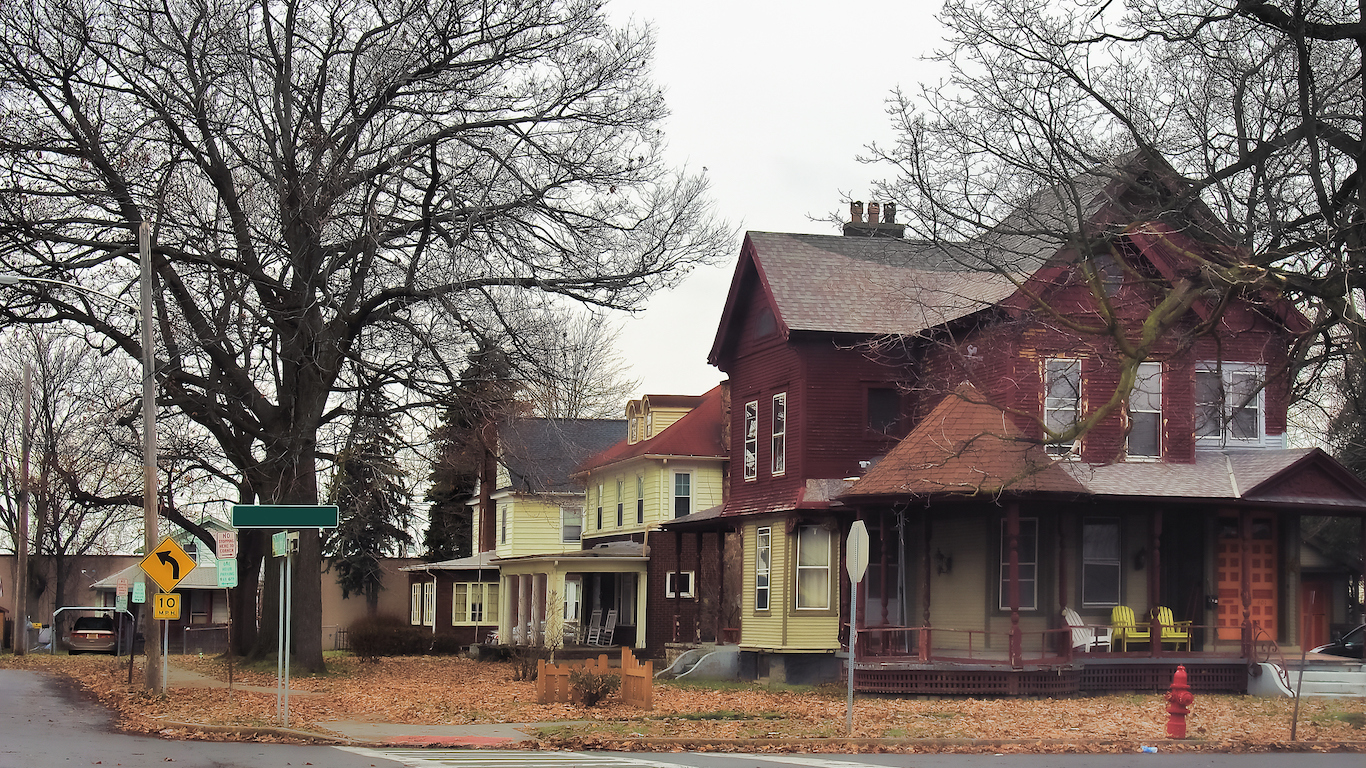
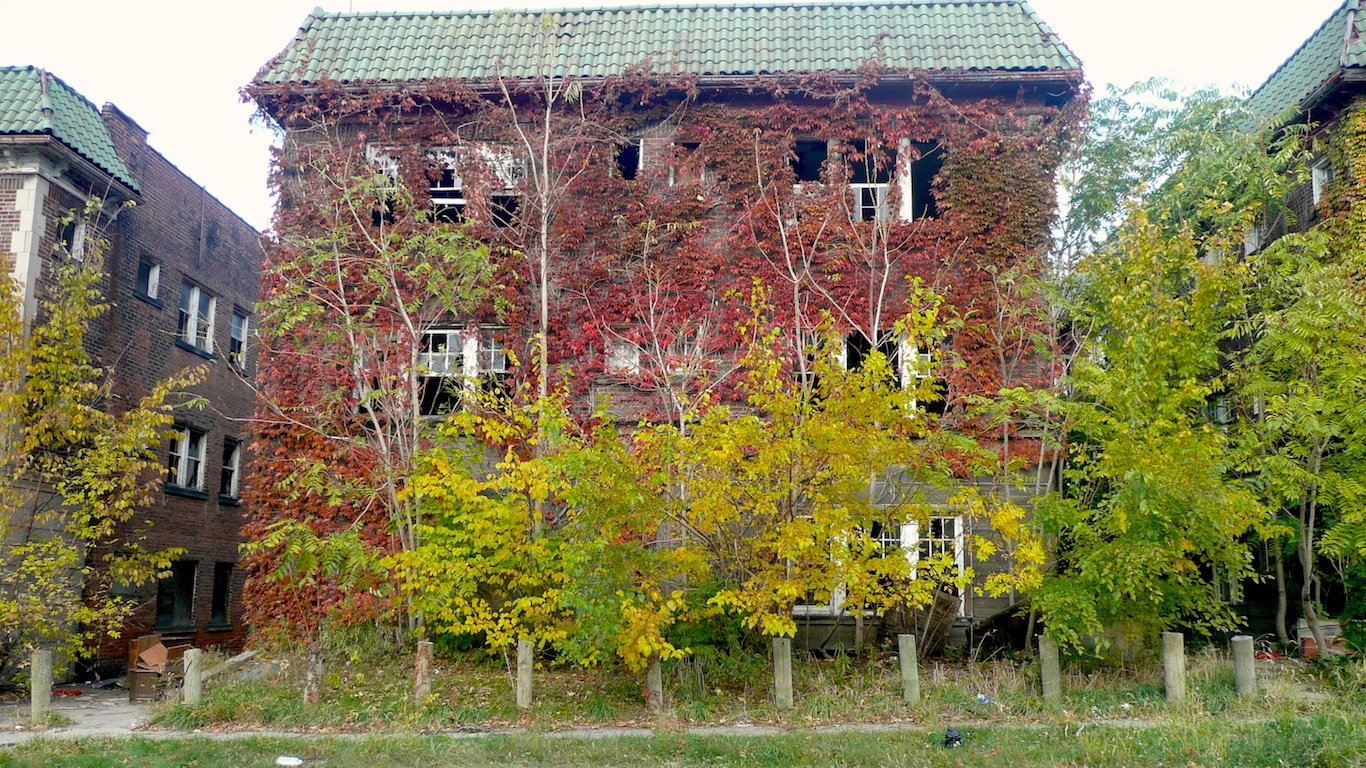
American cities are economically diverse, home to both extreme wealth and abject poverty. Some cities, however, are far more likely to be home to a greater share of high-income residents. These cities tend to have healthy job markets, well-educated populations, and expensive real estate.
24/7 Wall St. reviewed 2017 data from the U.S. Census Bureau to identify the 42 metro areas where the typical household earns at least $70,000 annually. While these cities span the country from coast to coast, over half of them are in western states, including 11 in California.

42. Provo-Orem, UT
> Median household income: $70,196
> Median income change 2016-2017: +$908 (+1.3%)
> Median home value: $296,600 (top 10%)
> Adults with a bachelor’s degree: 41.3% (top 10%)
> July unemployment: 2.9% (bottom 20%)

41. Ann Arbor, MI
> Median household income: $70,286
> Median income change 2016-2017: +$4,685 (+7.1%)
> Median home value: $258,700 (top 20%)
> Adults with a bachelor’s degree: 54.5% (top 10%)
> July unemployment: 2.8% (bottom 20%)
[recirclink id=488456]

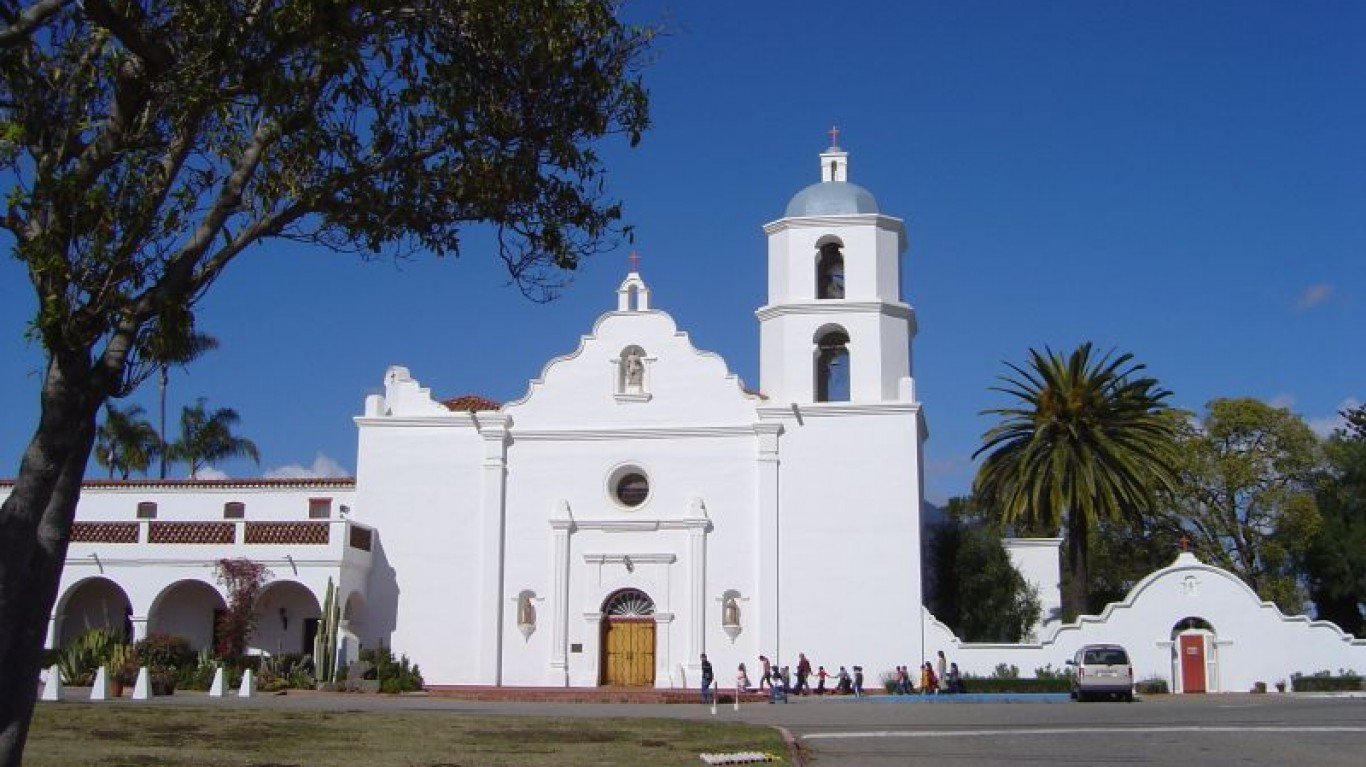
40. Santa Maria-Santa Barbara, CA
> Median household income: $71,106
> Median income change 2016-2017: +$3,670 (+5.4%)
> Median home value: $567,600 (top 10%)
> Adults with a bachelor’s degree: 35.2%
> July unemployment: 3.9%
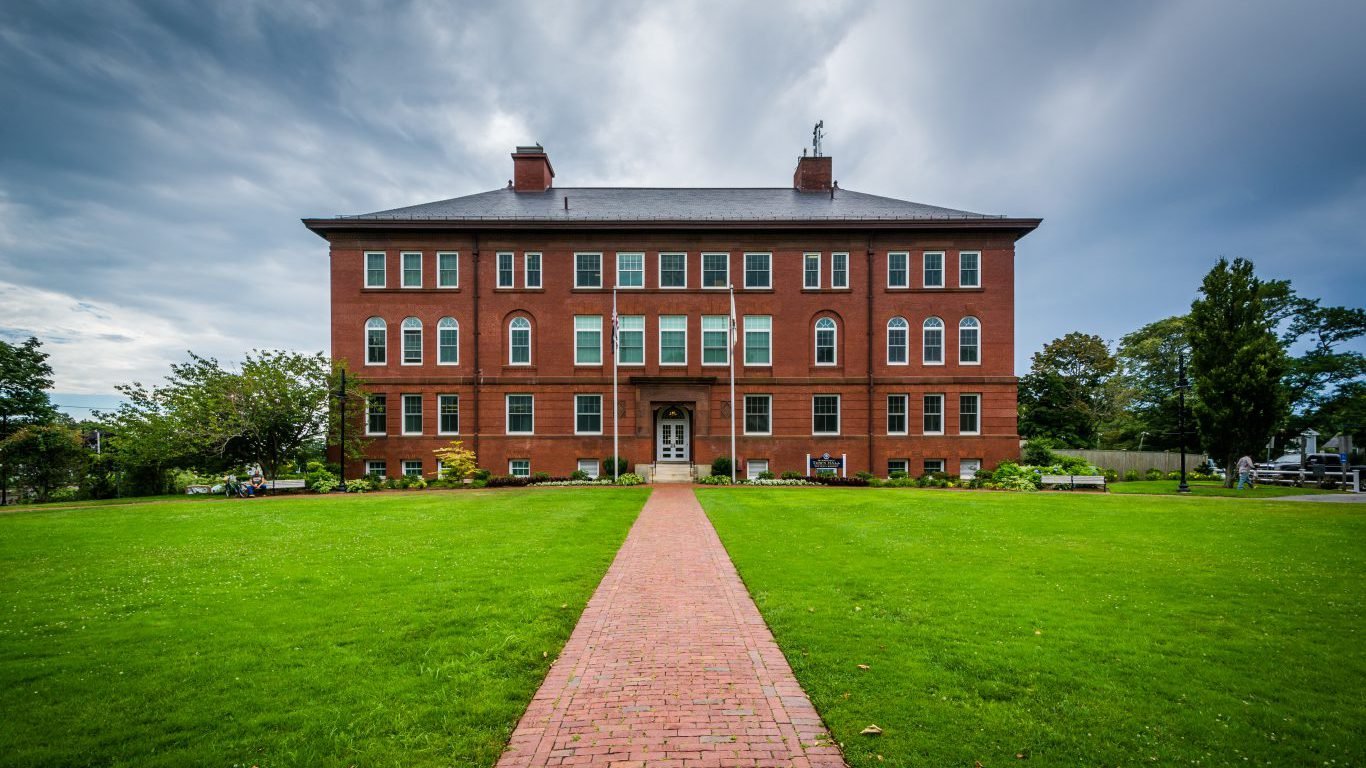
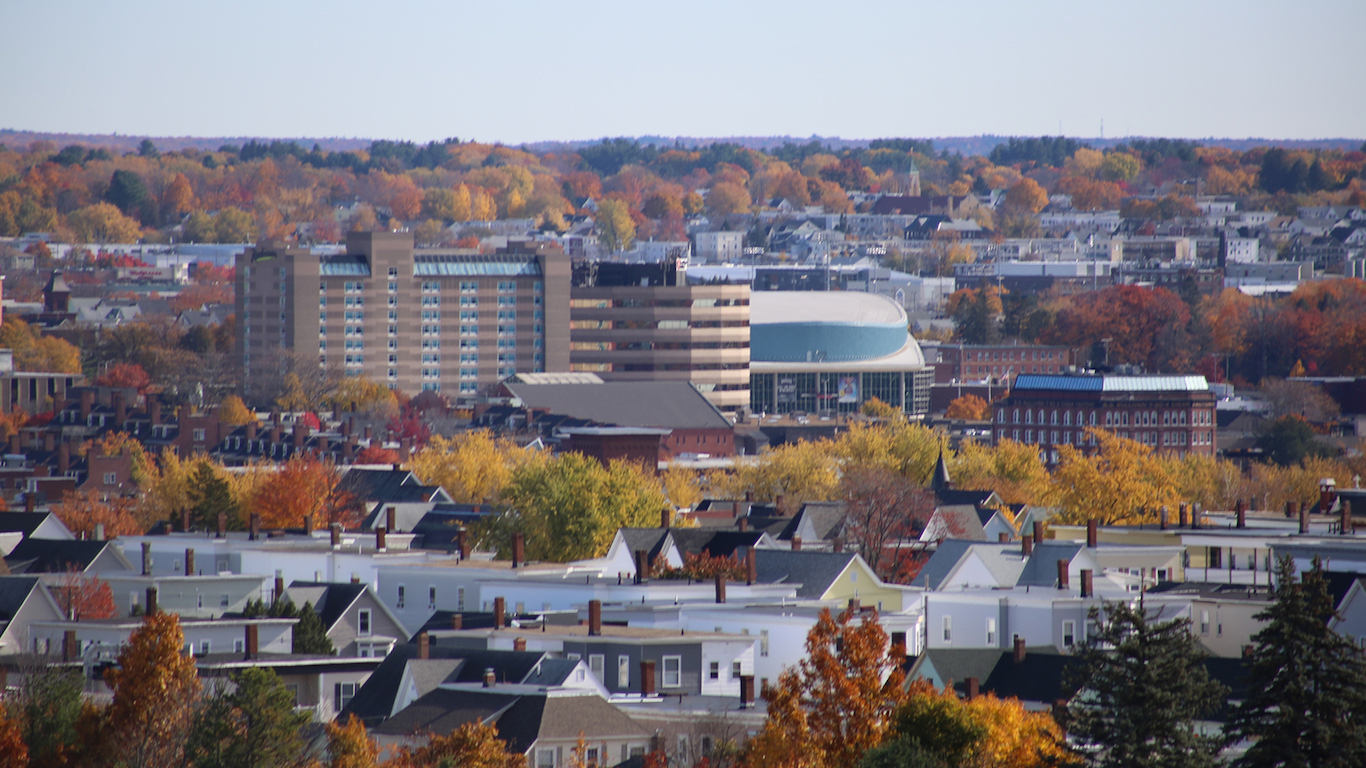
39. Barnstable Town, MA
> Median household income: $71,235
> Median income change 2016-2017: +$3,337 (+4.9%)
> Median home value: $401,100 (top 10%)
> Adults with a bachelor’s degree: 44.6% (top 10%)
> July unemployment: 4.4%

38. Salinas, CA
> Median household income: $71,274
> Median income change 2016-2017: +$7,398 (+11.6%)
> Median home value: $517,200 (top 10%)
> Adults with a bachelor’s degree: 24.8%
> July unemployment: 6.2% (top 10%)
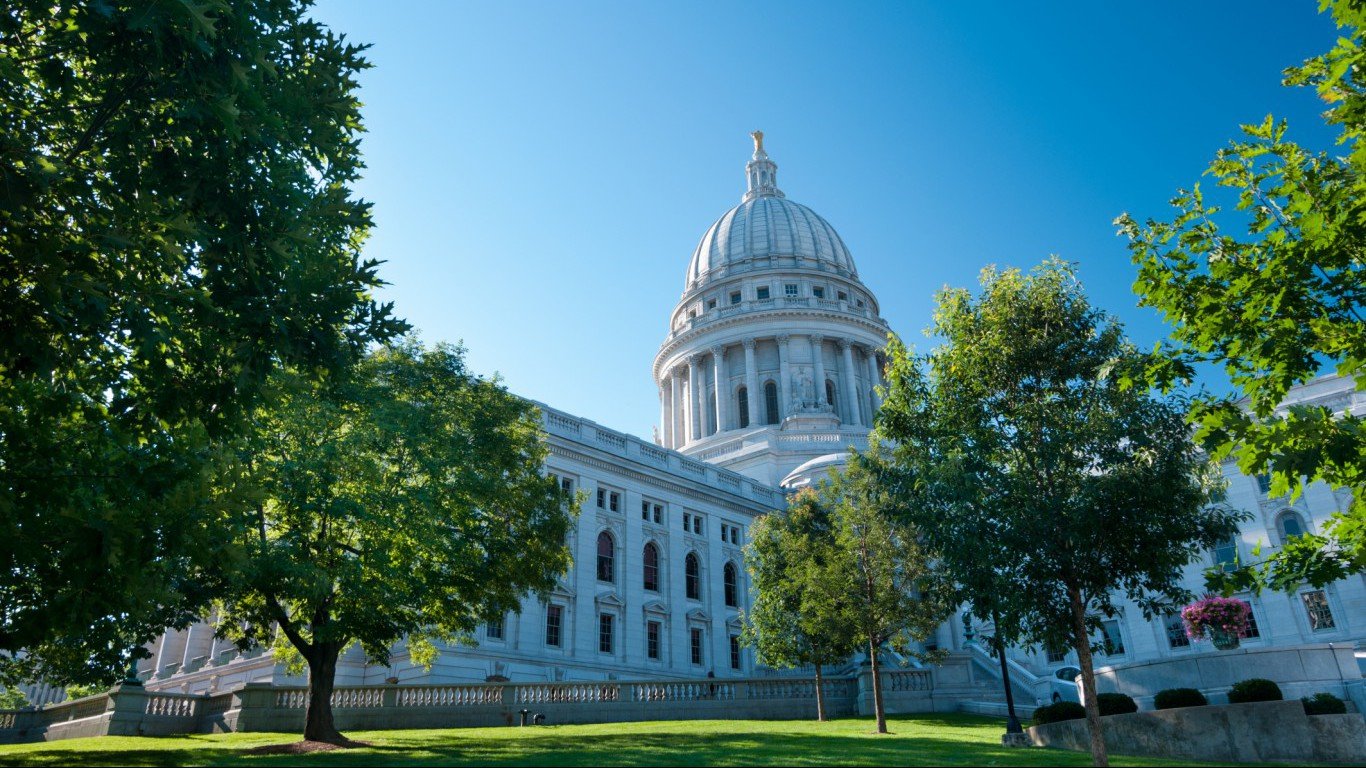
37. Madison, WI
> Median household income: $71,301
> Median income change 2016-2017: +$2,804 (+4.1%)
> Median home value: $247,000
> Adults with a bachelor’s degree: 45.9% (top 10%)
> July unemployment: 2.3% (bottom 10%)
[in-text-ad]

36. Hartford-West Hartford-East Hartford, CT
> Median household income: $71,414
> Median income change 2016-2017: -$1,145 (-1.6%)
> Median home value: $247,900
> Adults with a bachelor’s degree: 38.3% (top 20%)
> July unemployment: 4.2%
[recirclink id=488594]
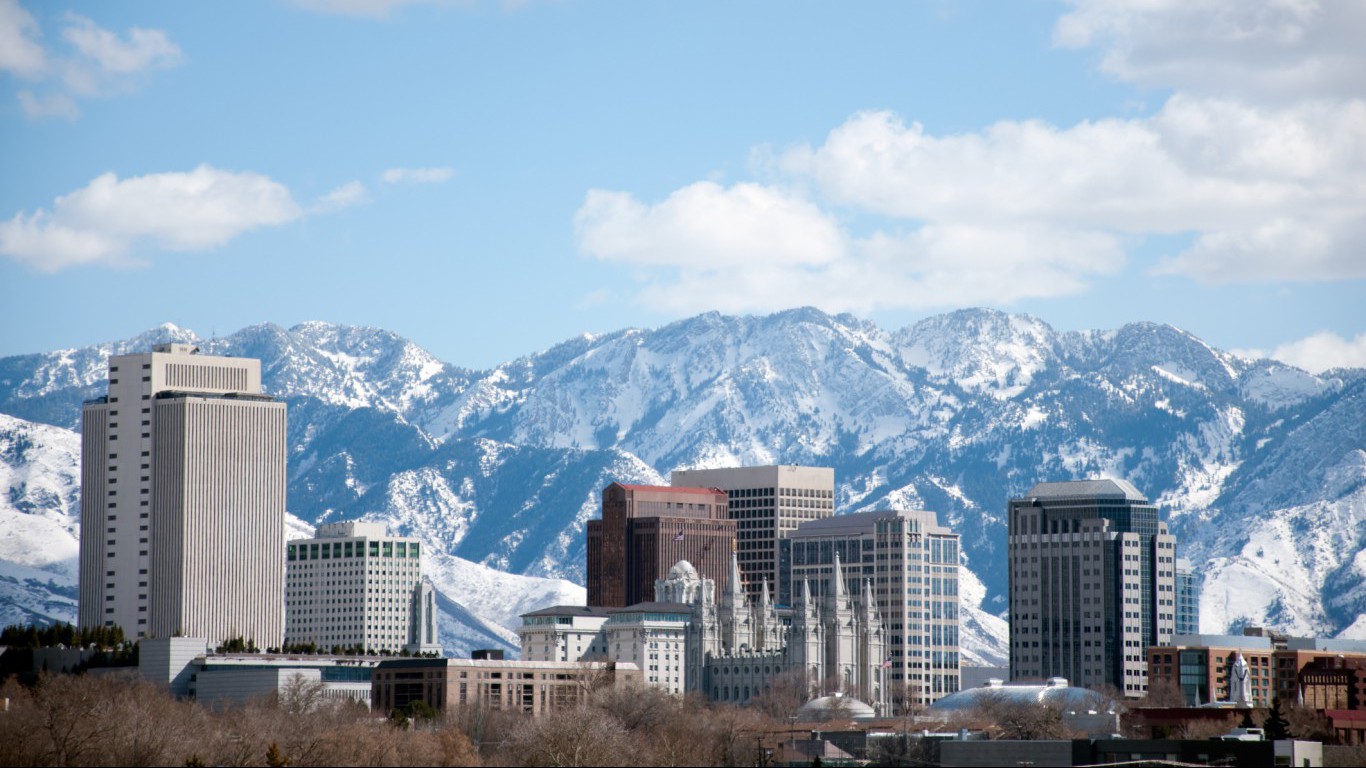
35. Salt Lake City, UT
> Median household income: $71,510
> Median income change 2016-2017: +$3,314 (+4.9%)
> Median home value: $294,800 (top 20%)
> Adults with a bachelor’s degree: 35.5%
> July unemployment: 3.0%
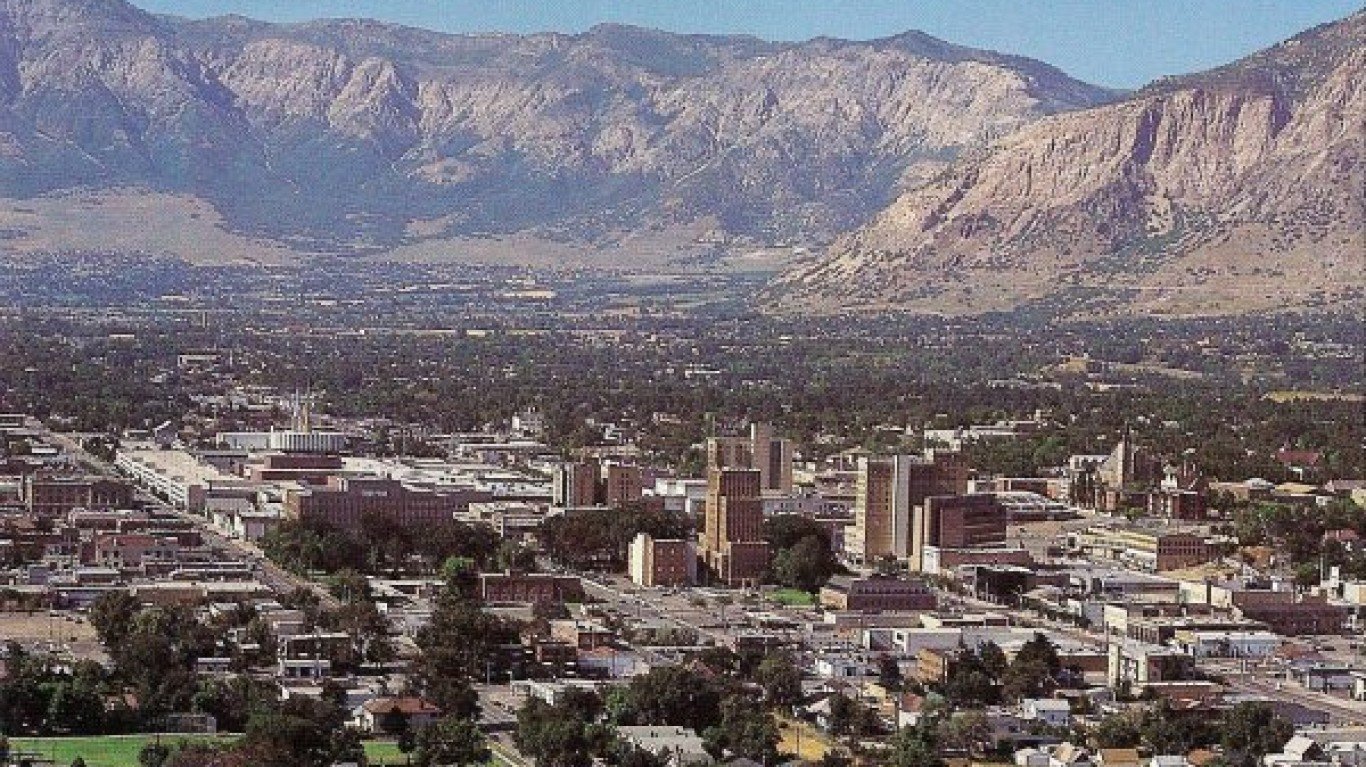
34. Ogden-Clearfield, UT
> Median household income: $71,629
> Median income change 2016-2017: +$1,402 (+2.0%)
> Median home value: $251,800 (top 20%)
> Adults with a bachelor’s degree: 32.4%
> July unemployment: 3.1%
[in-text-ad-2]

33. Olympia-Tumwater, WA
> Median household income: $71,765
> Median income change 2016-2017: +$5,982 (+9.1%)
> Median home value: $283,400 (top 20%)
> Adults with a bachelor’s degree: 35.7% (top 20%)
> July unemployment: 4.6%
32. San Luis Obispo-Paso Robles-Arroyo Grande, CA
> Median household income: $71,880
> Median income change 2016-2017: +$1,316 (+1.9%)
> Median home value: $574,400 (top 10%)
> Adults with a bachelor’s degree: 34.6%
> July unemployment: 2.8% (bottom 20%)
[in-text-ad]

31. Portland-Vancouver-Hillsboro, OR-WA
> Median household income: $71,931
> Median income change 2016-2017: +$3,255 (+4.7%)
> Median home value: $376,000 (top 10%)
> Adults with a bachelor’s degree: 40.3% (top 10%)
> July unemployment: 3.6%
[recirclink id=488561]

30. Rochester, MN
> Median household income: $71,985
> Median income change 2016-2017: +$1,907 (+2.7%)
> Median home value: $212,200
> Adults with a bachelor’s degree: 39.2% (top 20%)
> July unemployment: 2.4% (bottom 10%)
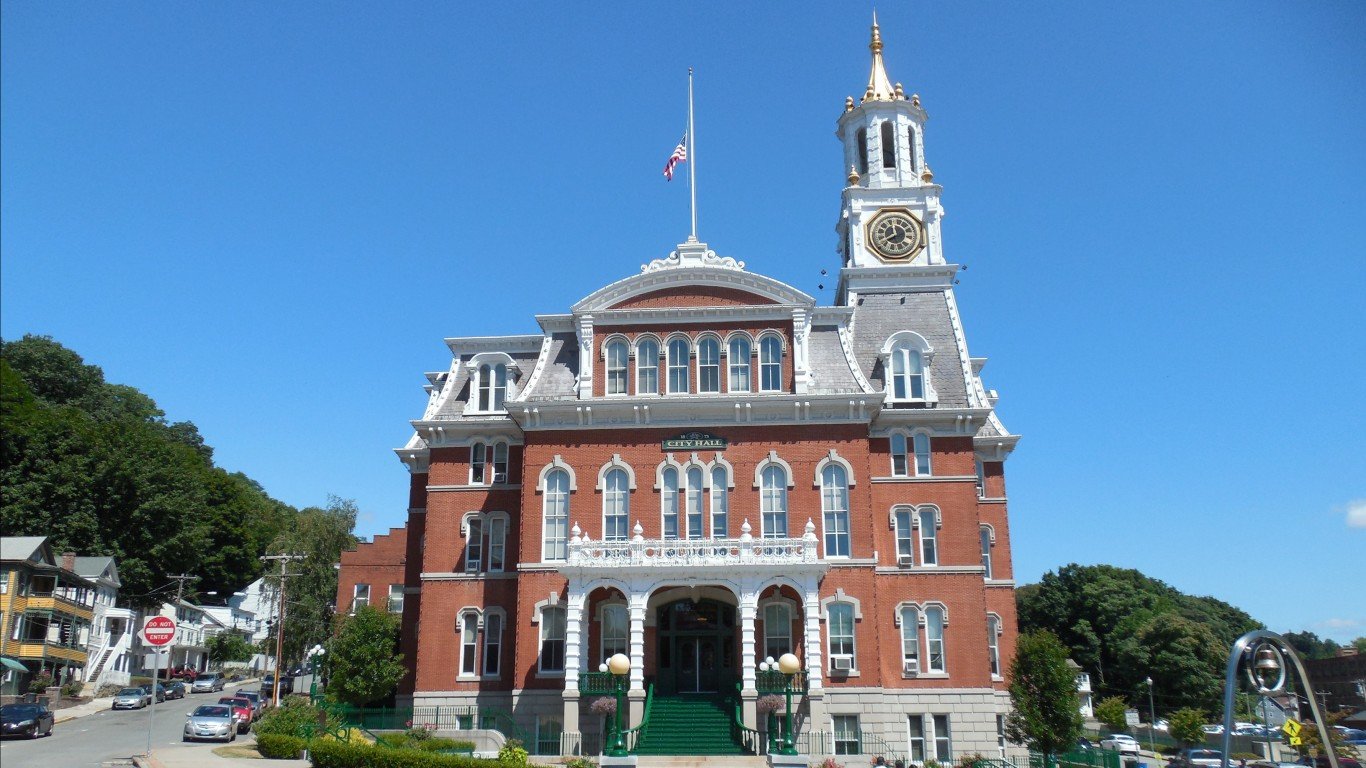
29. Norwich-New London, CT
> Median household income: $71,987
> Median income change 2016-2017: +$1,288 (+1.8%)
> Median home value: $239,400
> Adults with a bachelor’s degree: 33.4%
> July unemployment: 4.0%
[in-text-ad-2]

28. Raleigh, NC
> Median household income: $72,576
> Median income change 2016-2017: +$891 (+1.2%)
> Median home value: $244,500
> Adults with a bachelor’s degree: 46.2% (top 10%)
> July unemployment: 3.3%
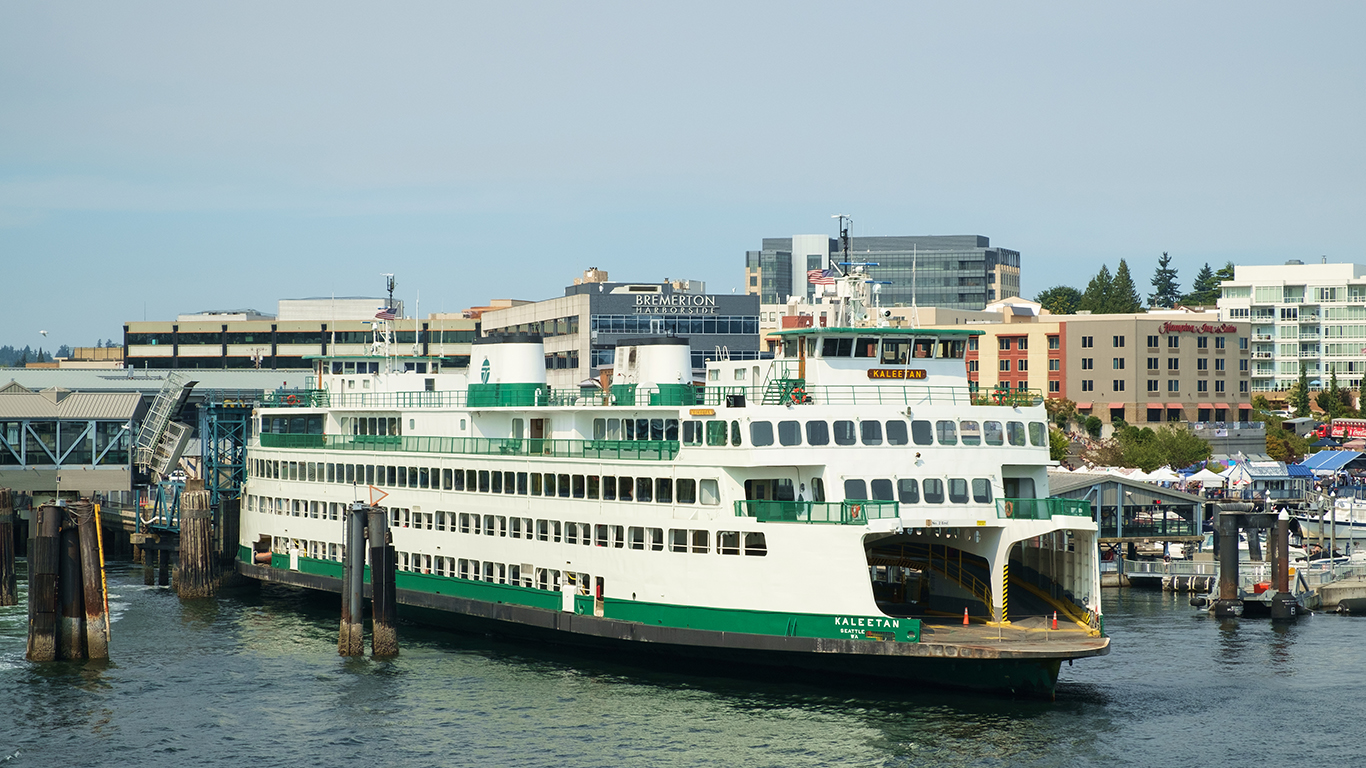
27. Bremerton-Silverdale, WA
> Median household income: $73,026
> Median income change 2016-2017: +$3,855 (+5.6%)
> Median home value: $326,200 (top 10%)
> Adults with a bachelor’s degree: 33.5%
> July unemployment: 4.5%
[in-text-ad]

26. Austin-Round Rock, TX
> Median household income: $73,800
> Median income change 2016-2017: +$2,800 (+3.9%)
> Median home value: $283,600 (top 20%)
> Adults with a bachelor’s degree: 44.8% (top 10%)
> July unemployment: 2.8% (bottom 20%)
[recirclink id=488514]

25. Midland, TX
> Median household income: $75,266
> Median income change 2016-2017: +$10,042 (+15.4%)
> Median home value: $197,000
> Adults with a bachelor’s degree: 27.6%
> July unemployment: 2.1% (bottom 10%)

24. New York-Newark-Jersey City, NY-NJ-PA
> Median household income: $75,368
> Median income change 2016-2017: +$3,471 (+4.8%)
> Median home value: $440,900 (top 10%)
> Adults with a bachelor’s degree: 39.6% (top 10%)
> July unemployment: 4.0%
[in-text-ad-2]

23. San Diego-Carlsbad, CA
> Median household income: $76,207
> Median income change 2016-2017: +$5,383 (+7.6%)
> Median home value: $563,800 (top 10%)
> Adults with a bachelor’s degree: 38.8% (top 20%)
> July unemployment: 3.2%

22. Denver-Aurora-Lakewood, CO
> Median household income: $76,643
> Median income change 2016-2017: +$4,717 (+6.6%)
> Median home value: $386,800 (top 10%)
> Adults with a bachelor’s degree: 43.9% (top 10%)
> July unemployment: 2.9% (bottom 20%)
[in-text-ad]
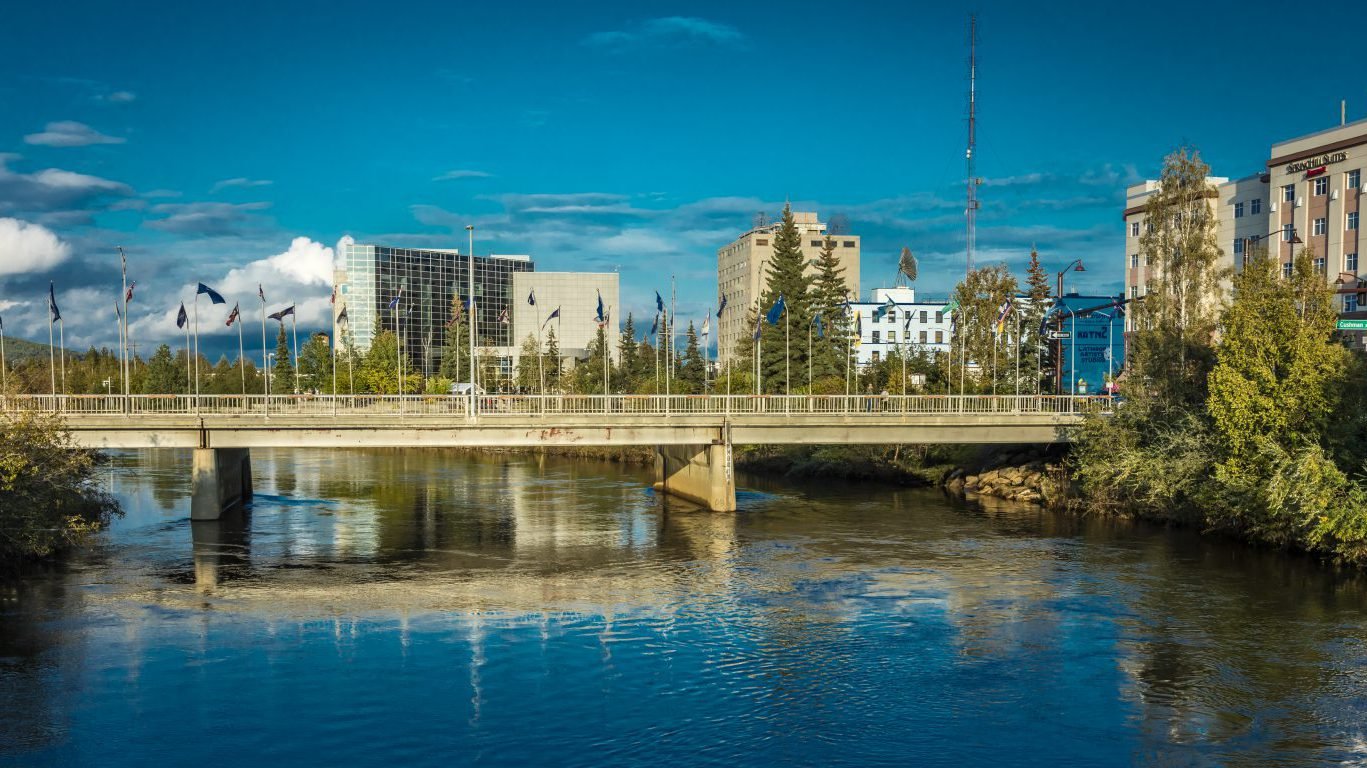
21. Fairbanks, AK
> Median household income: $76,747
> Median income change 2016-2017: -$581 (-0.8%)
> Median home value: $239,000
> Adults with a bachelor’s degree: 29.6%
> July unemployment: 5.7% (top 10%)
[recirclink id=488498]

20. Minneapolis-St. Paul-Bloomington, MN-WI
> Median household income: $76,856
> Median income change 2016-2017: +$3,625 (+5.0%)
> Median home value: $254,800 (top 20%)
> Adults with a bachelor’s degree: 41.7% (top 10%)
> July unemployment: 2.5% (bottom 10%)
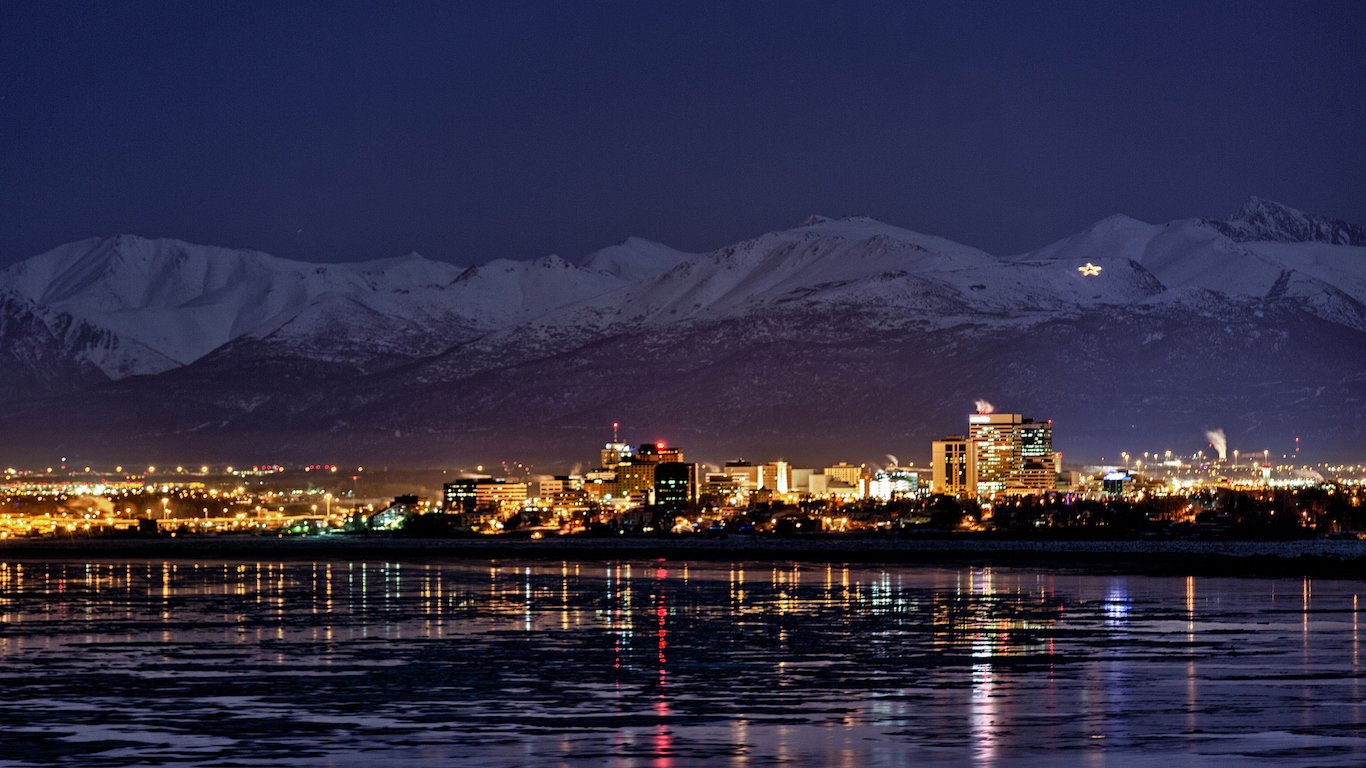
19. Anchorage, AK
> Median household income: $76,871
> Median income change 2016-2017: -$5,332 (-6.5%)
> Median home value: $298,100 (top 10%)
> Adults with a bachelor’s degree: 31.6%
> July unemployment: 5.8% (top 10%)
[in-text-ad-2]
18. Vallejo-Fairfield, CA
> Median household income: $77,133
> Median income change 2016-2017: +$3,233 (+4.4%)
> Median home value: $411,700 (top 10%)
> Adults with a bachelor’s degree: 26.6%
> July unemployment: 3.8%

17. Baltimore-Columbia-Towson, MD
> Median household income: $77,394
> Median income change 2016-2017: +$606 (+0.8%)
> Median home value: $297,300 (top 10%)
> Adults with a bachelor’s degree: 39.5% (top 20%)
> July unemployment: 4.3%
[in-text-ad]
16. Manchester-Nashua, NH
> Median household income: $78,769
> Median income change 2016-2017: +$2,515 (+3.3%)
> Median home value: $278,400 (top 20%)
> Adults with a bachelor’s degree: 37.6% (top 20%)
> July unemployment: 2.5% (bottom 10%)
[recirclink id=488094]

15. Trenton, NJ
> Median household income: $79,173
> Median income change 2016-2017: +$1,523 (+2.0%)
> Median home value: $293,800 (top 20%)
> Adults with a bachelor’s degree: 43.9% (top 10%)
> July unemployment: 3.8%
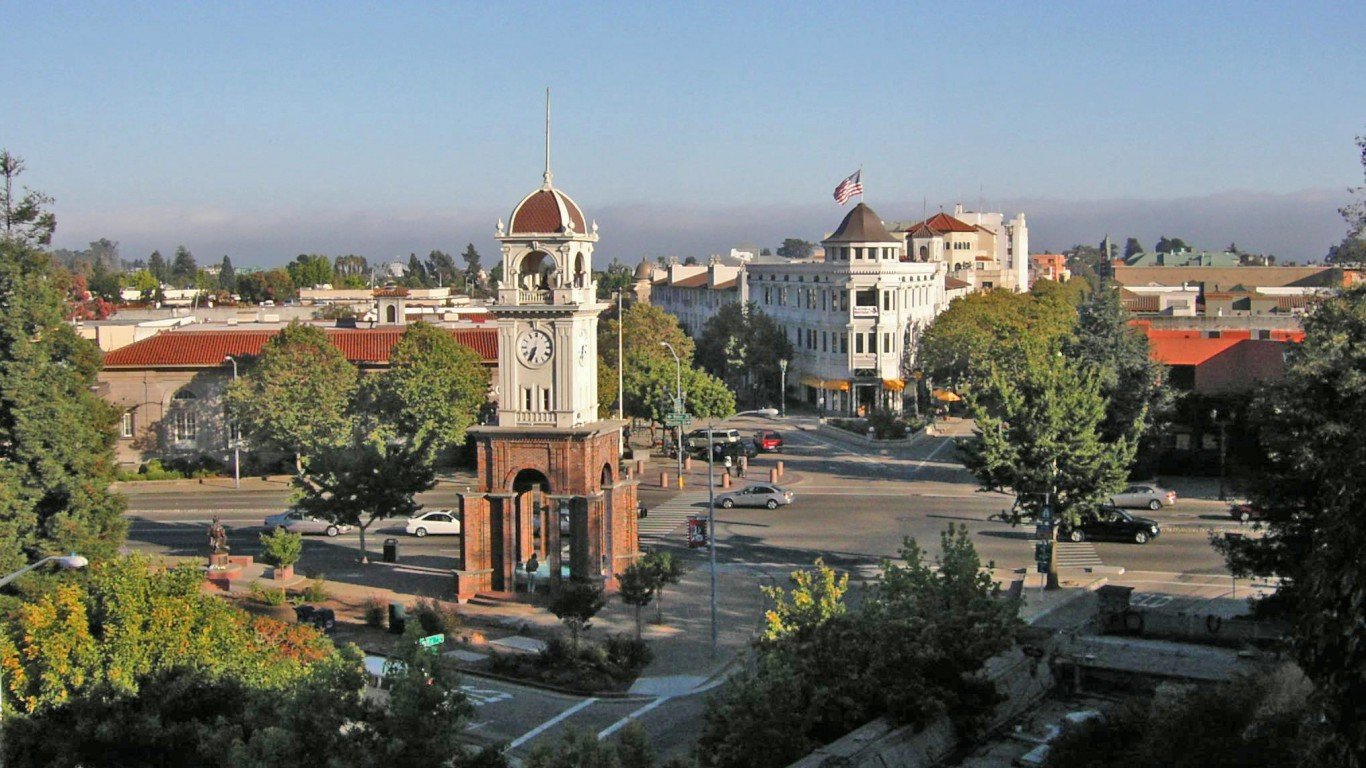
14. Santa Cruz-Watsonville, CA
> Median household income: $79,705
> Median income change 2016-2017: +$2,092 (+2.7%)
> Median home value: $775,000 (top 10%)
> Adults with a bachelor’s degree: 40.2% (top 10%)
> July unemployment: 5.0% (top 20%)
[in-text-ad-2]

13. Kahului-Wailuku-Lahaina, HI
> Median household income: $80,183
> Median income change 2016-2017: +$7,915 (+11.0%)
> Median home value: $641,500 (top 10%)
> Adults with a bachelor’s degree: 27.0%
> July unemployment: 2.1% (bottom 10%)

12. Santa Rosa, CA
> Median household income: $80,409
> Median income change 2016-2017: +$6,480 (+8.8%)
> Median home value: $628,400 (top 10%)
> Adults with a bachelor’s degree: 35.8% (top 20%)
> July unemployment: 2.6% (bottom 10%)
[in-text-ad]
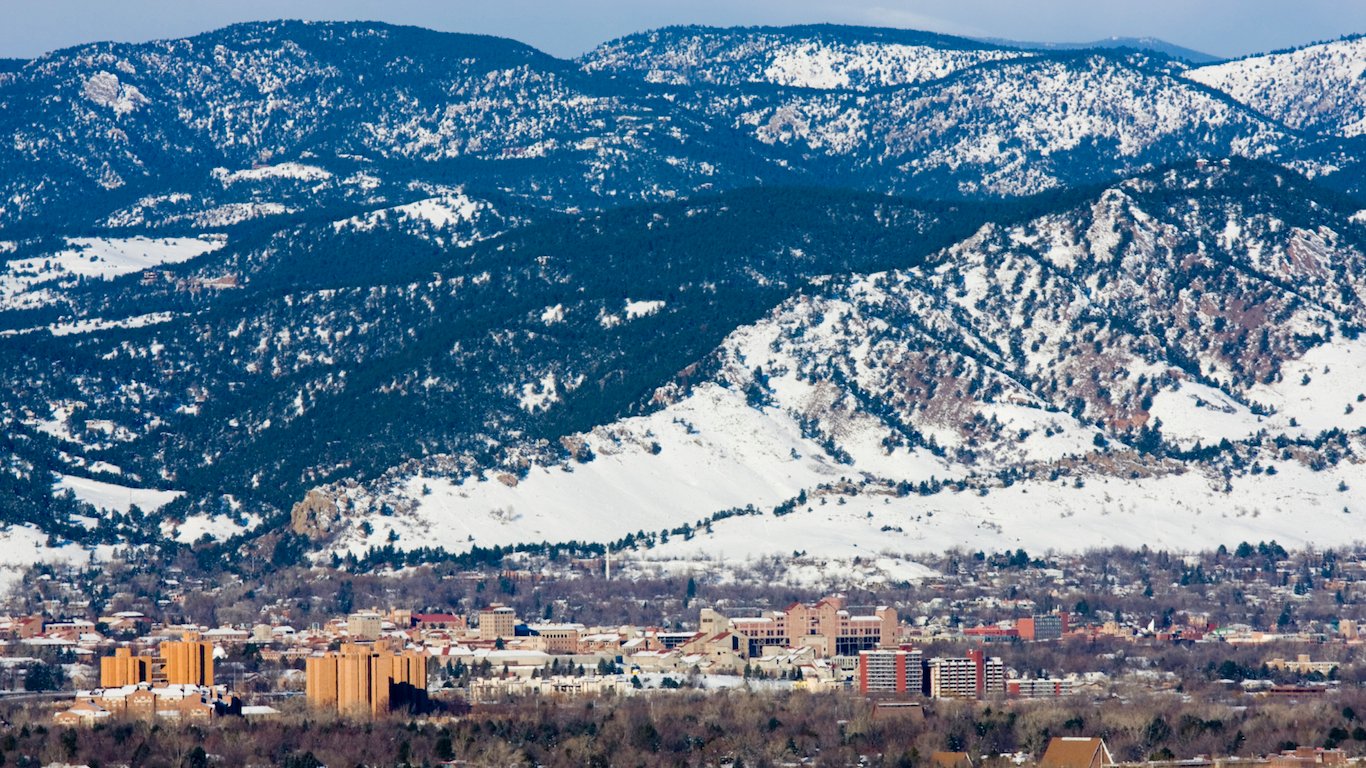
11. Boulder, CO
> Median household income: $80,834
> Median income change 2016-2017: +$6,219 (+8.3%)
> Median home value: $504,800 (top 10%)
> Adults with a bachelor’s degree: 63.2% (top 10%)
> July unemployment: 2.6% (bottom 10%)
[recirclink id=488247]

10. Urban Honolulu, HI
> Median household income: $81,284
> Median income change 2016-2017: +$771 (+1.0%)
> Median home value: $680,200 (top 10%)
> Adults with a bachelor’s degree: 34.7%
> July unemployment: 2.0% (bottom 10%)

9. California-Lexington Park, MD
> Median household income: $81,495
> Median income change 2016-2017: +$3,300 (+4.2%)
> Median home value: $294,000 (top 20%)
> Adults with a bachelor’s degree: 31.8%
> July unemployment: 4.2%
[in-text-ad-2]

8. Seattle-Tacoma-Bellevue, WA
> Median household income: $82,133
> Median income change 2016-2017: +$3,521 (+4.5%)
> Median home value: $439,800 (top 10%)
> Adults with a bachelor’s degree: 41.9% (top 10%)
> July unemployment: 3.7%

7. Oxnard-Thousand Oaks-Ventura, CA
> Median household income: $82,857
> Median income change 2016-2017: +$2,722 (+3.4%)
> Median home value: $592,500 (top 10%)
> Adults with a bachelor’s degree: 33.4%
> July unemployment: 3.6%
[in-text-ad]

6. Boston-Cambridge-Newton, MA-NH
> Median household income: $85,691
> Median income change 2016-2017: +$3,311 (+4.0%)
> Median home value: $441,400 (top 10%)
> Adults with a bachelor’s degree: 47.6% (top 10%)
> July unemployment: 3.3%
[recirclink id=488174]

5. Napa, CA
> Median household income: $86,562
> Median income change 2016-2017: +$11,485 (+15.3%)
> Median home value: $628,500 (top 10%)
> Adults with a bachelor’s degree: 36.2% (top 20%)
> July unemployment: 3.0%

4. Bridgeport-Stamford-Norwalk, CT
> Median household income: $91,198
> Median income change 2016-2017: +$1,075 (+1.2%)
> Median home value: $425,900 (top 10%)
> Adults with a bachelor’s degree: 47.1% (top 10%)
> July unemployment: 4.2%
[in-text-ad-2]

3. Washington-Arlington-Alexandria, DC-VA-MD-WV
> Median household income: $99,669
> Median income change 2016-2017: +$3,826 (+4.0%)
> Median home value: $424,600 (top 10%)
> Adults with a bachelor’s degree: 50.8% (top 10%)
> July unemployment: 3.4%

2. San Francisco-Oakland-Hayward, CA
> Median household income: $101,714
> Median income change 2016-2017: +$5,037 (+5.2%)
> Median home value: $849,500 (top 10%)
> Adults with a bachelor’s degree: 49.3% (top 10%)
> July unemployment: 2.6% (bottom 10%)
[in-text-ad]

1. San Jose-Sunnyvale-Santa Clara, CA
> Median household income: $117,474
> Median income change 2016-2017: +$7,434 (+6.8%)
> Median home value: $957,700 (top 10%)
> Adults with a bachelor’s degree: 50.8% (top 10%)
> July unemployment: 2.6% (bottom 10%)
Detailed Findings
In America’s richest cities, median household incomes range from $70,196 in Provo-Orem, Utah to $117,474 in San Jose-Sunnyvale-Santa Clara, California. One factor that differentiates these metro areas — and many of the others on this list — from most other U.S. cities is the concentration of jobs in high-paying industries.
For example, because of the presence of major computer software companies, Provo and San Jose are in regions known as Silicon Slopes and Silicon Valley, respectively. Major employers in and around those areas include Adobe, Facebook, Google, and eBay — all companies that commonly pay six-figure salaries.
It is likely no coincidence that many high-paying employers have major operations in the cities on this list. High salary jobs tend to require highly skilled personnel with advanced degrees, and the majority of cities on this list have large college-educated talent pools for companies to hire from. In all but seven cities on this list, the share of adults with a bachelor’s degree or higher exceeds the 32% national college attainment rate. In four cities on this list, over half of all adults have a bachelor’s degree or higher.
Jobs in general, high paying or not, tend to be widely available in America’s wealthiest cities. In 29 of the 42 cities on this list, the unemployment rate in July was at or below the 3.9% national jobless rate.
The high incomes in the America’s wealthiest cities have driven up property values. Similarly, high property values make many of these cities prohibitively expensive for lower-income Americans. In all but two cities on this list, the median home value is higher than the $217,600 median home value nationwide. In 13 cities on this list, over half of all homes are worth over half a million dollars.
Methodology
To determine the richest cities in America, 24/7 Wall St. reviewed data from the U.S. Census Bureau’s 2017 American Community Survey. We identified the 42 U.S. metropolitan statistical areas with median annual household incomes of at least $70,000. Poverty rates, median home values, and educational attainment rates also came from the ACS. Unemployment rates are from the Bureau of Labor Statistics and are seasonally adjusted for July 2018, the most recent period for which data is available.
Contact [email protected] for any questions or corrections.