[cnxvideo id=”704365″ placement=”ros”]More than 50 million Americans today are 65 years of age or older. This figure is expected to roughly double over the next four decades. At that rate, older Americans will make up about 25% of the U.S. population by 2060, up from 15.6% in 2017.
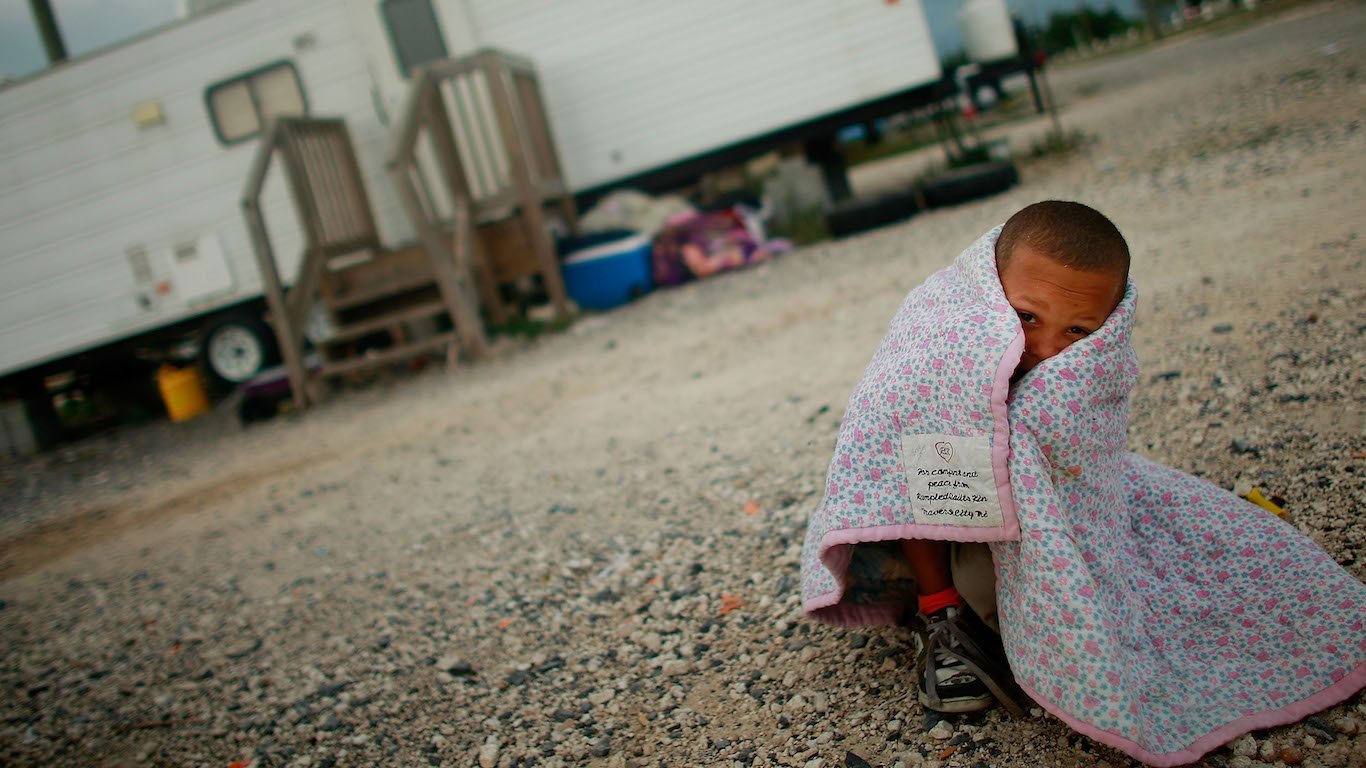
The quality of life for elderly Americans often depends on the facilities, businesses, government spending, and living conditions in their home state. As is the case for Americans of any age, senior citizens are more likely to be happy and healthy if they are financially secure and living in a safe area.
Other factors, including access to public transportation, medical treatment facilities, and social venues, often are far more important for elderly Americans than for other age groups.
As these and other social and environmental factors vary by region, so, too, does the quality of life of elderly Americans.
24/7 Wall St. created an index of over a dozen measures related to income, health, environment, education, and access to amenities to identify the best (and worst) states in which to grow old. While the best states for the elderly span the country, the worst states are almost exclusively in the South.
Click here to see the worst states to grow old in.
Click here to read our methodology.

1. Vermont
> Pct. of pop. age 65+: 18.8% (4th highest)
> 65 and older poverty rate: 7.1% (7th lowest)
> 65 and older bachelor’s deg. attainment: 37.2% (2nd highest)
> Healthy life expectancy after 65: 15.2 years (6th highest)
[in-text-ad]

2. Colorado
> Pct. of pop. age 65+: 13.8% (5th lowest)
> 65 and older poverty rate: 7.8% (15th lowest)
> 65 and older bachelor’s deg. attainment: 38.5% (the highest)
> Healthy life expectancy after 65: 15.3 years (5th highest)
[recirclink id=488456]

3. Virginia
> Pct. of pop. age 65+: 15.0% (10th lowest)
> 65 and older poverty rate: 7.1% (7th lowest)
> 65 and older bachelor’s deg. attainment: 32.4% (7th highest)
> Healthy life expectancy after 65: 14.2 years (25th lowest)

4. Maryland
> Pct. of pop. age 65+: 14.9% (8th lowest)
> 65 and older poverty rate: 7.9% (16th lowest)
> 65 and older bachelor’s deg. attainment: 34.5% (4th highest)
> Healthy life expectancy after 65: 14.4 years (24th highest)
[in-text-ad-2]

5. Connecticut
> Pct. of pop. age 65+: 16.8% (14th highest)
> 65 and older poverty rate: 7.1% (7th lowest)
> 65 and older bachelor’s deg. attainment: 32.6% (5th highest)
> Healthy life expectancy after 65: 15.7 years (2nd highest)

6. New Hampshire
> Pct. of pop. age 65+: 17.6% (9th highest)
> 65 and older poverty rate: 5.8% (the lowest)
> 65 and older bachelor’s deg. attainment: 32.3% (8th highest)
> Healthy life expectancy after 65: 15.1 years (7th highest)
[in-text-ad]

7. Montana
> Pct. of pop. age 65+: 18.1% (5th highest)
> 65 and older poverty rate: 7.2% (9th lowest)
> 65 and older bachelor’s deg. attainment: 31.4% (11th highest)
> Healthy life expectancy after 65: 14.6 years (19th highest)
[recirclink id=488594]

8. Utah
> Pct. of pop. age 65+: 10.8% (the lowest)
> 65 and older poverty rate: 6.4% (2nd lowest)
> 65 and older bachelor’s deg. attainment: 32.0% (9th highest)
> Healthy life expectancy after 65: 15.0 years (9th highest)

9. Minnesota
> Pct. of pop. age 65+: 15.4% (19th lowest)
> 65 and older poverty rate: 7.0% (4th lowest)
> 65 and older bachelor’s deg. attainment: 28.9% (20th highest)
> Healthy life expectancy after 65: 15.6 years (3rd highest)
[in-text-ad-2]
10. Massachusetts
> Pct. of pop. age 65+: 16.1% (24th highest)
> 65 and older poverty rate: 9.0% (19th highest)
> 65 and older bachelor’s deg. attainment: 34.9% (3rd highest)
> Healthy life expectancy after 65: 15.0 years (9th highest)

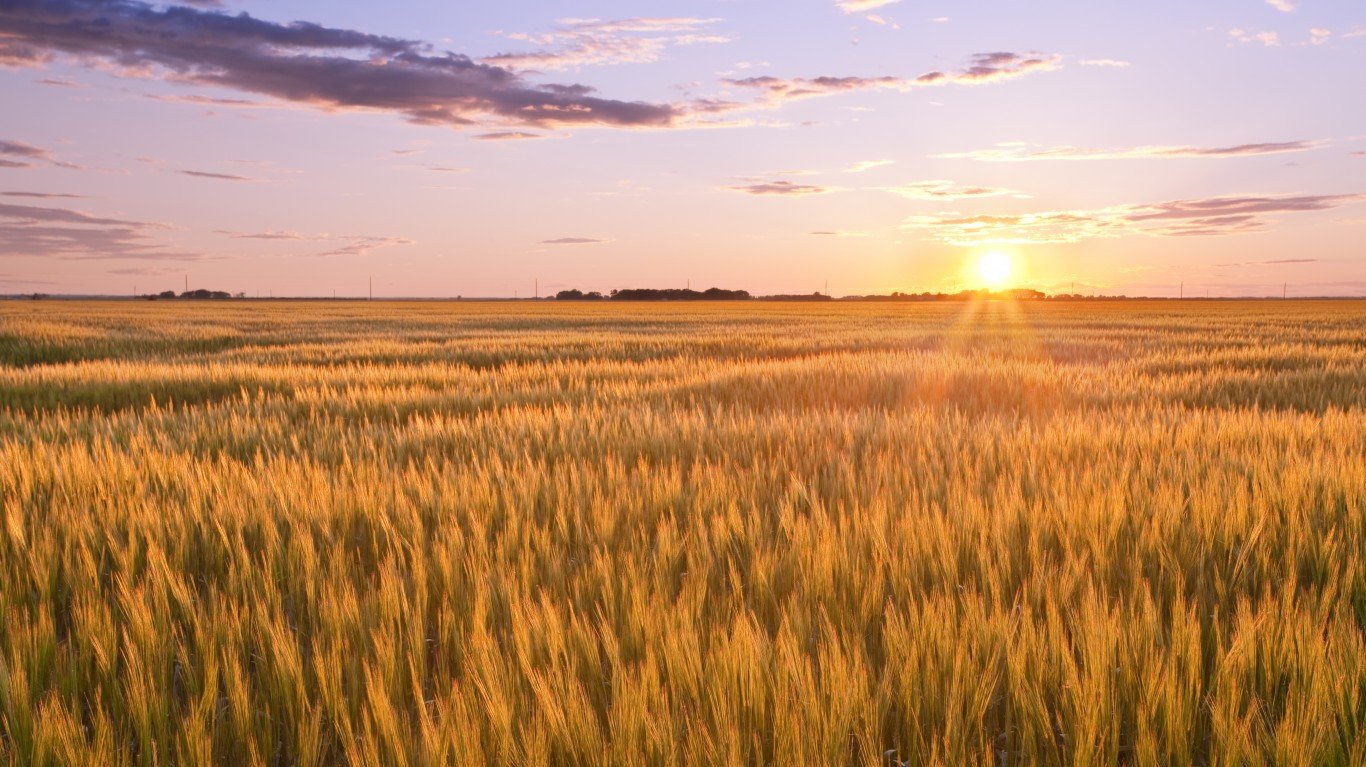
11. Kansas
> Pct. of pop. age 65+: 15.4% (18th lowest)
> 65 and older poverty rate: 7.3% (10th lowest)
> 65 and older bachelor’s deg. attainment: 29.5% (18th highest)
> Healthy life expectancy after 65: 14.2 years (25th lowest)
[in-text-ad]

12. Washington
> Pct. of pop. age 65+: 15.1% (11th lowest)
> 65 and older poverty rate: 8.0% (18th lowest)
> 65 and older bachelor’s deg. attainment: 32.6% (5th highest)
> Healthy life expectancy after 65: 15.1 years (7th highest)
[recirclink id=488561]

13. Hawaii
> Pct. of pop. age 65+: 17.8% (8th highest)
> 65 and older poverty rate: 9.3% (14th highest)
> 65 and older bachelor’s deg. attainment: 31.8% (10th highest)
> Healthy life expectancy after 65: 16.2 years (the highest)

14. Delaware
> Pct. of pop. age 65+: 18.0% (6th highest)
> 65 and older poverty rate: 8.5% (25th highest)
> 65 and older bachelor’s deg. attainment: 28.9% (20th highest)
> Healthy life expectancy after 65: 14.7 years (16th highest)
[in-text-ad-2]

15. South Dakota
> Pct. of pop. age 65+: 16.3% (23rd highest)
> 65 and older poverty rate: 8.0% (18th lowest)
> 65 and older bachelor’s deg. attainment: 25.4% (18th lowest)
> Healthy life expectancy after 65: 15.0 years (9th highest)

16. New Jersey
> Pct. of pop. age 65+: 15.7% (22nd lowest)
> 65 and older poverty rate: 8.4% (22nd lowest)
> 65 and older bachelor’s deg. attainment: 30.5% (16th highest)
> Healthy life expectancy after 65: 14.0 years (21st lowest)
[in-text-ad]

17. Alaska
> Pct. of pop. age 65+: 11.2% (2nd lowest)
> 65 and older poverty rate: 7.4% (11th lowest)
> 65 and older bachelor’s deg. attainment: 30.6% (15th highest)
> Healthy life expectancy after 65: 14.1 years (22nd lowest)
[recirclink id=488514]

18. Maine
> Pct. of pop. age 65+: 20.0% (2nd highest)
> 65 and older poverty rate: 8.1% (20th lowest)
> 65 and older bachelor’s deg. attainment: 31.0% (14th highest)
> Healthy life expectancy after 65: 14.7 years (16th highest)

19. Oregon
> Pct. of pop. age 65+: 17.1% (12th highest)
> 65 and older poverty rate: 8.7% (22nd highest)
> 65 and older bachelor’s deg. attainment: 31.3% (12th highest)
> Healthy life expectancy after 65: 15.0 years (9th highest)
[in-text-ad-2]

20. Wyoming
> Pct. of pop. age 65+: 15.6% (21st lowest)
> 65 and older poverty rate: 8.4% (22nd lowest)
> 65 and older bachelor’s deg. attainment: 27.3% (25th highest)
> Healthy life expectancy after 65: 14.4 years (24th highest)
21. Nebraska
> Pct. of pop. age 65+: 15.4% (17th lowest)
> 65 and older poverty rate: 7.2% (9th lowest)
> 65 and older bachelor’s deg. attainment: 25.3% (17th lowest)
> Healthy life expectancy after 65: 14.5 years (21st highest)
[in-text-ad]

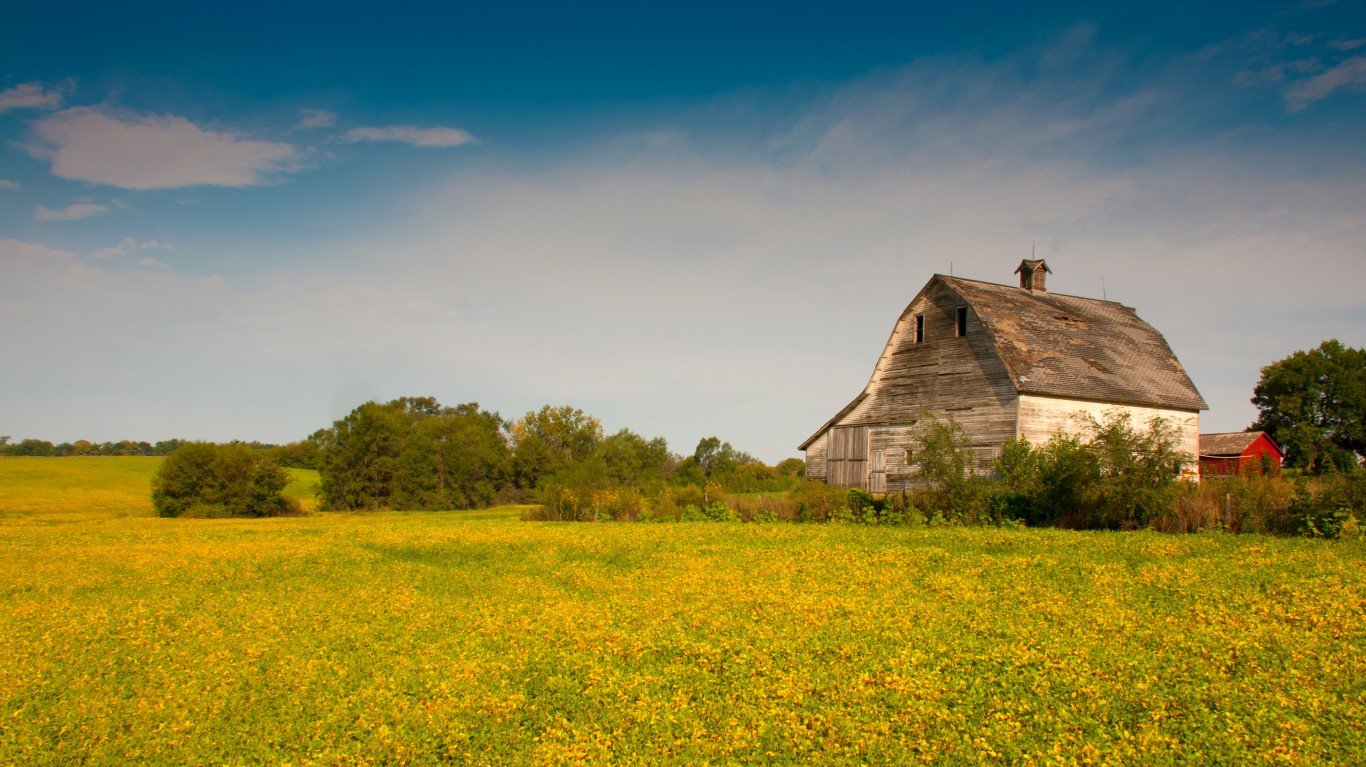
22. Iowa
> Pct. of pop. age 65+: 16.7% (16th highest)
> 65 and older poverty rate: 6.6% (3rd lowest)
> 65 and older bachelor’s deg. attainment: 22.6% (10th lowest)
> Healthy life expectancy after 65: 14.8 years (15th highest)
[recirclink id=488498]

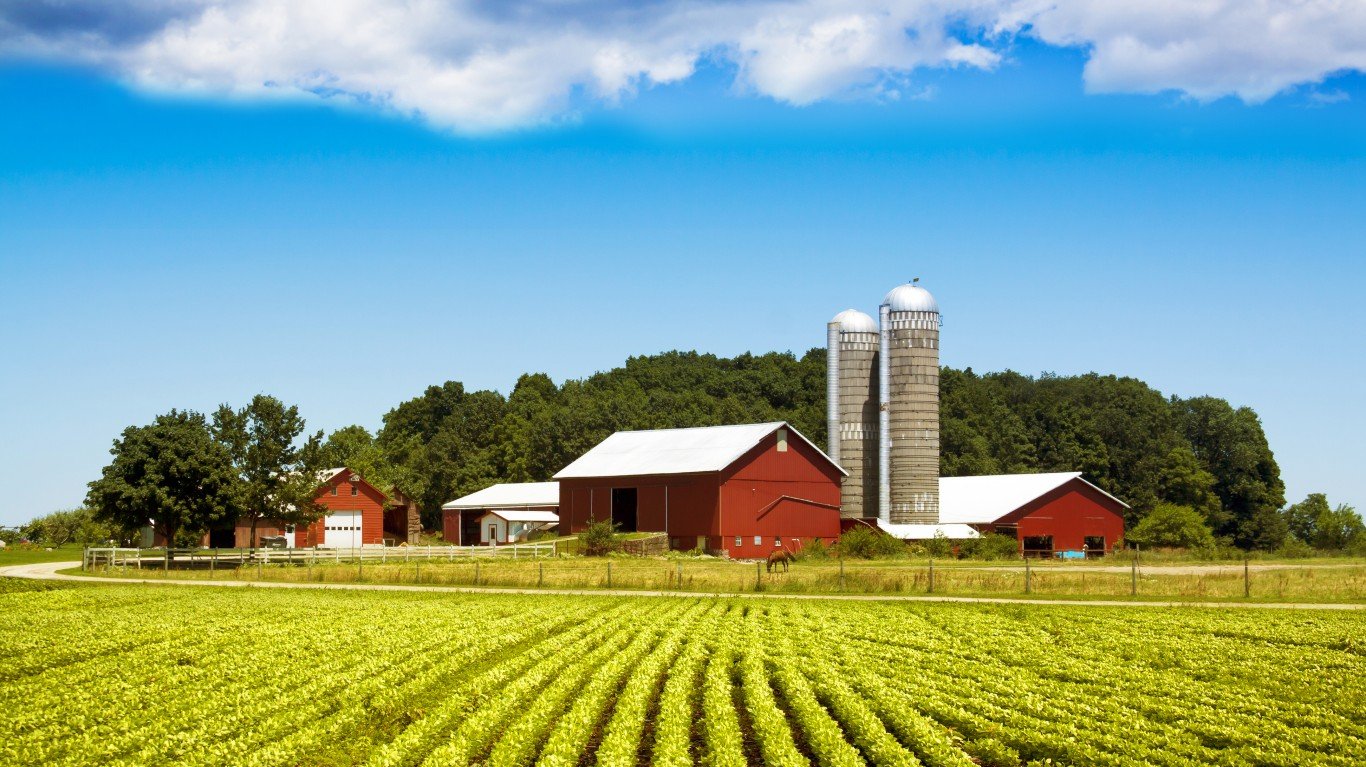
23. Wisconsin
> Pct. of pop. age 65+: 16.5% (21st highest)
> 65 and older poverty rate: 7.8% (15th lowest)
> 65 and older bachelor’s deg. attainment: 24.8% (16th lowest)
> Healthy life expectancy after 65: 14.9 years (14th highest)
24. Illinois
> Pct. of pop. age 65+: 15.2% (12th lowest)
> 65 and older poverty rate: 8.6% (24th highest)
> 65 and older bachelor’s deg. attainment: 27.1% (24th lowest)
> Healthy life expectancy after 65: 13.5 years (16th lowest)
[in-text-ad-2]

25. Rhode Island
> Pct. of pop. age 65+: 16.7% (17th highest)
> 65 and older poverty rate: 9.0% (19th highest)
> 65 and older bachelor’s deg. attainment: 28.4% (24th highest)
> Healthy life expectancy after 65: 14.5 years (21st highest)

26. New York
> Pct. of pop. age 65+: 15.9% (25th lowest)
> 65 and older poverty rate: 11.4% (4th highest)
> 65 and older bachelor’s deg. attainment: 28.5% (22nd highest)
> Healthy life expectancy after 65: 14.5 years (21st highest)
[in-text-ad]

27. Arizona
> Pct. of pop. age 65+: 17.1% (11th highest)
> 65 and older poverty rate: 9.0% (19th highest)
> 65 and older bachelor’s deg. attainment: 29.4% (19th highest)
> Healthy life expectancy after 65: 15.0 years (9th highest)
[recirclink id=488094]
28. North Dakota
> Pct. of pop. age 65+: 14.9% (9th lowest)
> 65 and older poverty rate: 9.9% (12th highest)
> 65 and older bachelor’s deg. attainment: 21.5% (6th lowest)
> Healthy life expectancy after 65: 14.6 years (19th highest)

29. Idaho
> Pct. of pop. age 65+: 15.3% (14th lowest)
> 65 and older poverty rate: 8.1% (20th lowest)
> 65 and older bachelor’s deg. attainment: 25.7% (19th lowest)
> Healthy life expectancy after 65: 14.2 years (25th lowest)
[in-text-ad-2]

30. South Carolina
> Pct. of pop. age 65+: 17.2% (10th highest)
> 65 and older poverty rate: 9.2% (15th highest)
> 65 and older bachelor’s deg. attainment: 27.3% (25th highest)
> Healthy life expectancy after 65: 12.9 years (12th lowest)

31. Ohio
> Pct. of pop. age 65+: 16.6% (18th highest)
> 65 and older poverty rate: 7.7% (13th lowest)
> 65 and older bachelor’s deg. attainment: 22.5% (9th lowest)
> Healthy life expectancy after 65: 13.2 years (15th lowest)
[in-text-ad]
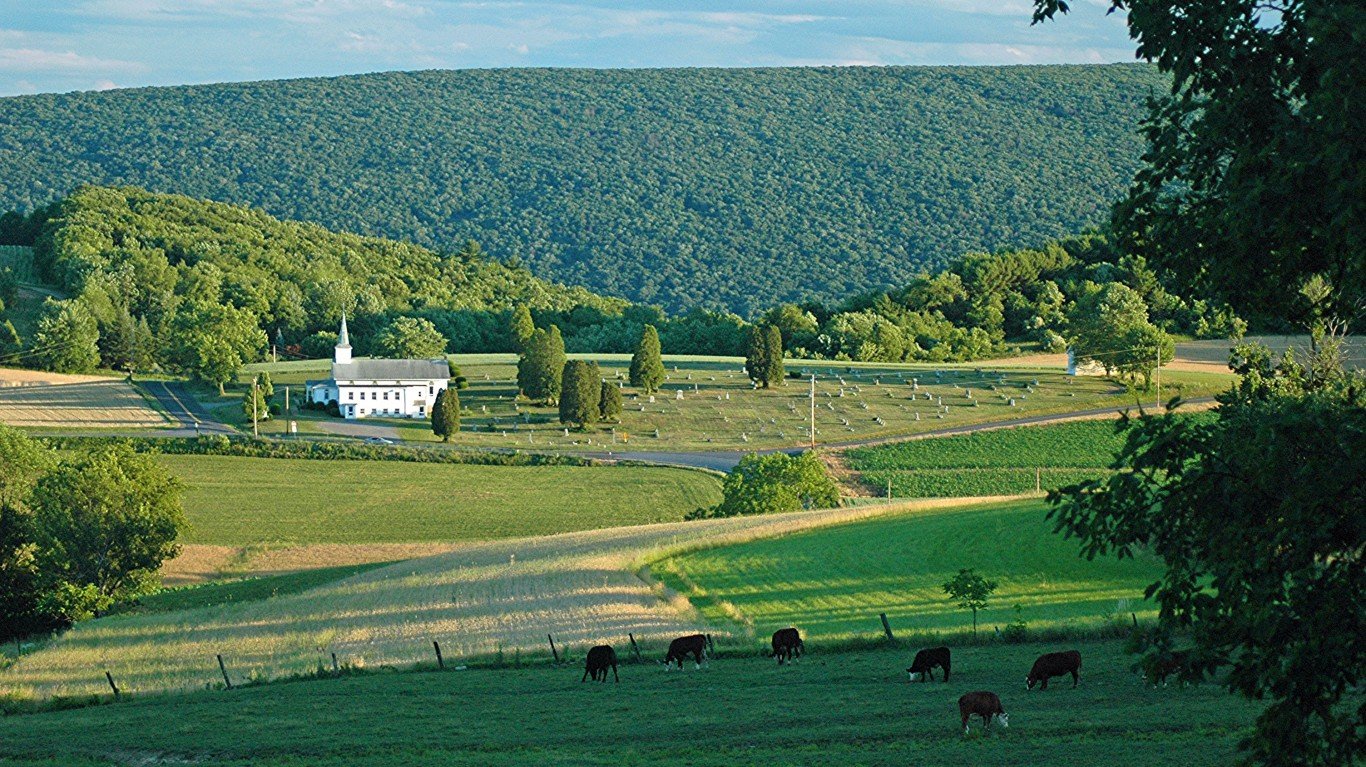
32. Pennsylvania
> Pct. of pop. age 65+: 17.8% (7th highest)
> 65 and older poverty rate: 8.5% (25th highest)
> 65 and older bachelor’s deg. attainment: 24.1% (14th lowest)
> Healthy life expectancy after 65: 13.9 years (20th lowest)
[recirclink id=488247]

33. North Carolina
> Pct. of pop. age 65+: 15.9% (23rd lowest)
> 65 and older poverty rate: 9.1% (17th highest)
> 65 and older bachelor’s deg. attainment: 26.0% (22nd lowest)
> Healthy life expectancy after 65: 12.7 years (10th lowest)

34. Michigan
> Pct. of pop. age 65+: 16.7% (15th highest)
> 65 and older poverty rate: 8.5% (25th highest)
> 65 and older bachelor’s deg. attainment: 24.4% (15th lowest)
> Healthy life expectancy after 65: 13.9 years (20th lowest)
[in-text-ad-2]

35. California
> Pct. of pop. age 65+: 13.9% (6th lowest)
> 65 and older poverty rate: 10.2% (7th highest)
> 65 and older bachelor’s deg. attainment: 31.3% (12th highest)
> Healthy life expectancy after 65: 14.7 years (16th highest)

36. Florida
> Pct. of pop. age 65+: 20.1% (the highest)
> 65 and older poverty rate: 10.2% (7th highest)
> 65 and older bachelor’s deg. attainment: 28.5% (22nd highest)
> Healthy life expectancy after 65: 15.4 years (4th highest)
[in-text-ad]

37. Georgia
> Pct. of pop. age 65+: 13.4% (4th lowest)
> 65 and older poverty rate: 10.1% (11th highest)
> 65 and older bachelor’s deg. attainment: 25.8% (20th lowest)
> Healthy life expectancy after 65: 12.4 years (9th lowest)
[recirclink id=488174]
38. Indiana
> Pct. of pop. age 65+: 15.4% (16th lowest)
> 65 and older poverty rate: 7.7% (13th lowest)
> 65 and older bachelor’s deg. attainment: 21.6% (7th lowest)
> Healthy life expectancy after 65: 13.2 years (15th lowest)

39. Nevada
> Pct. of pop. age 65+: 15.3% (15th lowest)
> 65 and older poverty rate: 8.5% (25th highest)
> 65 and older bachelor’s deg. attainment: 25.9% (21st lowest)
> Healthy life expectancy after 65: 13.7 years (17th lowest)
[in-text-ad-2]

40. Missouri
> Pct. of pop. age 65+: 16.5% (20th highest)
> 65 and older poverty rate: 8.7% (22nd highest)
> 65 and older bachelor’s deg. attainment: 22.9% (12th lowest)
> Healthy life expectancy after 65: 13.0 years (13th lowest)

41. New Mexico
> Pct. of pop. age 65+: 16.8% (13th highest)
> 65 and older poverty rate: 12.2% (2nd highest)
> 65 and older bachelor’s deg. attainment: 30.4% (17th highest)
> Healthy life expectancy after 65: 13.9 years (20th lowest)
[in-text-ad]

42. Texas
> Pct. of pop. age 65+: 12.2% (3rd lowest)
> 65 and older poverty rate: 10.8% (5th highest)
> 65 and older bachelor’s deg. attainment: 27.0% (23rd lowest)
> Healthy life expectancy after 65: 12.9 years (12th lowest)
[recirclink id=487977]
43. Oklahoma
> Pct. of pop. age 65+: 15.3% (13th lowest)
> 65 and older poverty rate: 9.1% (17th highest)
> 65 and older bachelor’s deg. attainment: 23.8% (13th lowest)
> Healthy life expectancy after 65: 12.0 years (7th lowest)

44. Tennessee
> Pct. of pop. age 65+: 15.9% (25th highest)
> 65 and older poverty rate: 9.2% (15th highest)
> 65 and older bachelor’s deg. attainment: 22.9% (12th lowest)
> Healthy life expectancy after 65: 11.9 years (5th lowest)
[in-text-ad-2]
45. Alabama
> Pct. of pop. age 65+: 16.5% (22nd highest)
> 65 and older poverty rate: 9.9% (12th highest)
> 65 and older bachelor’s deg. attainment: 22.1% (8th lowest)
> Healthy life expectancy after 65: 11.1 years (4th lowest)

46. Kentucky
> Pct. of pop. age 65+: 15.9% (24th lowest)
> 65 and older poverty rate: 10.3% (6th highest)
> 65 and older bachelor’s deg. attainment: 19.3% (2nd lowest)
> Healthy life expectancy after 65: 11.0 years (3rd lowest)
[in-text-ad]

47. Louisiana
> Pct. of pop. age 65+: 14.9% (7th lowest)
> 65 and older poverty rate: 12.0% (3rd highest)
> 65 and older bachelor’s deg. attainment: 21.0% (5th lowest)
> Healthy life expectancy after 65: 12.0 years (7th lowest)
[recirclink id=487572]
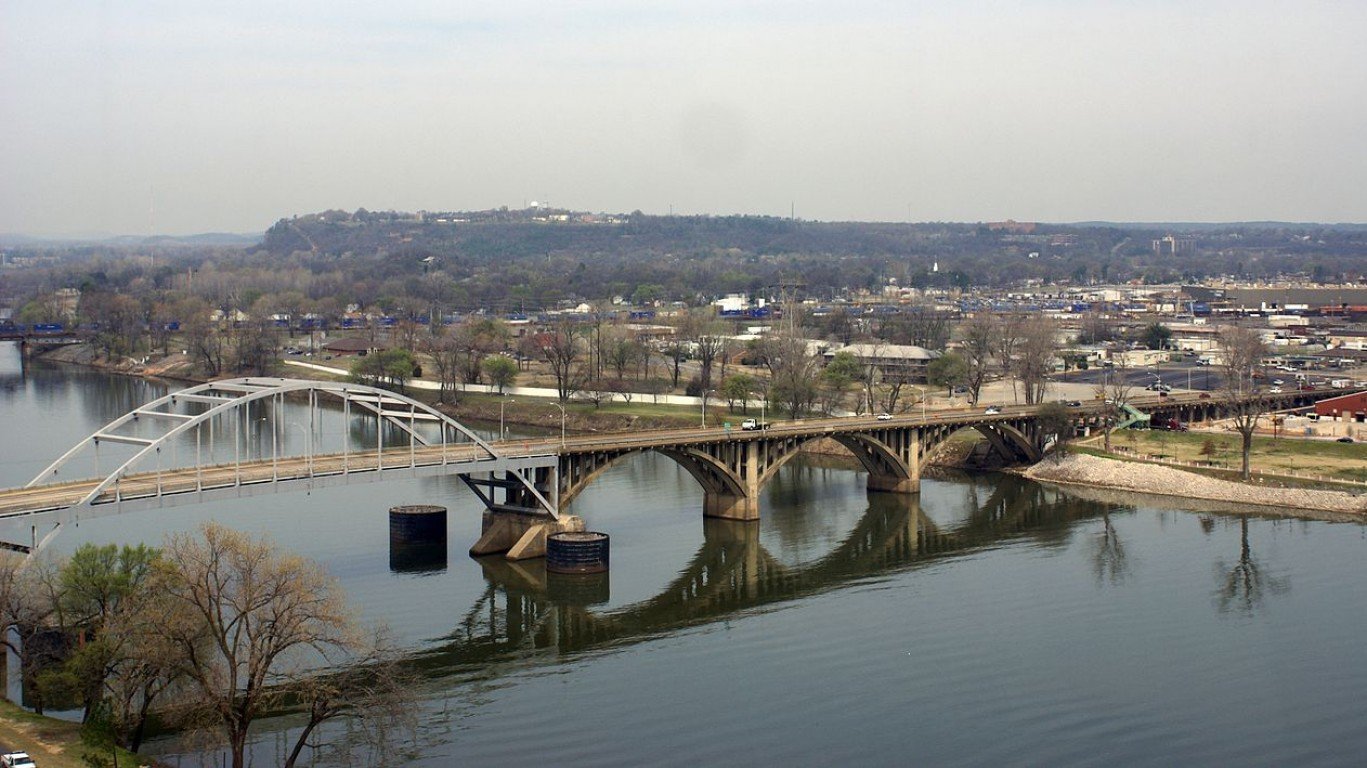
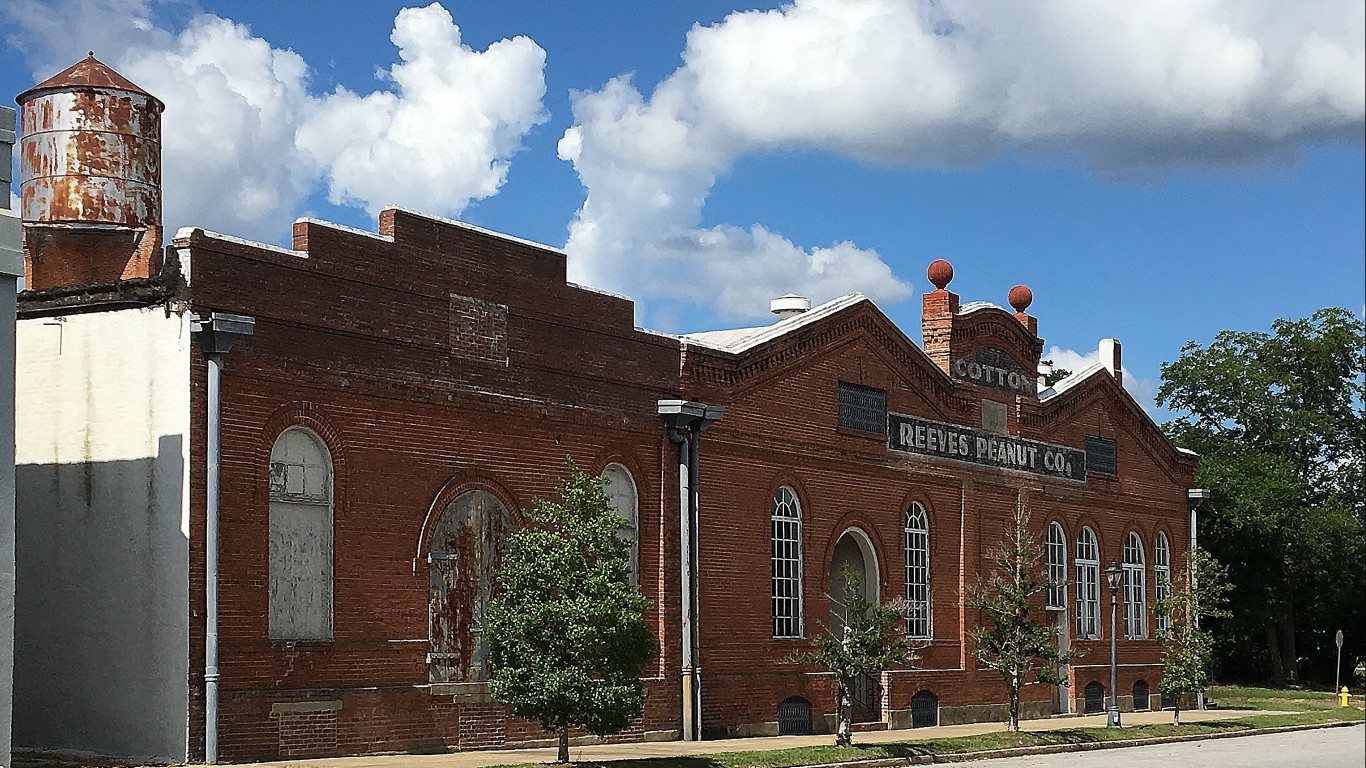
48. Arkansas
> Pct. of pop. age 65+: 16.5% (19th highest)
> 65 and older poverty rate: 10.2% (7th highest)
> 65 and older bachelor’s deg. attainment: 20.4% (4th lowest)
> Healthy life expectancy after 65: 12.2 years (8th lowest)
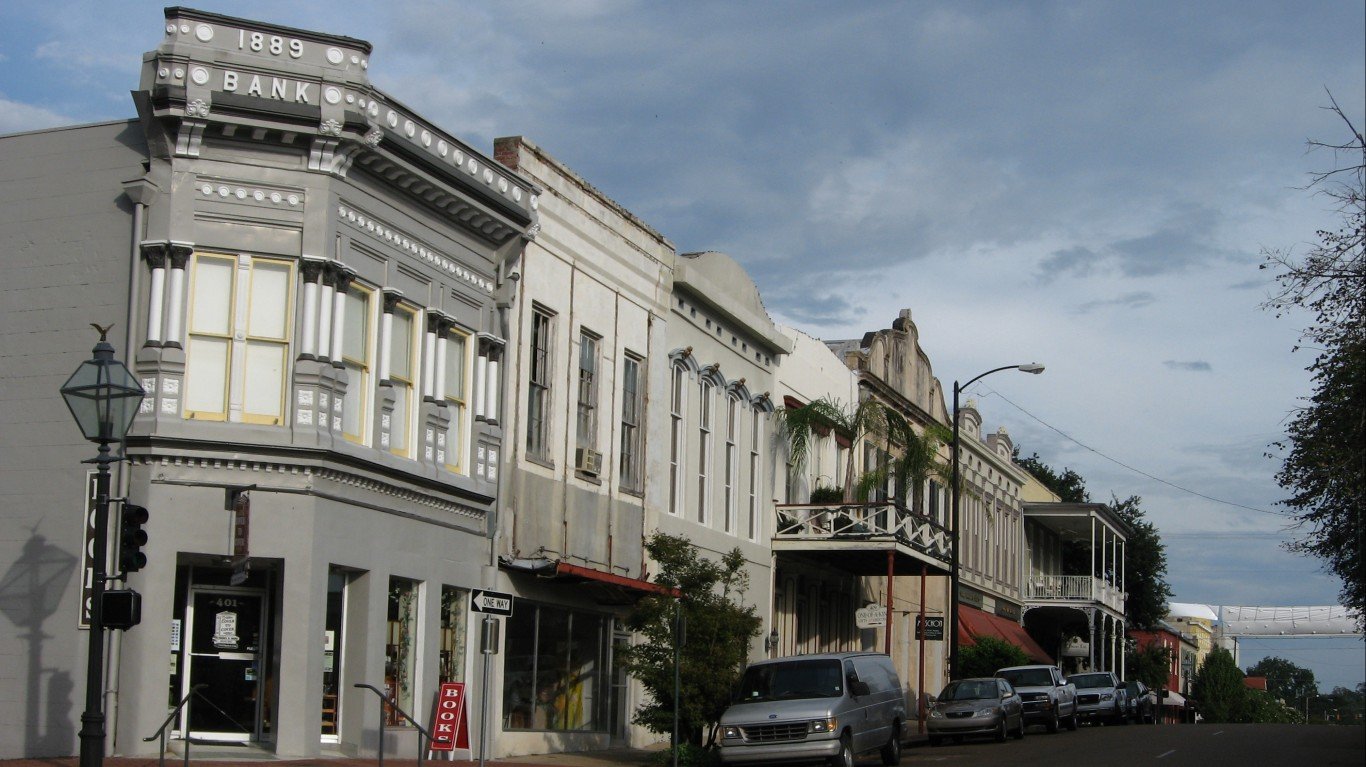
49. Mississippi
> Pct. of pop. age 65+: 15.6% (20th lowest)
> 65 and older poverty rate: 13.7% (the highest)
> 65 and older bachelor’s deg. attainment: 19.9% (3rd lowest)
> Healthy life expectancy after 65: 10.8 years (the lowest)
[in-text-ad-2]

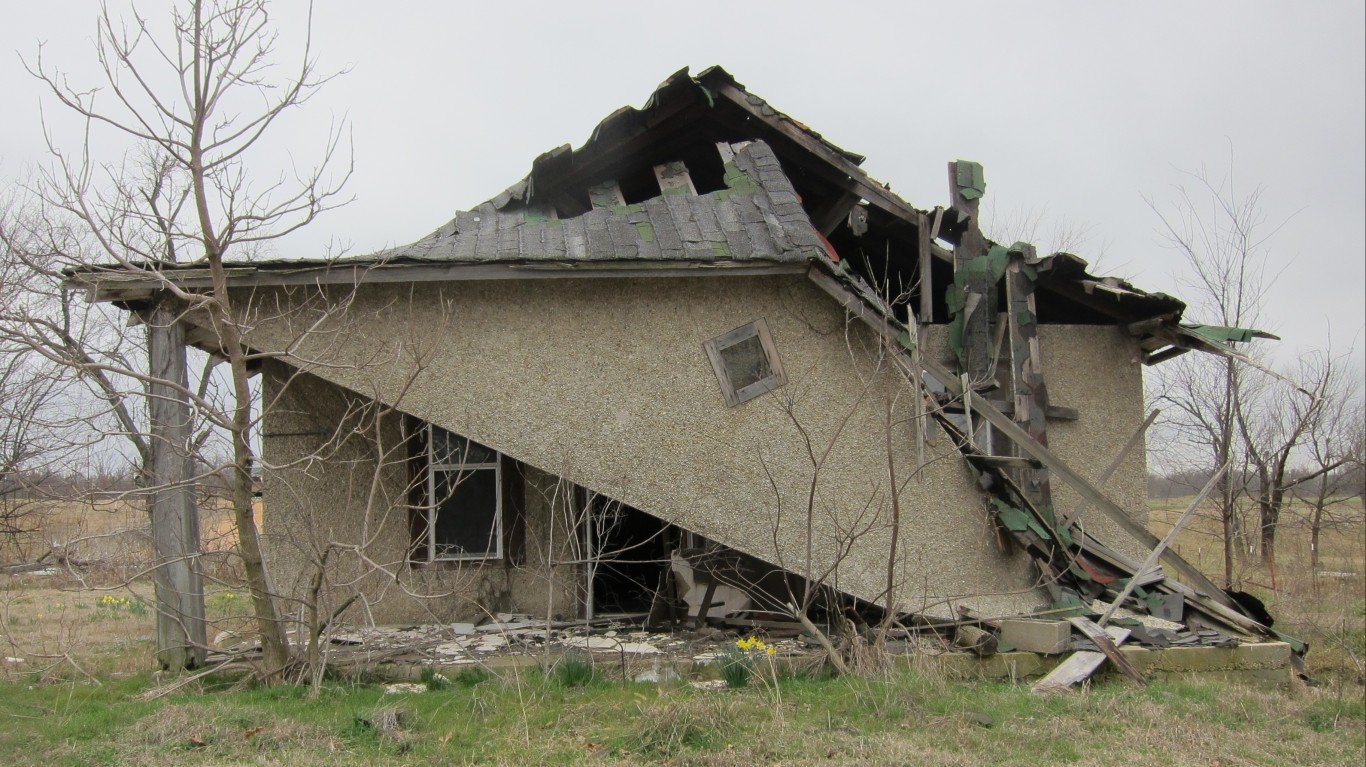
50. West Virginia
> Pct. of pop. age 65+: 19.3% (3rd highest)
> 65 and older poverty rate: 10.2% (7th highest)
> 65 and older bachelor’s deg. attainment: 17.1% (the lowest)
> Healthy life expectancy after 65: 11.0 years (3rd lowest)
Methodology
To determine the best and worst states in which to grow old, 24/7 Wall St. reviewed several statewide as well as elderly population-specific data. The data includes income, health, education, and environment and access. We created an index of the various measures for each of these four broad categories. The geometric mean of the four index values was used to rank states.
To construct the indices we used the min-max normalization method. For reference, a similar methodology was used in constructing HelpAge International’s Global AgeWatch Index and the United Nation’s Human Development Index.
Income
The percentage of elderly households with supplemental retirement income as well as poverty rates and median household income for the 65 and over population are one-year estimates from the U.S. Census Bureau’s 2017 American Community Survey. Additionally, as a measure of cost of living, we considered regional price parity from the Bureau of Economic Analysis.
Health
The percentage of non-institutionalized people 65 and over with a disability came from the Census. We also included healthy life expectancy after the age of 65 from the the Centers for Disease Control and Prevention for 2007-2009; the percentage of adults who reported having a personal doctor in 2014 from the Kaiser Family Foundation; and the 2017 crude elderly mortality rate per 100,000 people 65 and over in each state, also from the CDC.
Education
The share of people 65 and over with a bachelor’s degree or higher came from the ACS.
Environment and Access
2017 violent crime rates from the FBI’s Uniform Crime Report, and the share of workers who walk or use public transportation is from the ACS. The concentration of social establishments — restaurants, libraries, civic organizations, among others — as well as the number of hospitals in the state came from County Business Patterns and are for 2016.
Contact [email protected] for any questions or corrections.