Military equipment and services imports increased sharply in some regions of the world. For some nations dialing up arms purchases, the surge is related to modernization efforts, or at offsetting reductions in domestic arms production, or other relatively harmless reasons. In other cases, the rationales for purchasing more arms are more troubling.
The largest drivers of increases in arms transfers are armed conflicts, according to Aude Fleurant, director of the arms and military expenditure programme with the Stockholm International Peace Research Institute (SIPRI). The Middle East is at present one of the most volatile regions on Earth, and it is also the world’s largest recipient of arms transfers.
Active conflicts are ongoing in Syria, Yemen, and in Libya, involving terrorist organizations. There are also significant tensions between Qatar and the three nations of Saudi Arabia, the UAE, and Israel, as well as between other countries in the region. “There are significant tensions between Iran and with mostly all the countries in the region,” said Fleurant.
The Middle East nations of Kuwait, Qatar, Oman, Egypt, Saudi Arabia, and Iraq all more than doubled major arms imports between the periods of 2009-13 and 2014-18.
Vast networks of alliances and trade deals create ripple effects rooted in these conflicts. Conflicts in Syria for instance, involve Russia as Syria’s ally. Another example is Australia, which started its military submarine program only this past year, largely because of its concerns over China’s increasing underwater capabilities.
To identify the countries dialing up arms purchases, 24/7 Wall St. reviewed the 26 countries with the largest increases in the total value of major arms imports between the five-year periods of 2009-13 and 2014-18 from the report on major arms export volumes published by the Stockholm International Peace Research Institute (SIPRI). Each country’s main supplier, all major arms import and export data, as well as annual military expenditures in 2017, also came from SIPRI. Each country’s GDP per capita in 2016 came from the World Bank.
Click here to see the countries that are increasing their weapons stockpiles the fastest.
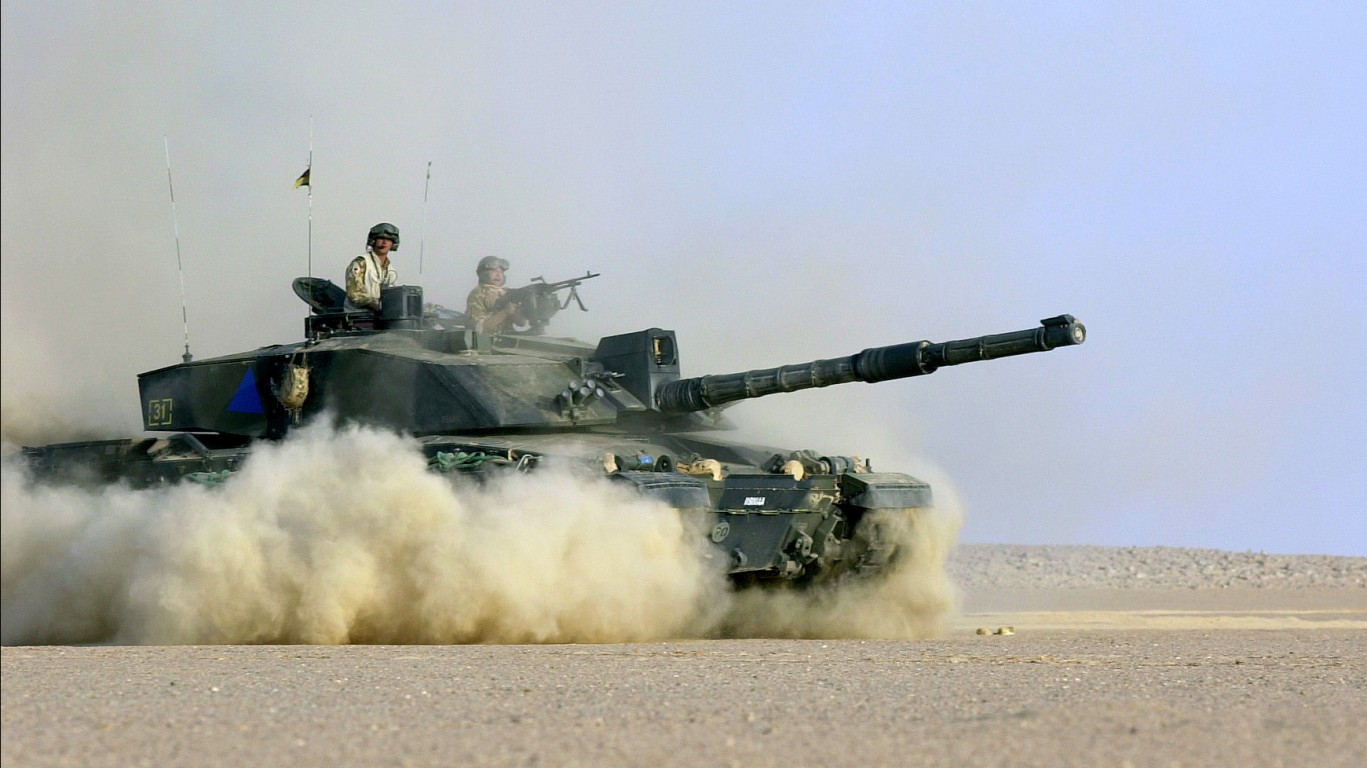
26. United Kingdom
> Change from 2009-13 to 2014-18: +2.3%
> Share of global arms imports (2014-18): 1.6%
> Share of global arms imports (2009-13): 1.7%
> Main supplier, share of importer’s total imports: USA, 71%
> GDP per capita: $39,753
[in-text-ad]
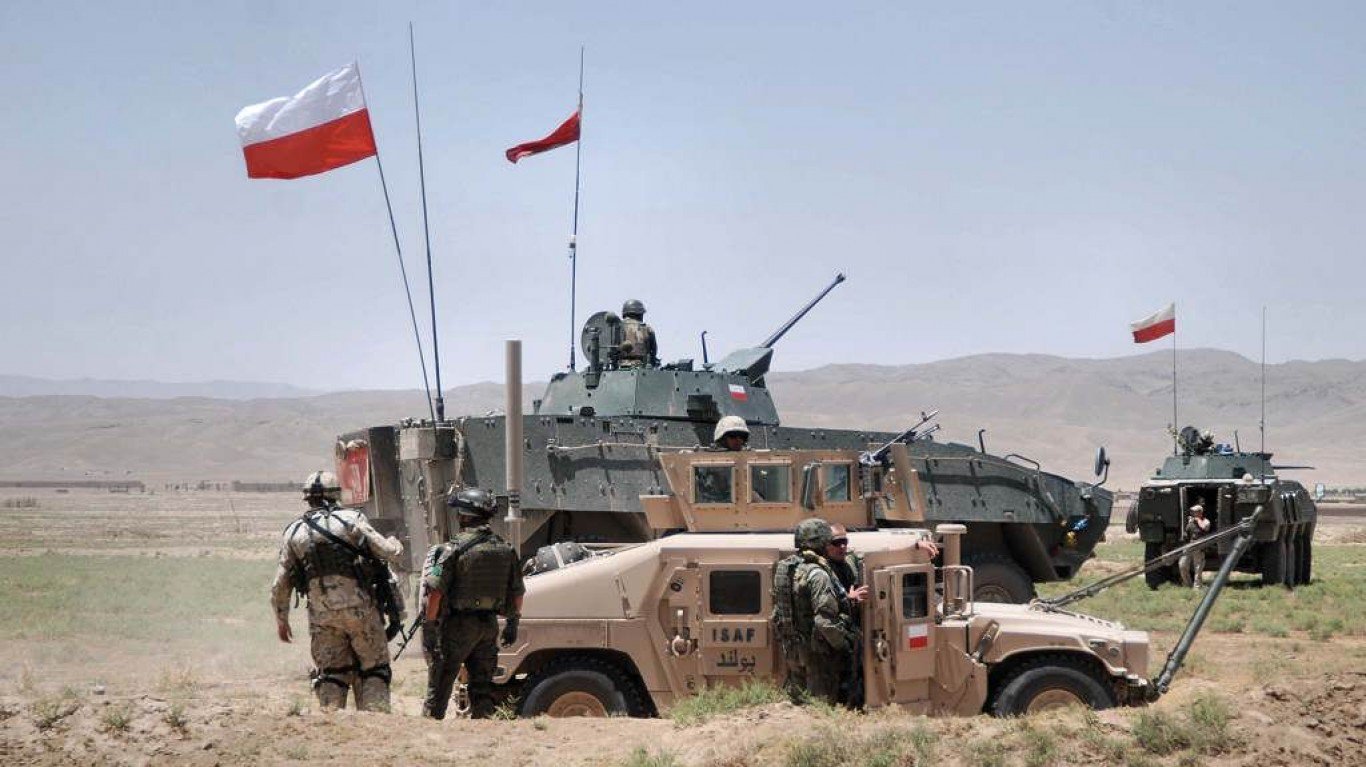
25. Poland
> Change from 2009-13 to 2014-18: +2.5%
> Share of global arms imports (2014-18): 0.6%
> Share of global arms imports (2009-13): 0.6%
> Main supplier, share of importer’s total imports: Germany, 28%
> GDP per capita: $27,343
[recirclink id=488456]
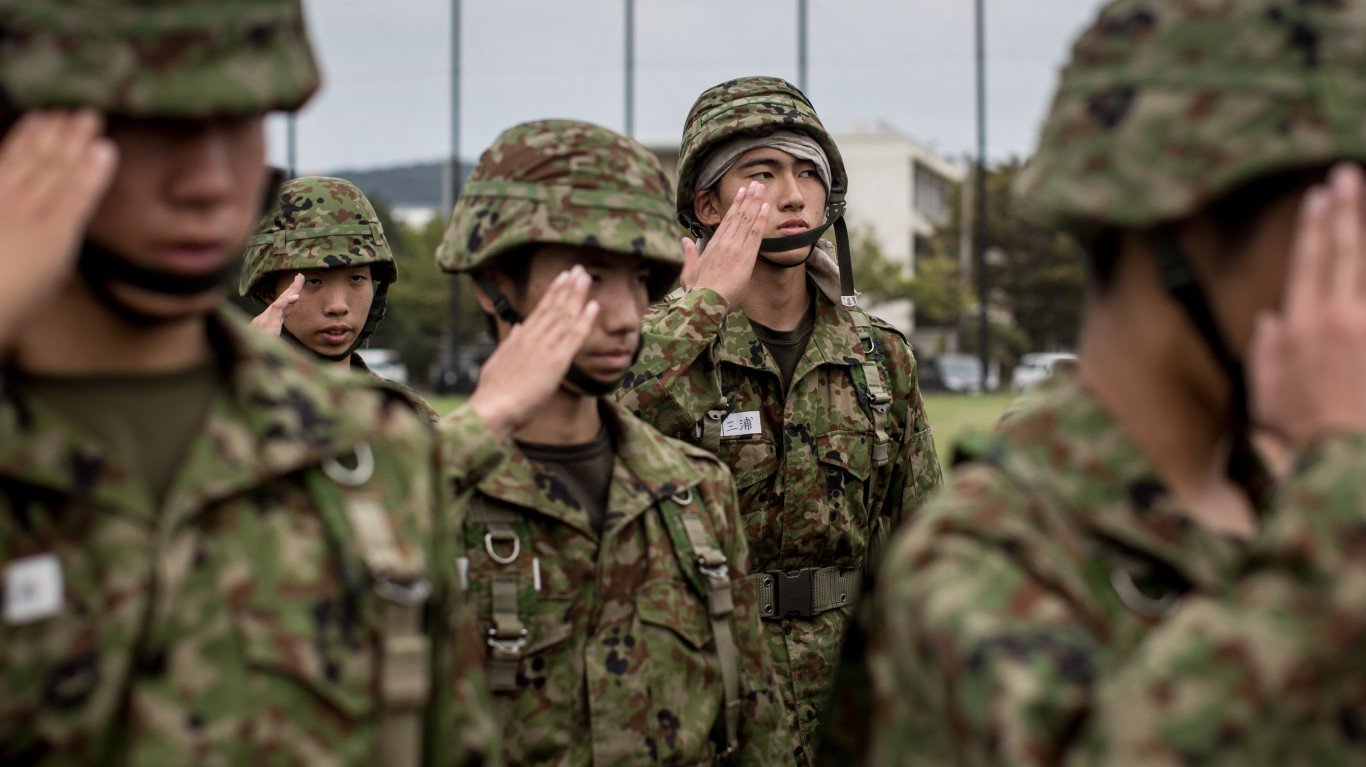
24. Japan
> Change from 2009-13 to 2014-18: +15.0%
> Share of global arms imports (2014-18): 1.4%
> Share of global arms imports (2009-13): 1.3%
> Main supplier, share of importer’s total imports: USA, 95%
> GDP per capita: $39,002
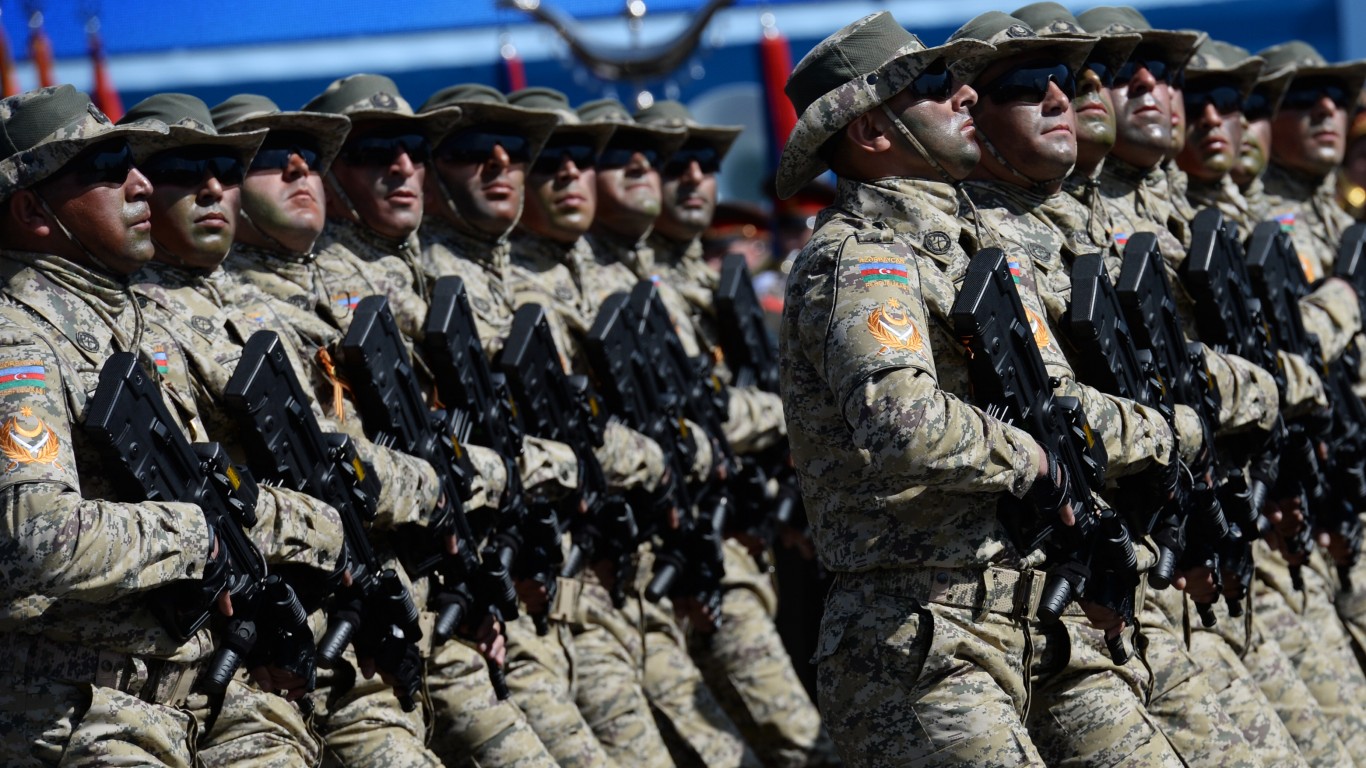
23. Azerbaijan
> Change from 2009-13 to 2014-18: +15.0%
> Share of global arms imports (2014-18): 1.3%
> Share of global arms imports (2009-13): 1.2%
> Main supplier, share of importer’s total imports: Russia, 51%
> GDP per capita: $15,847
[in-text-ad-2]
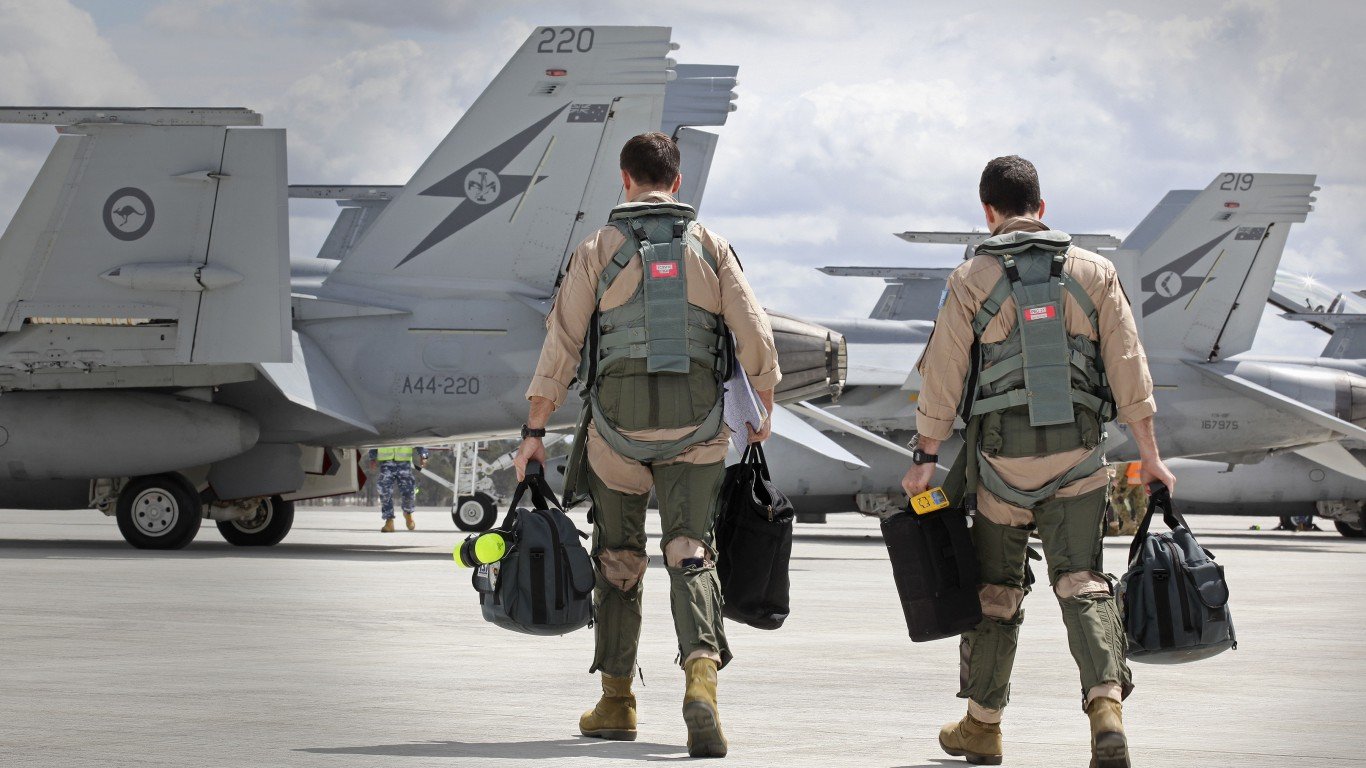
22. Australia
> Change from 2009-13 to 2014-18: +37.0%
> Share of global arms imports (2014-18): 4.6%
> Share of global arms imports (2009-13): 3.6%
> Main supplier, share of importer’s total imports: USA, 60%
> GDP per capita: $44,649
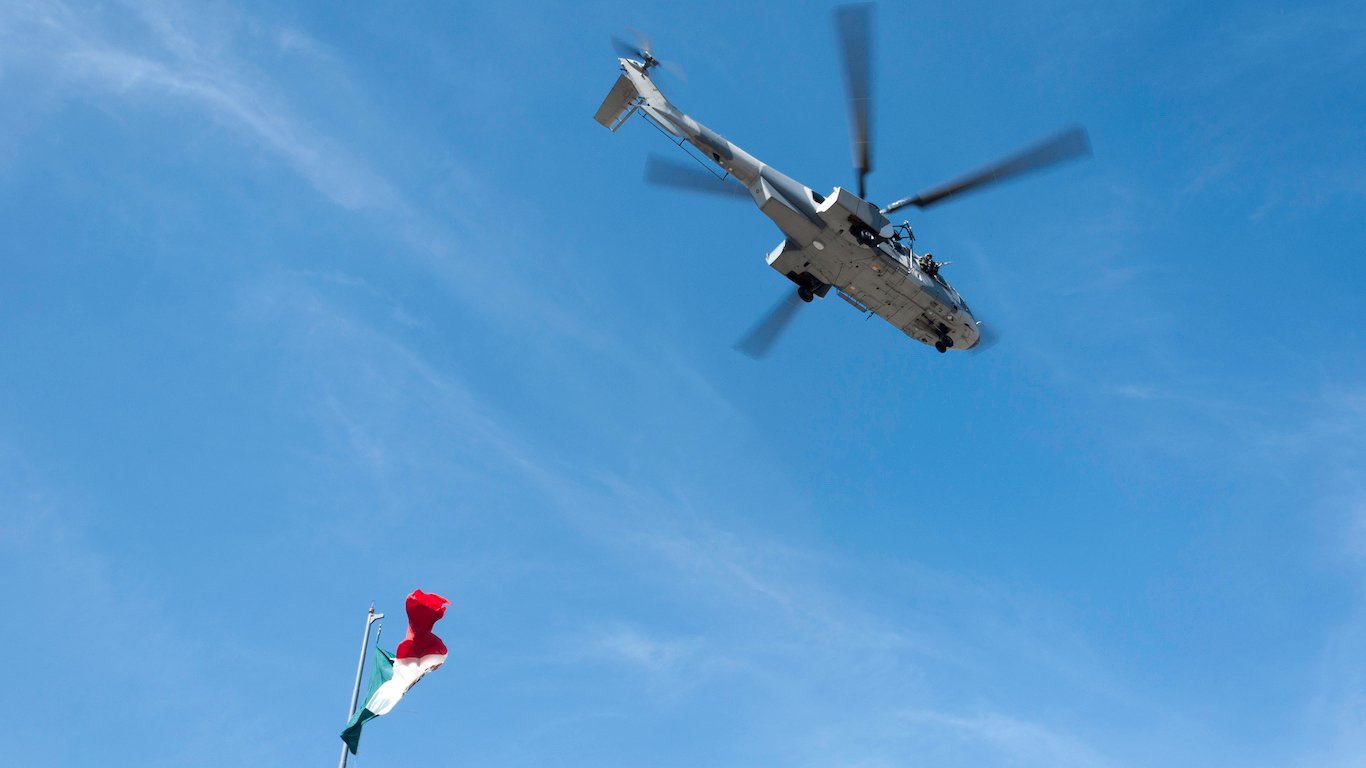
21. Mexico
> Change from 2009-13 to 2014-18: +40.0%
> Share of global arms imports (2014-18): 0.7%
> Share of global arms imports (2009-13): 0.5%
> Main supplier, share of importer’s total imports: USA, 63%
> GDP per capita: $17,331
[in-text-ad]
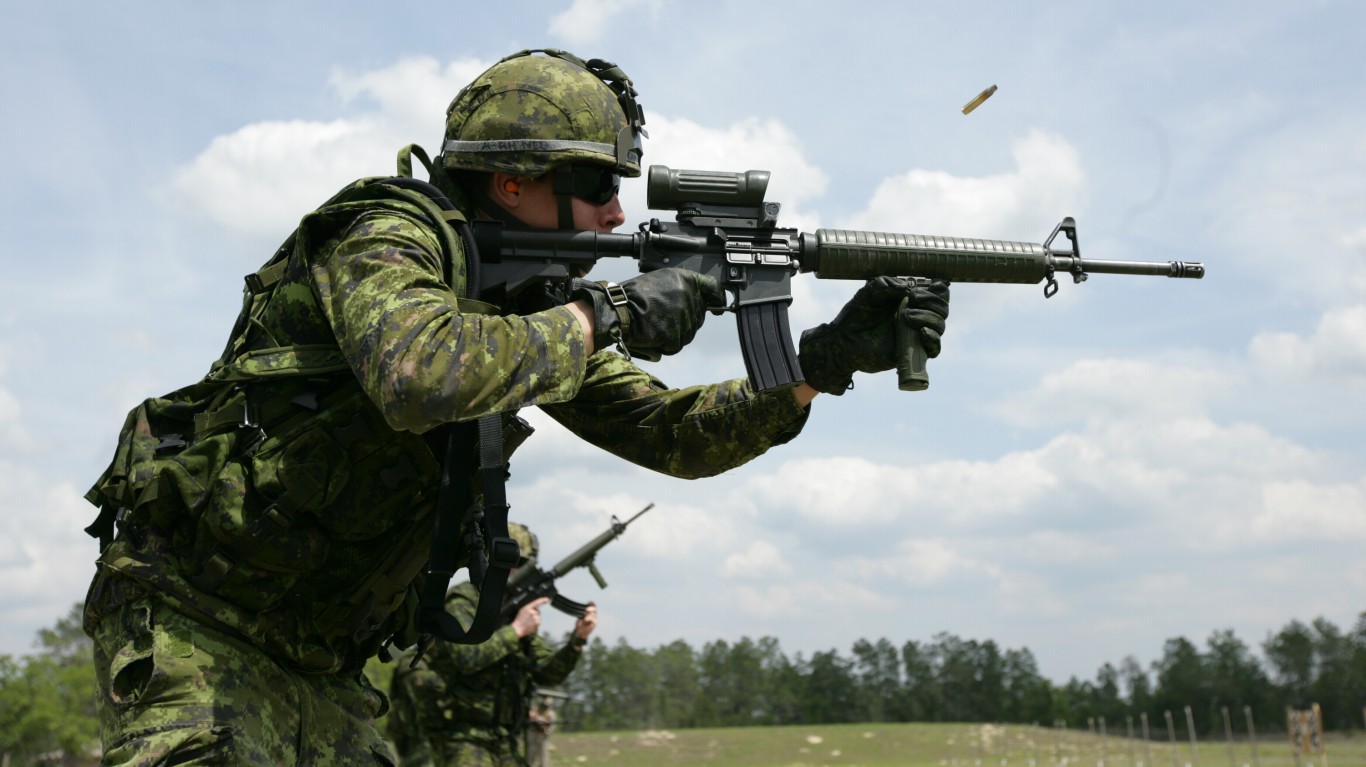
20. Canada
> Change from 2009-13 to 2014-18: +42.0%
> Share of global arms imports (2014-18): 1.0%
> Share of global arms imports (2009-13): 0.8%
> Main supplier, share of importer’s total imports: USA, 63%
> GDP per capita: $44,018
[recirclink id=488594]

19. Thailand
> Change from 2009-13 to 2014-18: +46.0%
> Share of global arms imports (2014-18): 1.0%
> Share of global arms imports (2009-13): 0.7%
> Main supplier, share of importer’s total imports: South Korea, 20%
> GDP per capita: $16,279
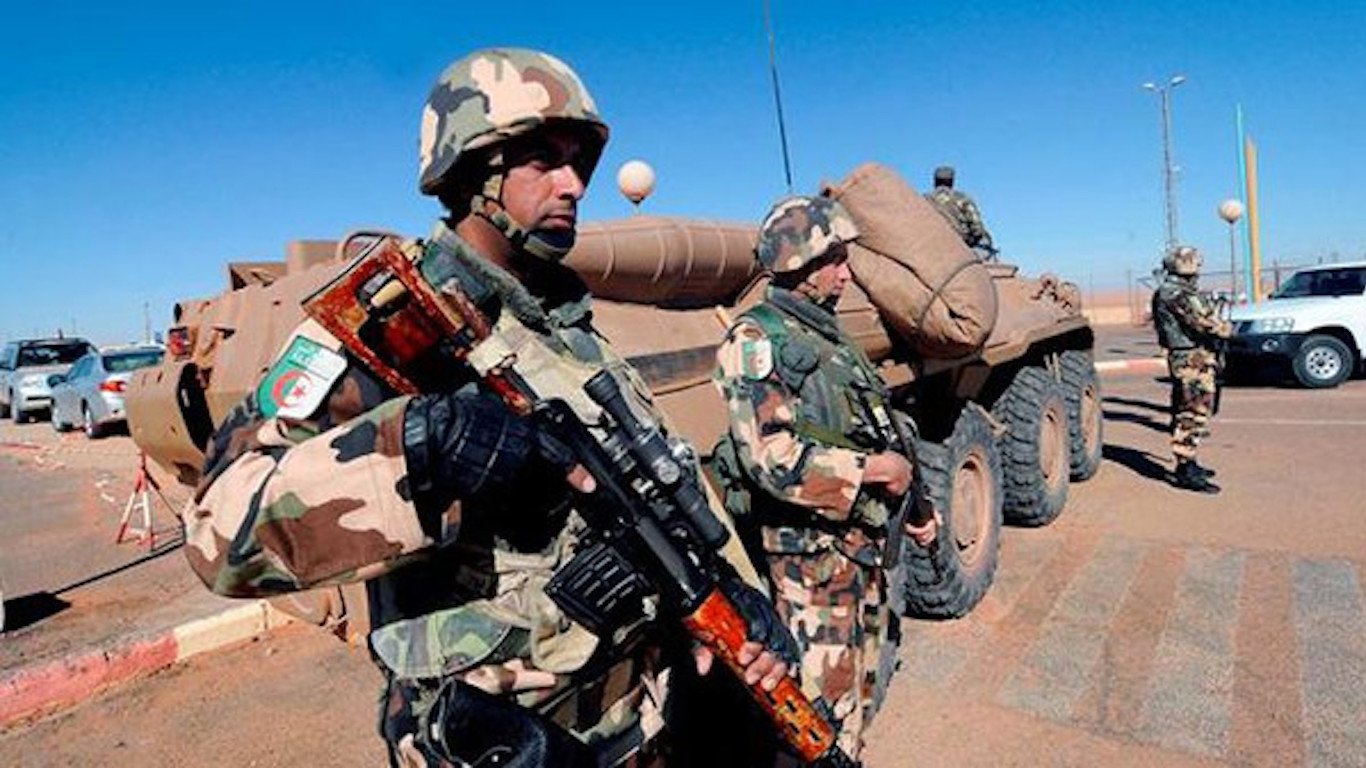
18. Algeria
> Change from 2009-13 to 2014-18: +55.0%
> Share of global arms imports (2014-18): 4.4%
> Share of global arms imports (2009-13): 3.1%
> Main supplier, share of importer’s total imports: Russia, 66%
> GDP per capita: $13,900
[in-text-ad-2]
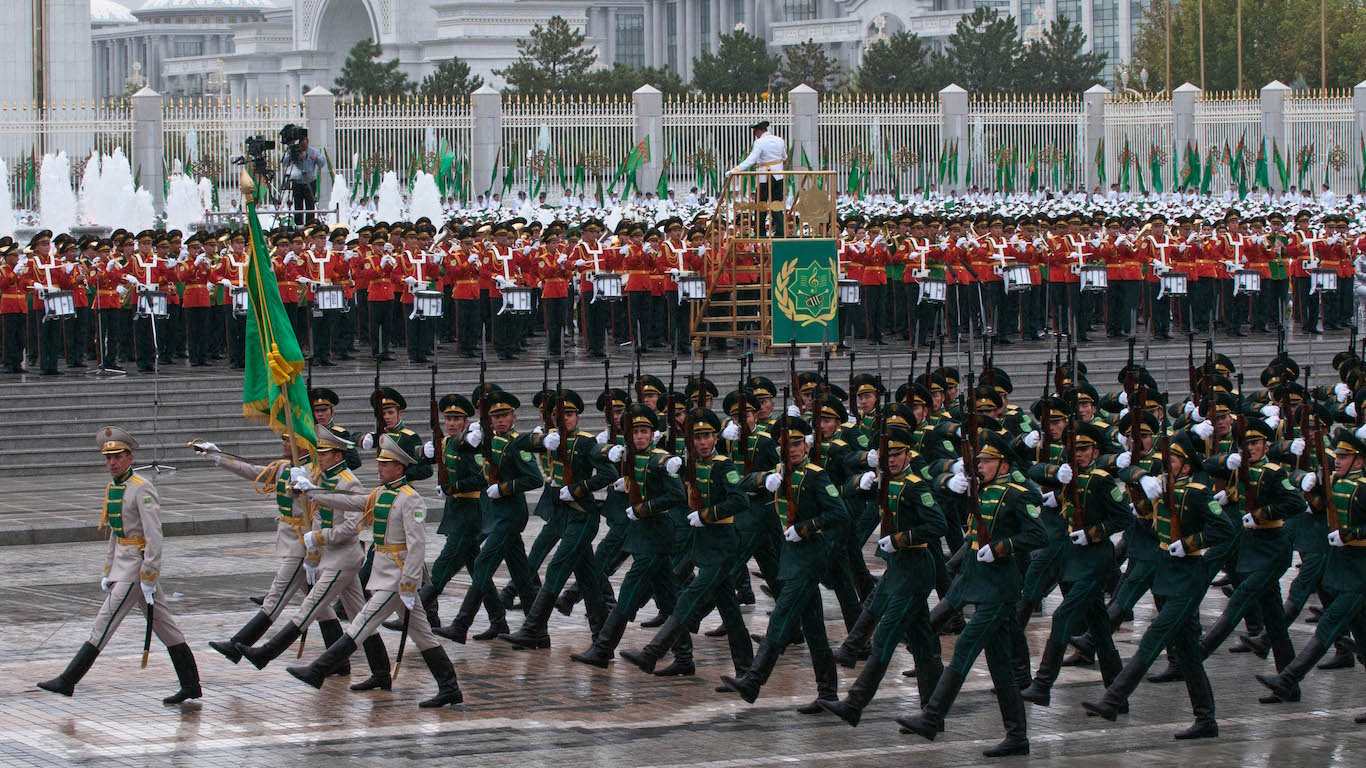
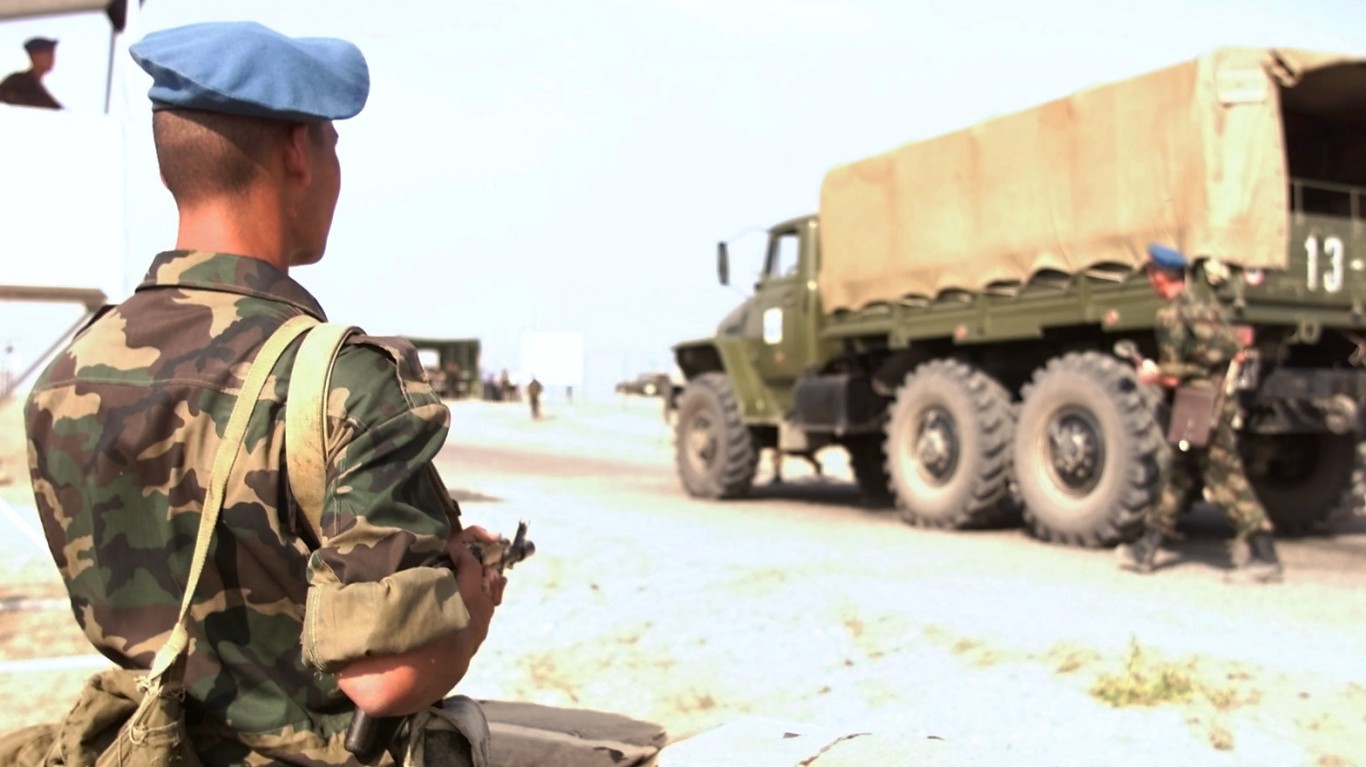
17. Turkmenistan
> Change from 2009-13 to 2014-18: +59.0%
> Share of global arms imports (2014-18): 0.5%
> Share of global arms imports (2009-13): 0.4%
> Main supplier, share of importer’s total imports: Turkey, 43%
> GDP per capita: $16,389
16. Jordan
> Change from 2009-13 to 2014-18: +61.0%
> Share of global arms imports (2014-18): 0.9%
> Share of global arms imports (2009-13): 0.6%
> Main supplier, share of importer’s total imports: Netherlands, 37%
> GDP per capita: $8,337
[in-text-ad]
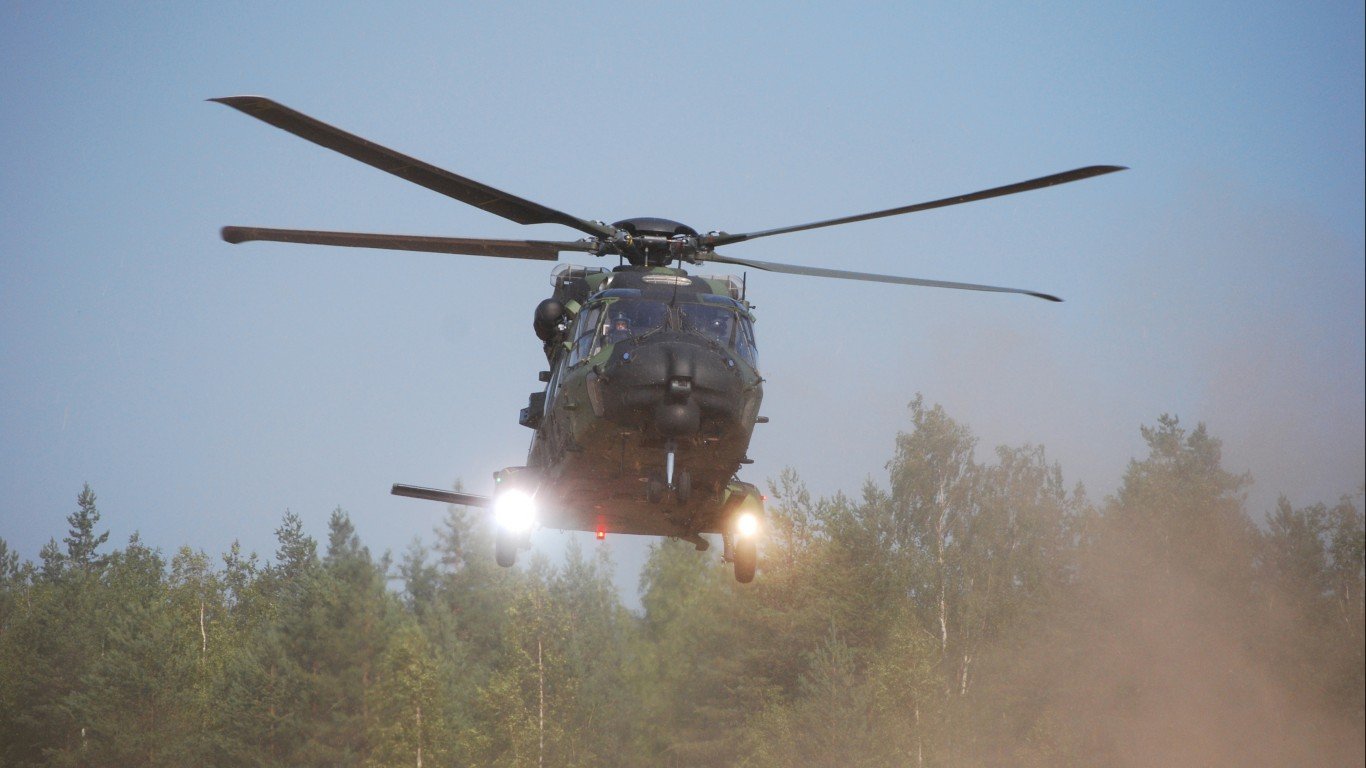
15. Finland
> Change from 2009-13 to 2014-18: +64.0%
> Share of global arms imports (2014-18): 0.6%
> Share of global arms imports (2009-13): 0.4%
> Main supplier, share of importer’s total imports: USA, 37%
> GDP per capita: $40,586
[recirclink id=488561]

14. Bangladesh
> Change from 2009-13 to 2014-18: +75.0%
> Share of global arms imports (2014-18): 1.2%
> Share of global arms imports (2009-13): 0.7%
> Main supplier, share of importer’s total imports: China, 70%
> GDP per capita: $3,524
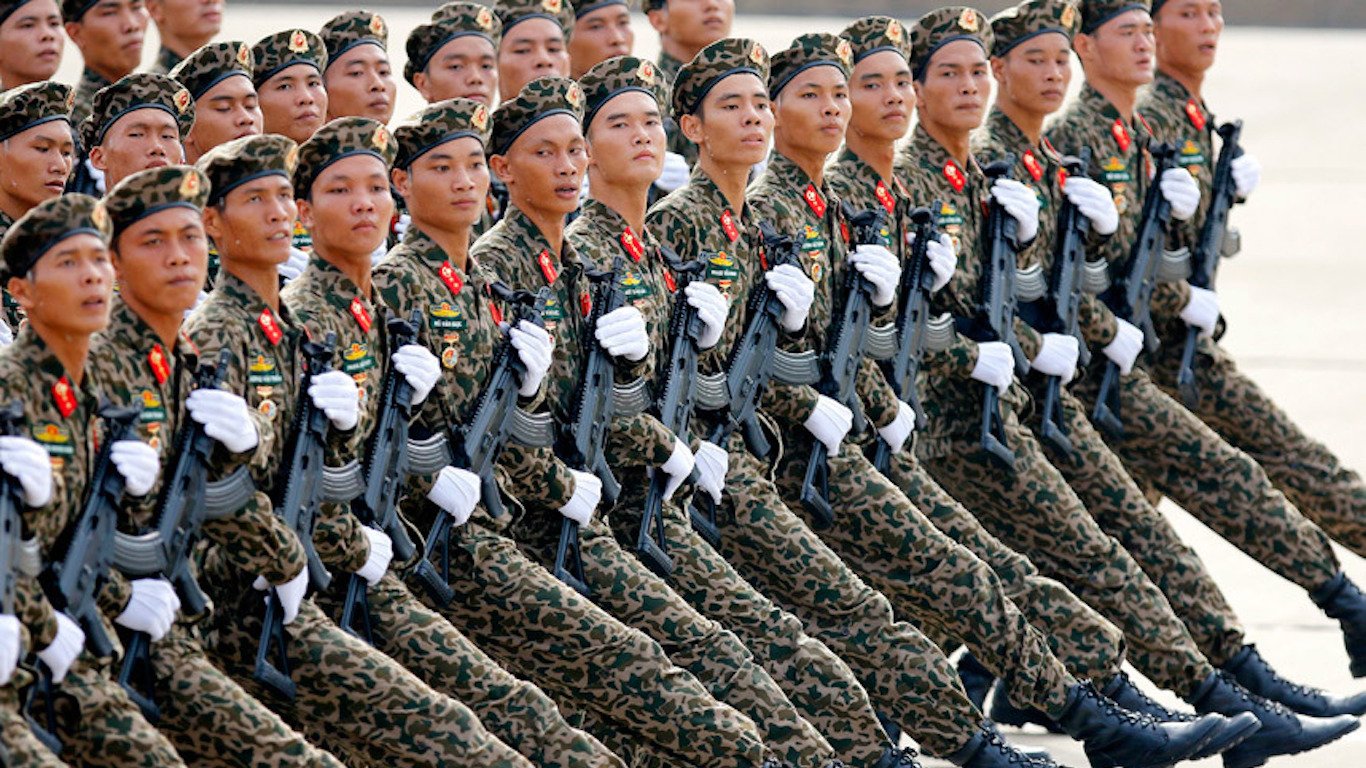
13. Vietnam
> Change from 2009-13 to 2014-18: +78.0%
> Share of global arms imports (2014-18): 2.9%
> Share of global arms imports (2009-13): 1.8%
> Main supplier, share of importer’s total imports: Russia, 78%
> GDP per capita: $6,172
[in-text-ad-2]
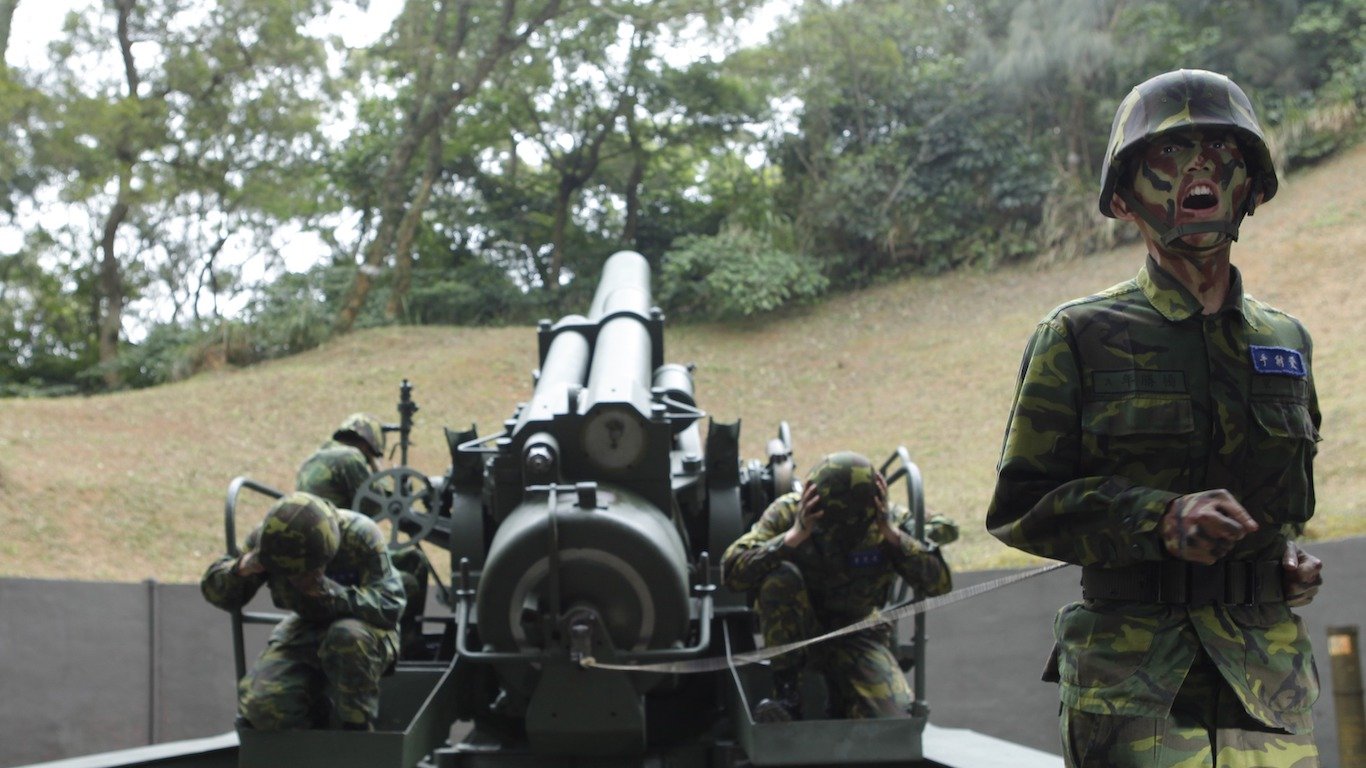
12. Taiwan
> Change from 2009-13 to 2014-18: +83.0%
> Share of global arms imports (2014-18): 1.7%
> Share of global arms imports (2009-13): 1.0%
> Main supplier, share of importer’s total imports: USA, 100%
> GDP per capita: $00
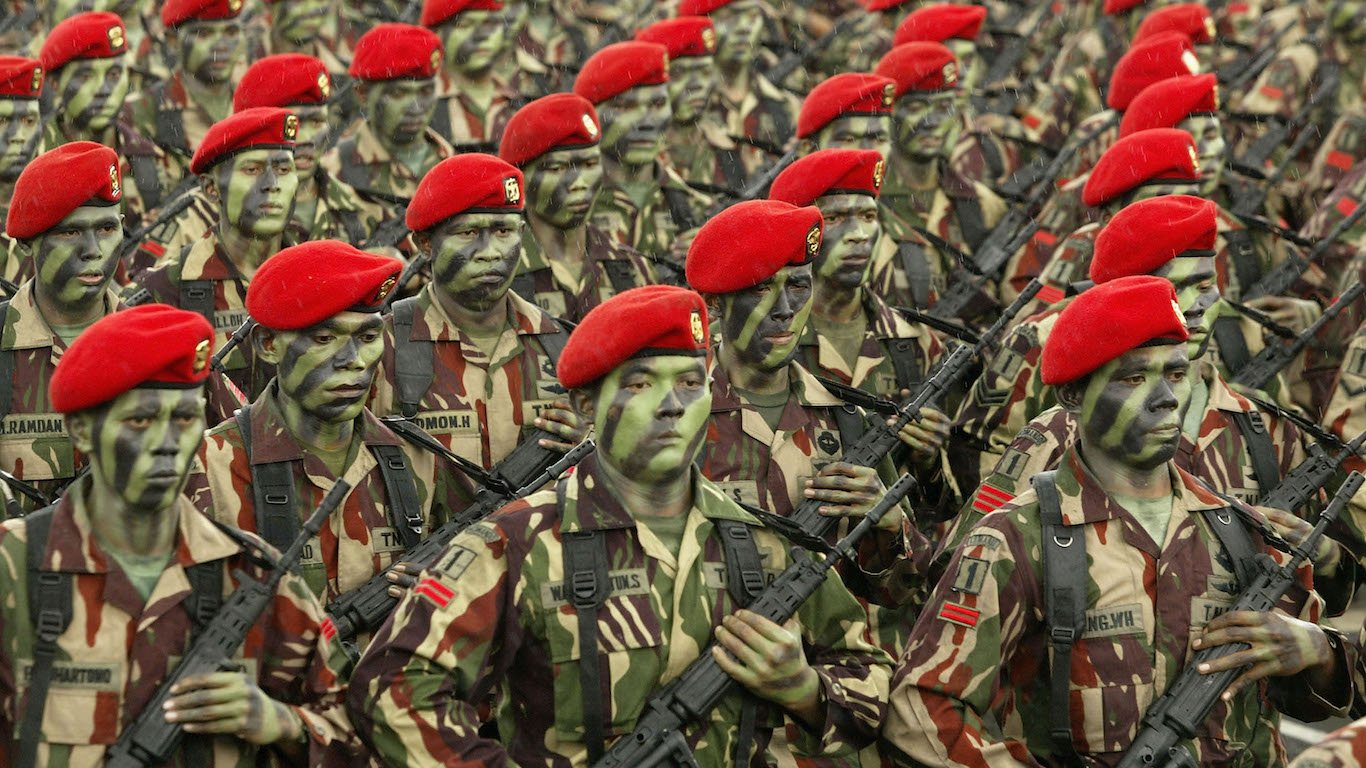
11. Indonesia
> Change from 2009-13 to 2014-18: +86.0%
> Share of global arms imports (2014-18): 2.5%
> Share of global arms imports (2009-13): 1.4%
> Main supplier, share of importer’s total imports: UK, 19%
> GDP per capita: $11,189
[in-text-ad]
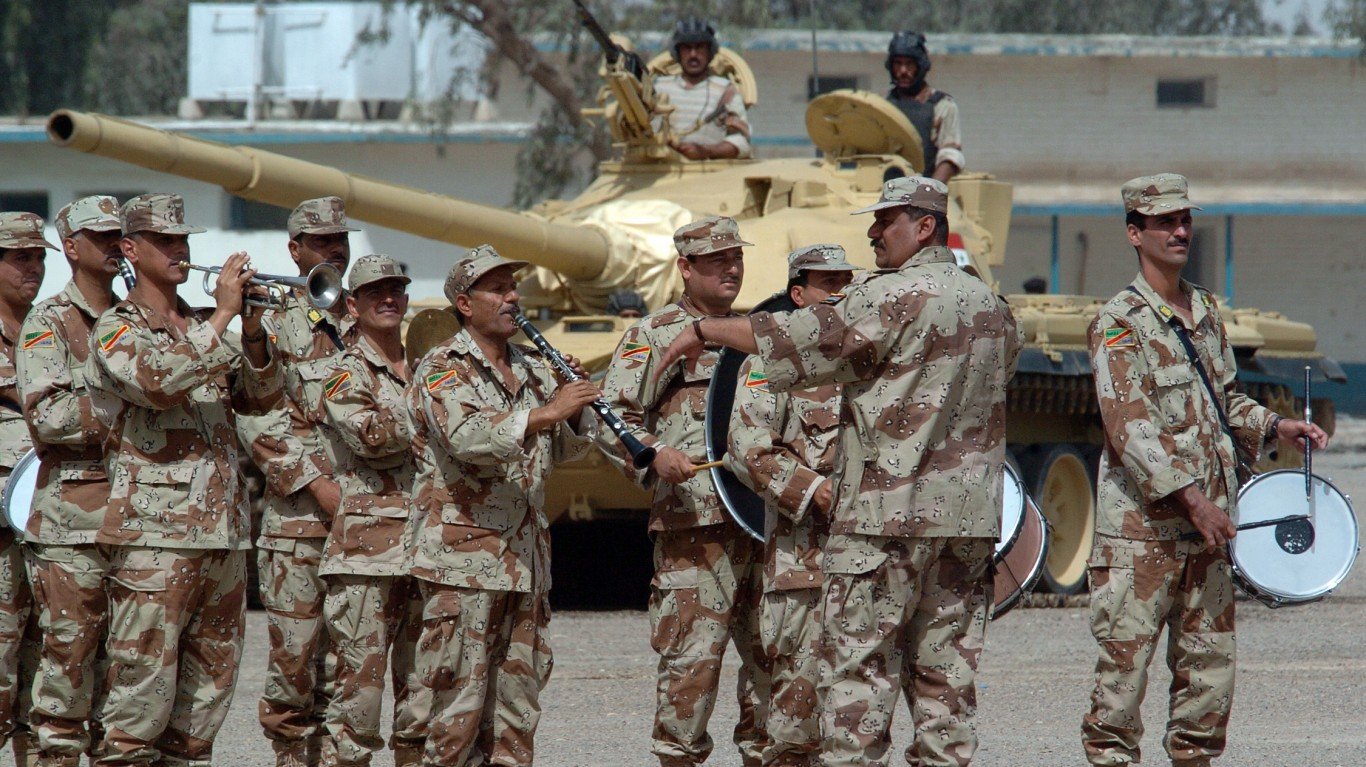
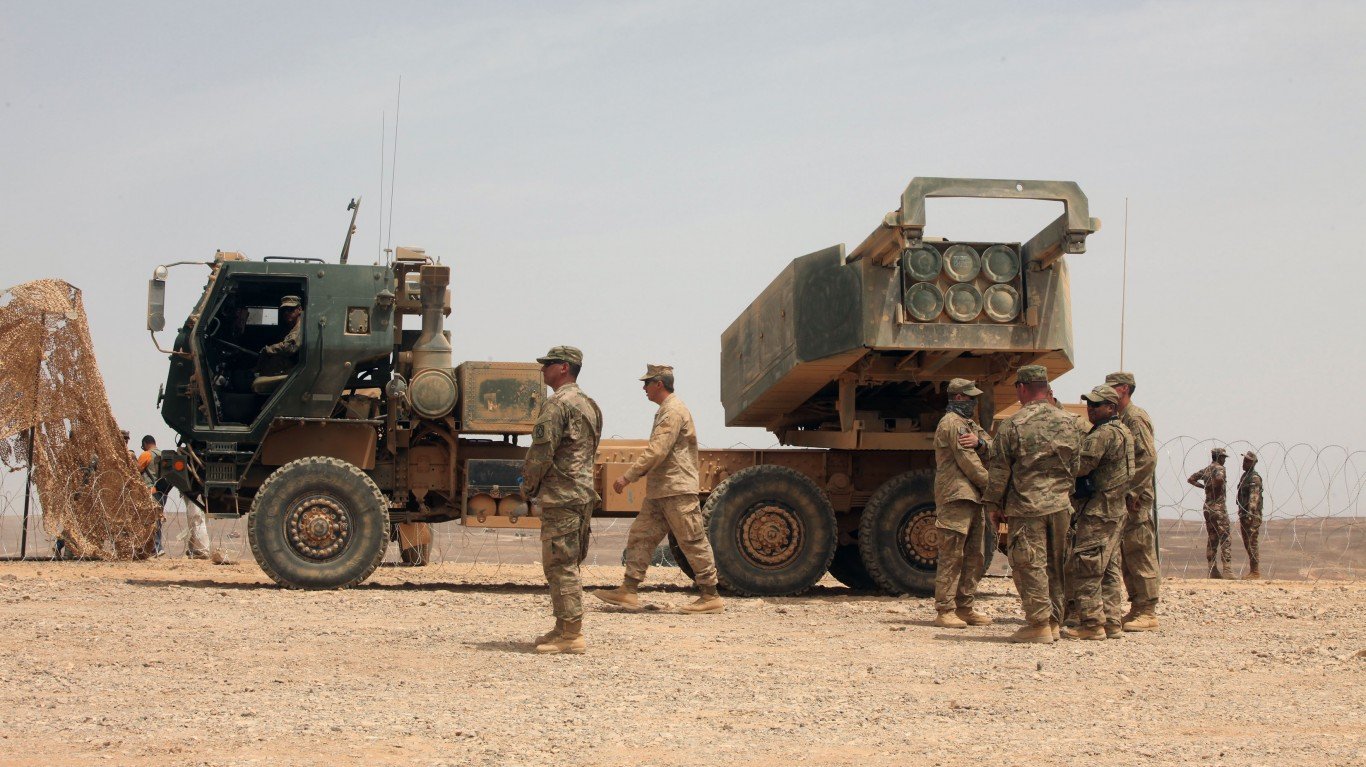
10. Iraq
> Change from 2009-13 to 2014-18: +139.0%
> Share of global arms imports (2014-18): 3.7%
> Share of global arms imports (2009-13): 1.6%
> Main supplier, share of importer’s total imports: USA, 47%
> GDP per capita: $15,393
[recirclink id=488514]

9. Italy
> Change from 2009-13 to 2014-18: +162.0%
> Share of global arms imports (2014-18): 1.5%
> Share of global arms imports (2009-13): 0.6%
> Main supplier, share of importer’s total imports: USA, 59%
> GDP per capita: $35,220
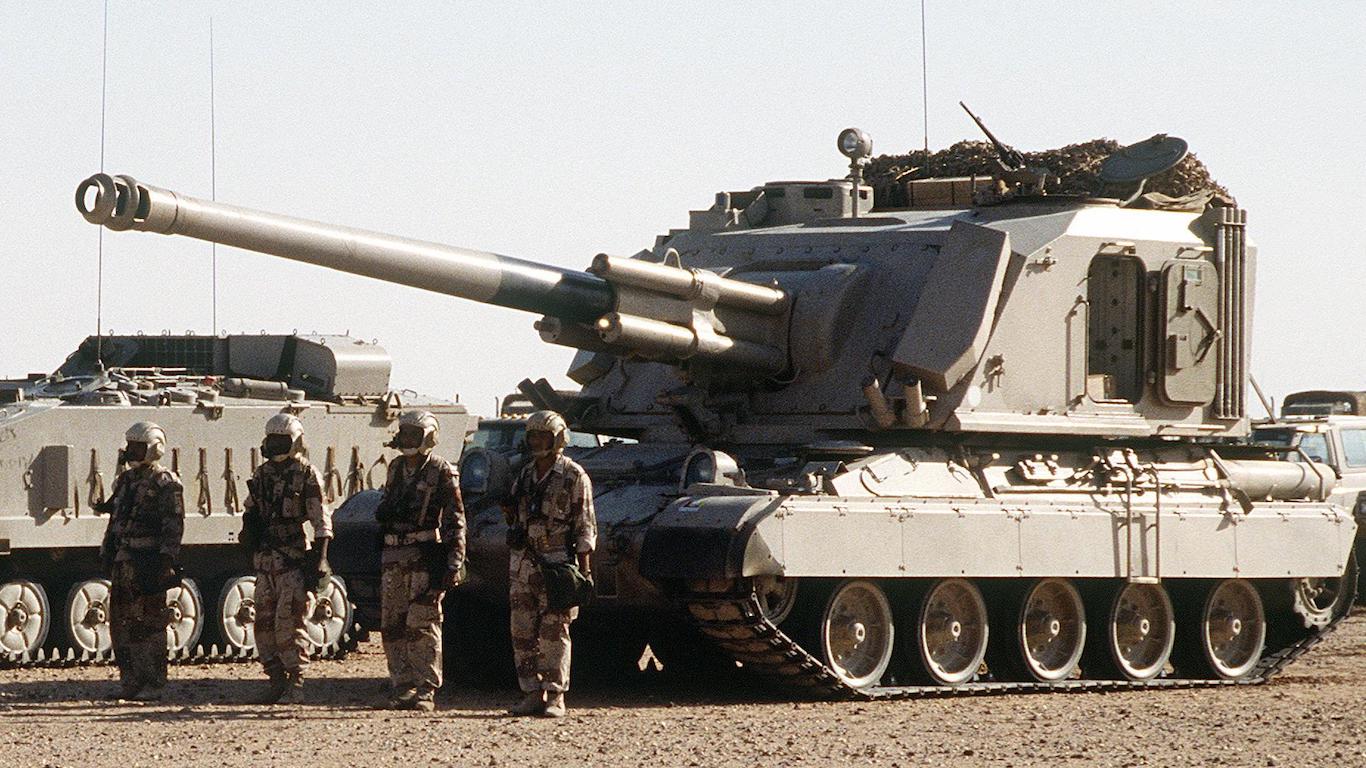
8. Saudi Arabia
> Change from 2009-13 to 2014-18: +192.0%
> Share of global arms imports (2014-18): 12.0%
> Share of global arms imports (2009-13): 4.3%
> Main supplier, share of importer’s total imports: USA, 68%
> GDP per capita: $48,986
[in-text-ad-2]
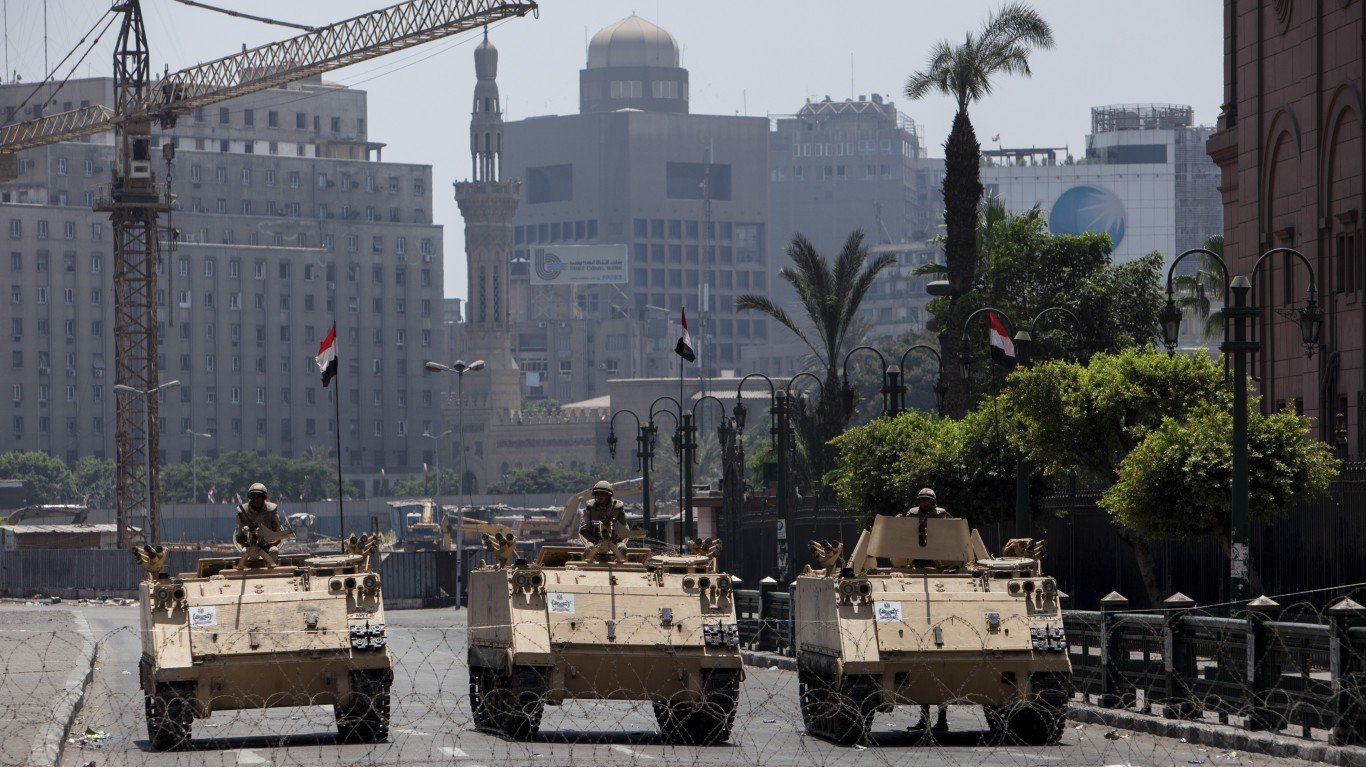
7. Egypt
> Change from 2009-13 to 2014-18: +206.0%
> Share of global arms imports (2014-18): 5.1%
> Share of global arms imports (2009-13): 1.8%
> Main supplier, share of importer’s total imports: France, 37%
> GDP per capita: $10,551
6. Oman
> Change from 2009-13 to 2014-18: +213.0%
> Share of global arms imports (2014-18): 1.6%
> Share of global arms imports (2009-13): 0.6%
> Main supplier, share of importer’s total imports: UK, 39%
> GDP per capita: $37,961
[in-text-ad]

5. Qatar
> Change from 2009-13 to 2014-18: +225.0%
> Share of global arms imports (2014-18): 2.0%
> Share of global arms imports (2009-13): 0.7%
> Main supplier, share of importer’s total imports: USA, 65%
> GDP per capita: $116,932
[recirclink id=488498]
4. Kazakhstan
> Change from 2009-13 to 2014-18: +232.0%
> Share of global arms imports (2014-18): 0.9%
> Share of global arms imports (2009-13): 0.3%
> Main supplier, share of importer’s total imports: Russia, 84%
> GDP per capita: $24,079
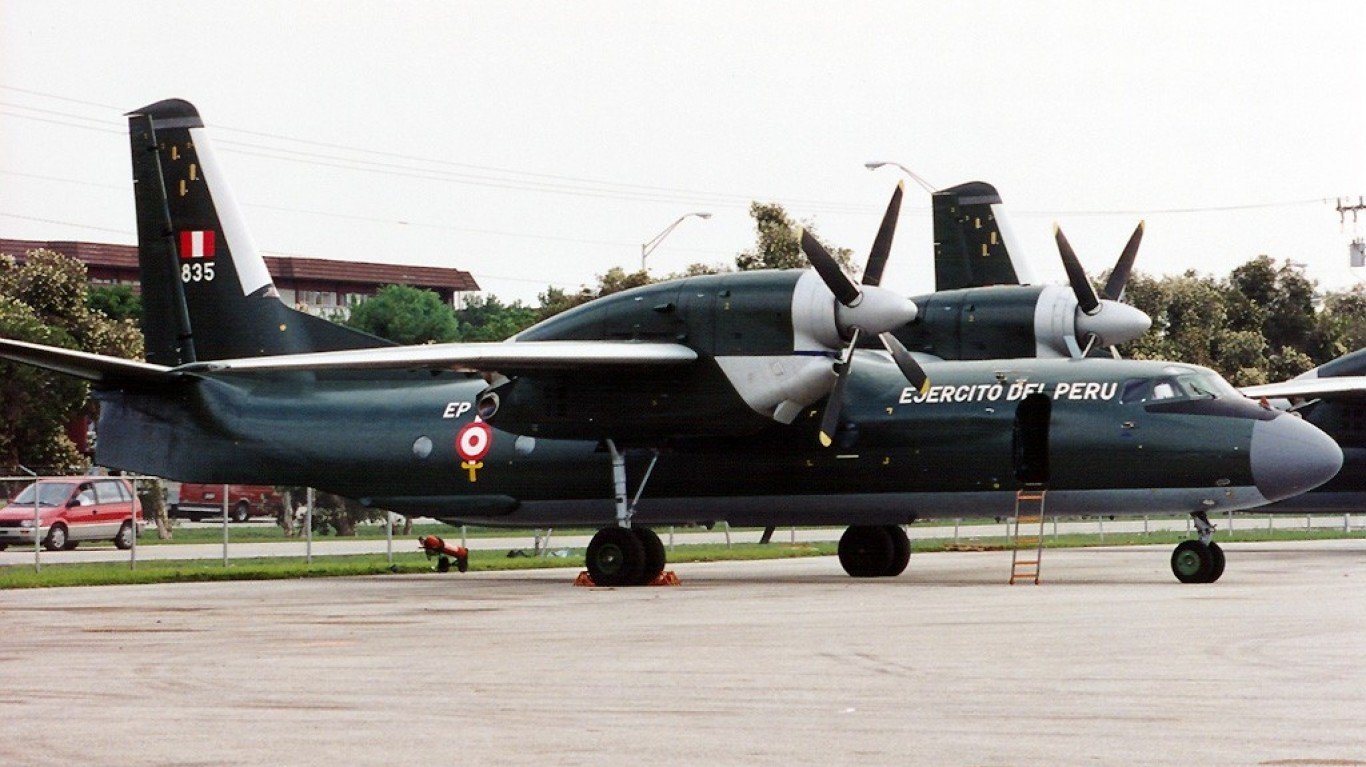
3. Peru
> Change from 2009-13 to 2014-18: +303.0%
> Share of global arms imports (2014-18): 0.5%
> Share of global arms imports (2009-13): 0.1%
> Main supplier, share of importer’s total imports: South Korea, 34%
> GDP per capita: $12,237
[in-text-ad-2]
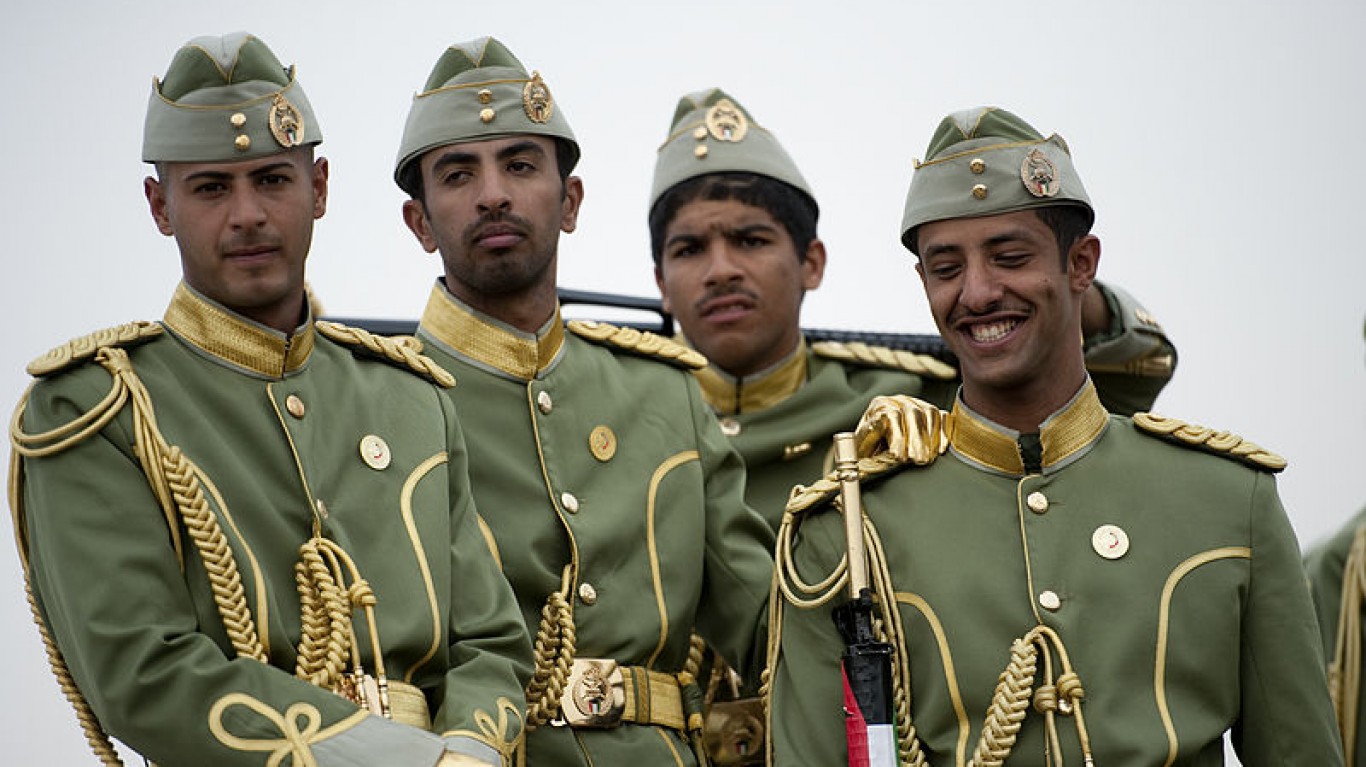
2. Kuwait
> Change from 2009-13 to 2014-18: +348.0%
> Share of global arms imports (2014-18): 1.0%
> Share of global arms imports (2009-13): 0.2%
> Main supplier, share of importer’s total imports: USA, 87%
> GDP per capita: $65,531
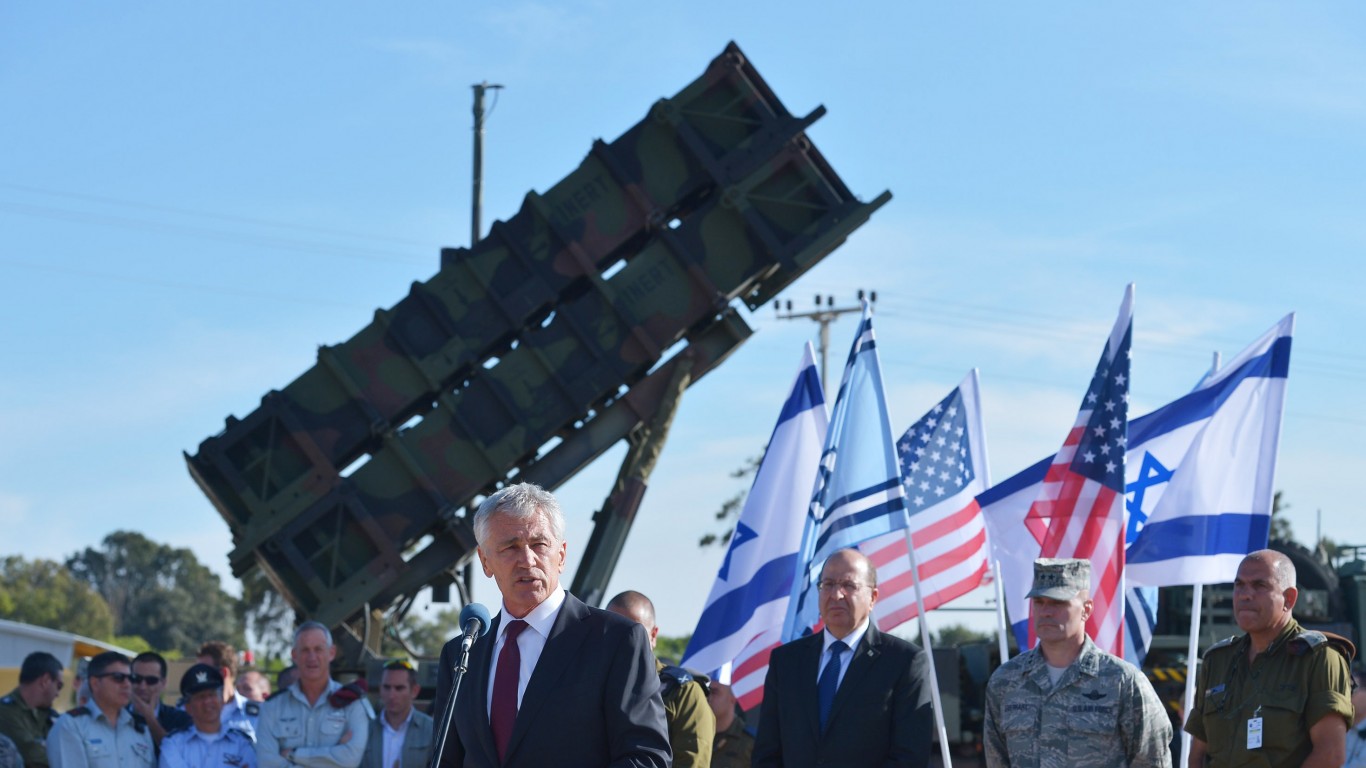
1. Israel
> Change from 2009-13 to 2014-18: +354.0%
> Share of global arms imports (2014-18): 2.0%
> Share of global arms imports (2009-13): 0.5%
> Main supplier, share of importer’s total imports: USA, 64%
> GDP per capita: $33,132
Contact [email protected] for any questions or corrections.