[cnxvideo id=”822617″ placement=”ros”]The first Earth Day was in 1970, and by 1977, scientists generally agree that global warming was the greatest climate risk of the century. But it was not until 1992 that the United Nations Framework Convention on Climate Change (UNFCCC) was adopted. The 197 countries that ratified the convention — including industrialized nations that are some of the largest sources of greenhouse gas emissions — continue to work towards stabilizing greenhouse gas concentrations. Many have signed the Kyoto Protocols and the Paris Agreement.
On June 1, 2017, President Donald Trump announced the United States would withdraw from the Paris Agreement, the international accord to address climate change and the latest agreement by the UNFCCC.
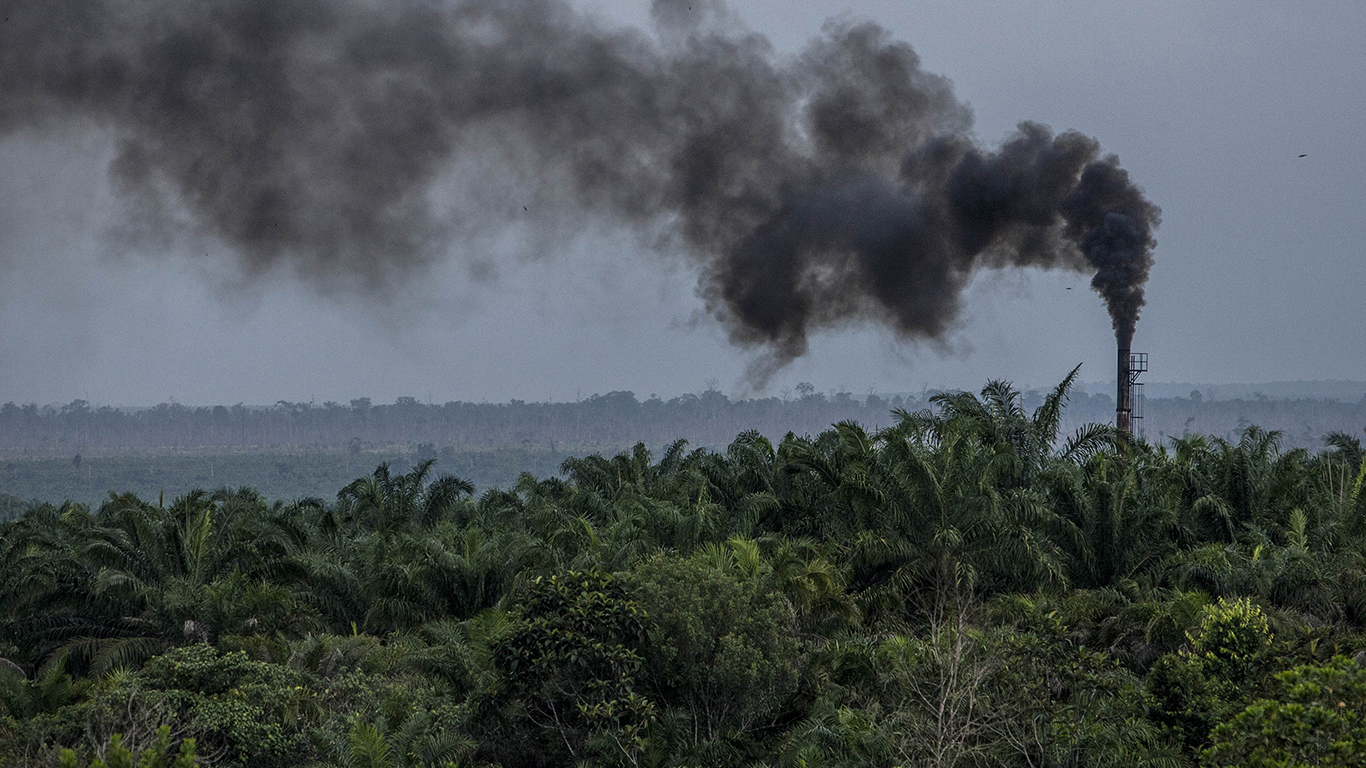
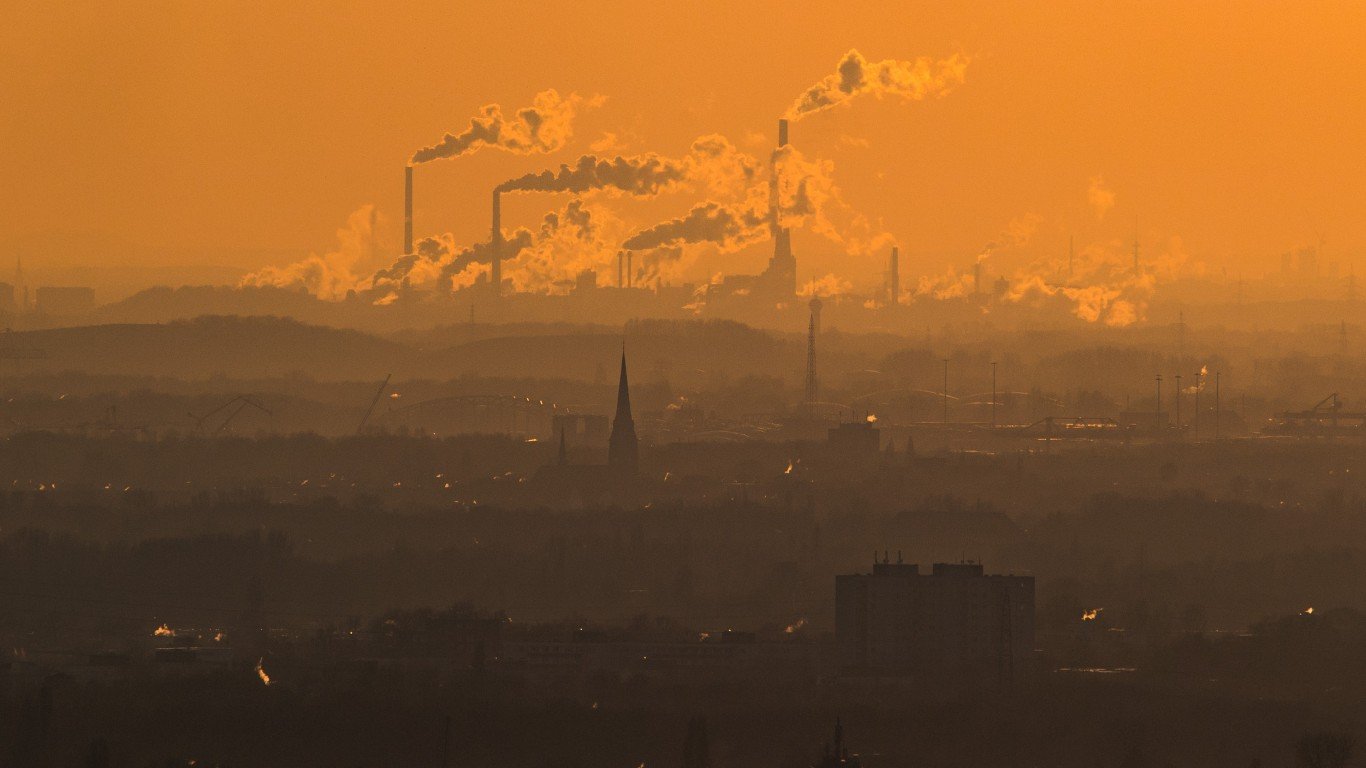
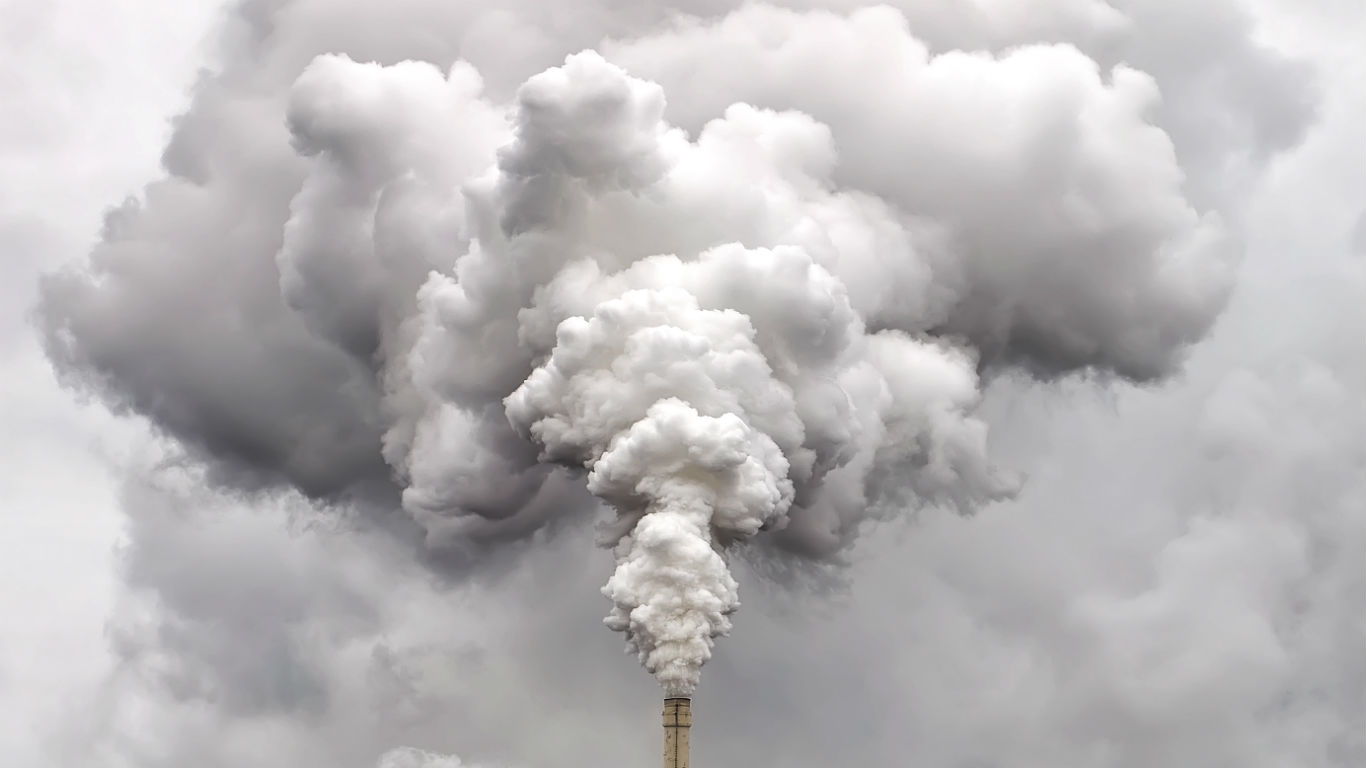
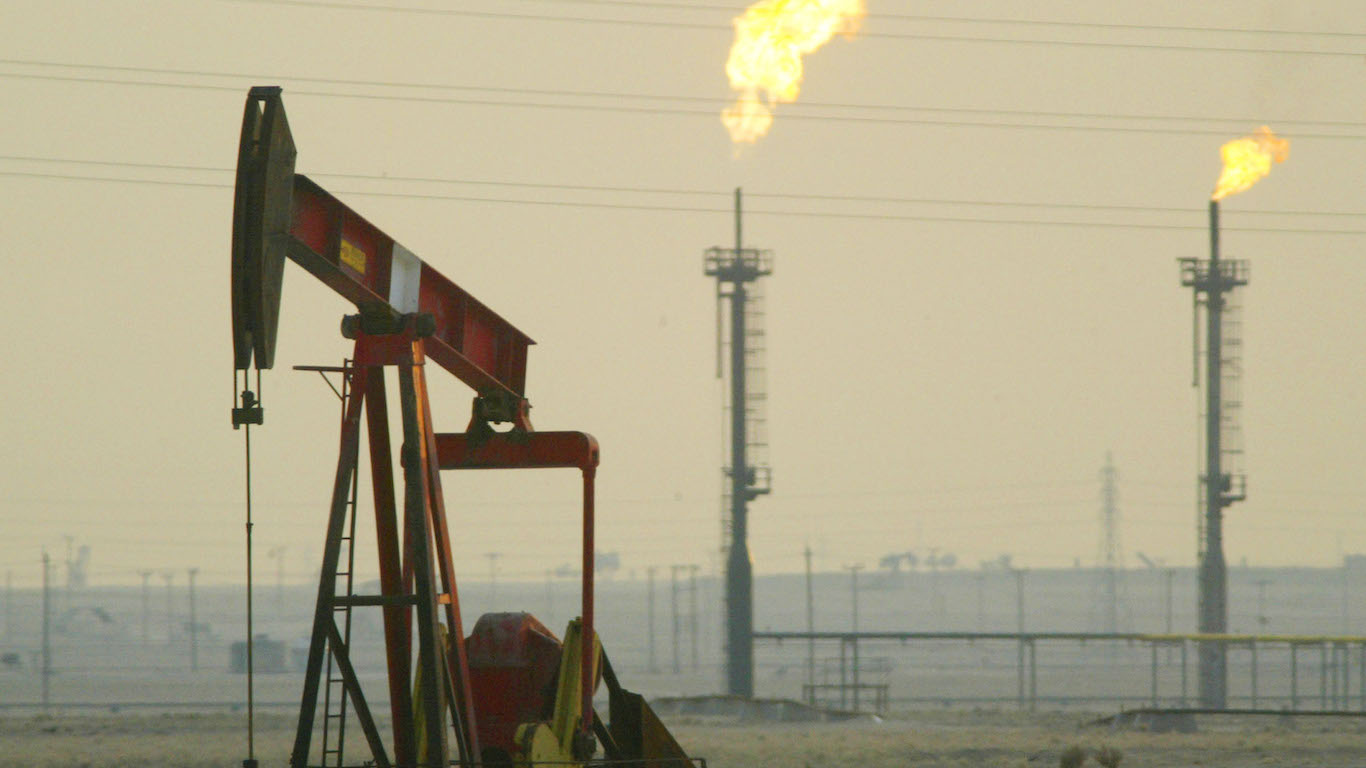
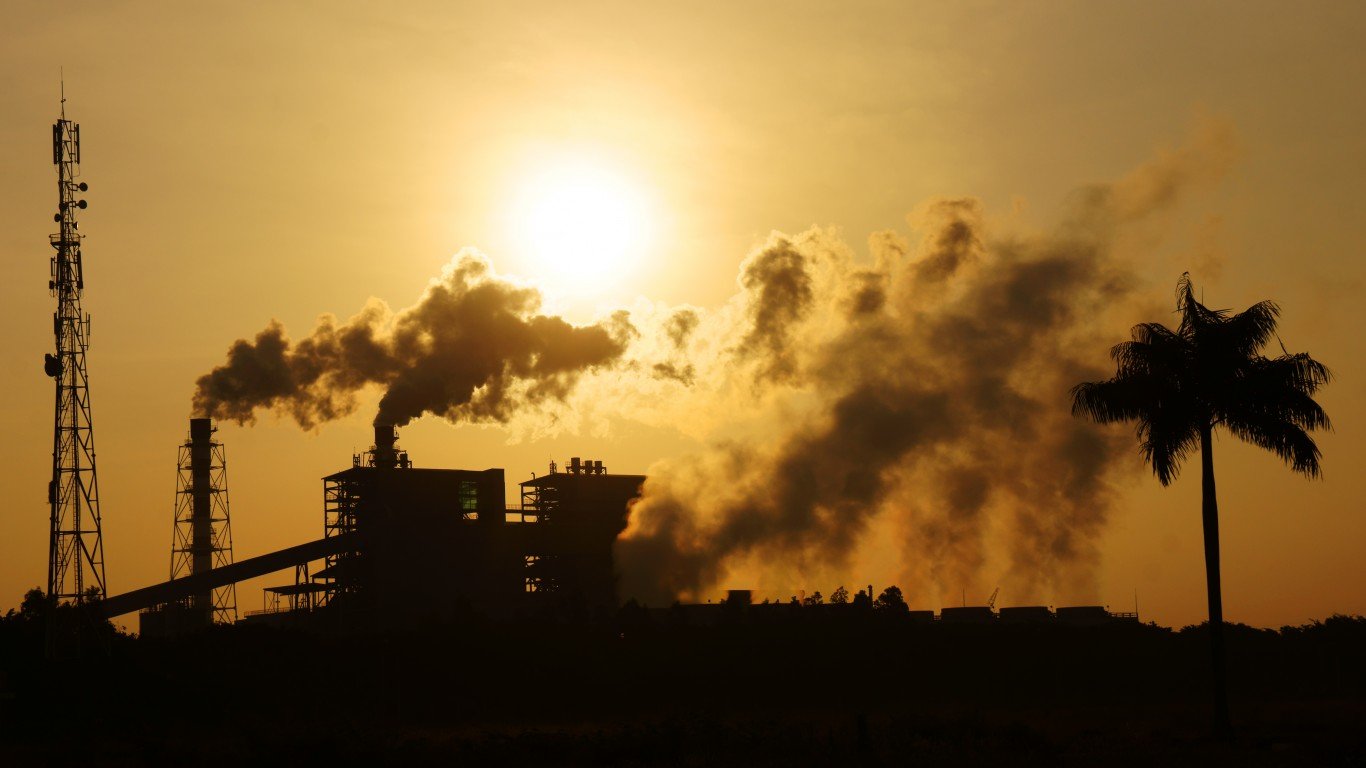
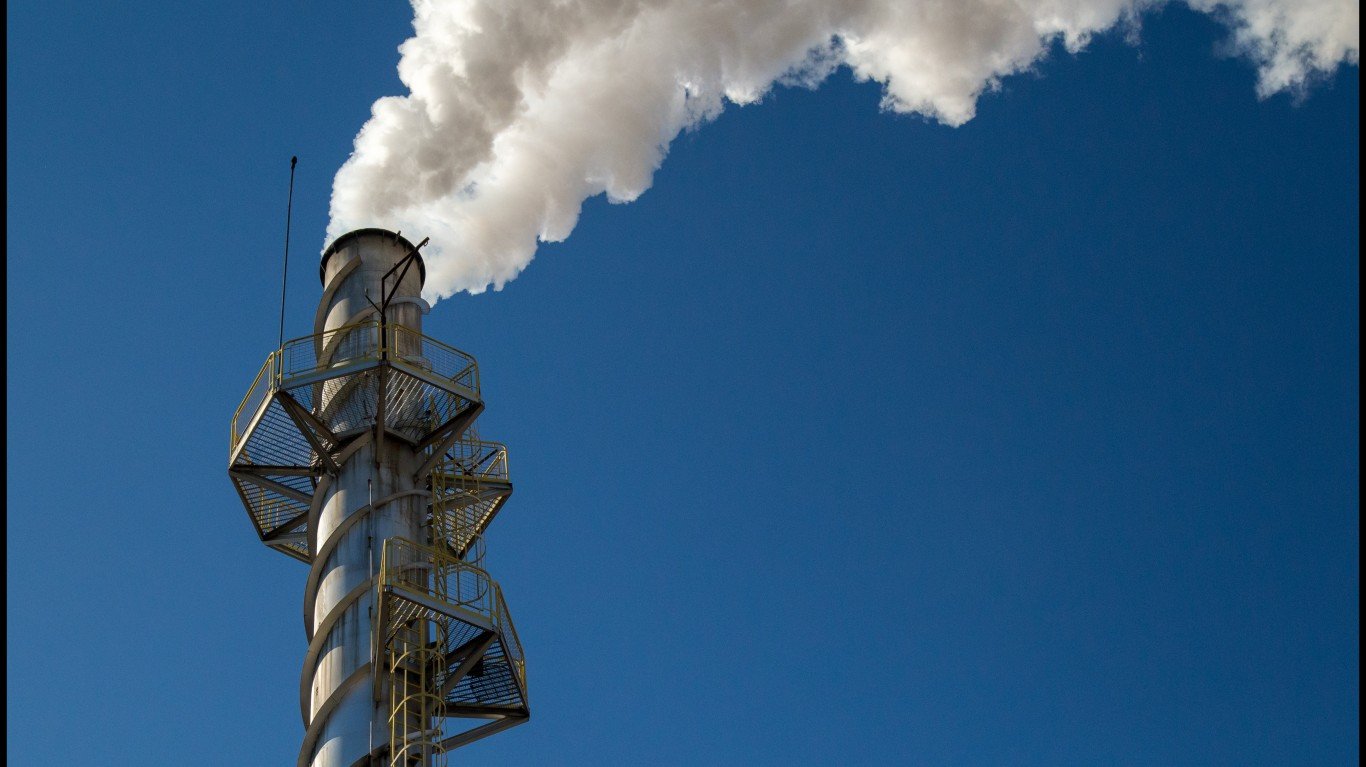
Despite long-standing warnings of a climate emergency as well as efforts by some nations to reduce carbon dioxide emissions, the worldwide use of fossil fuels — and with it global greenhouse gas emissions — grew last year.
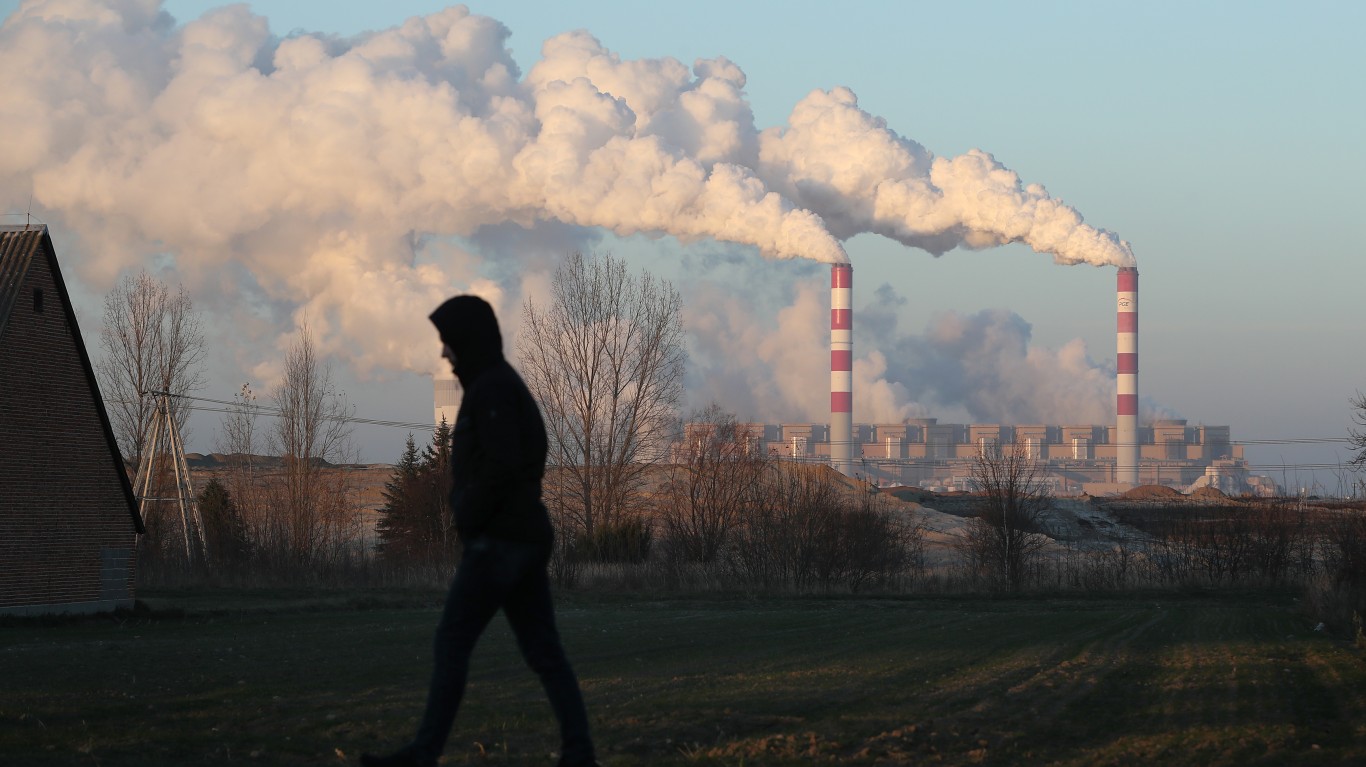
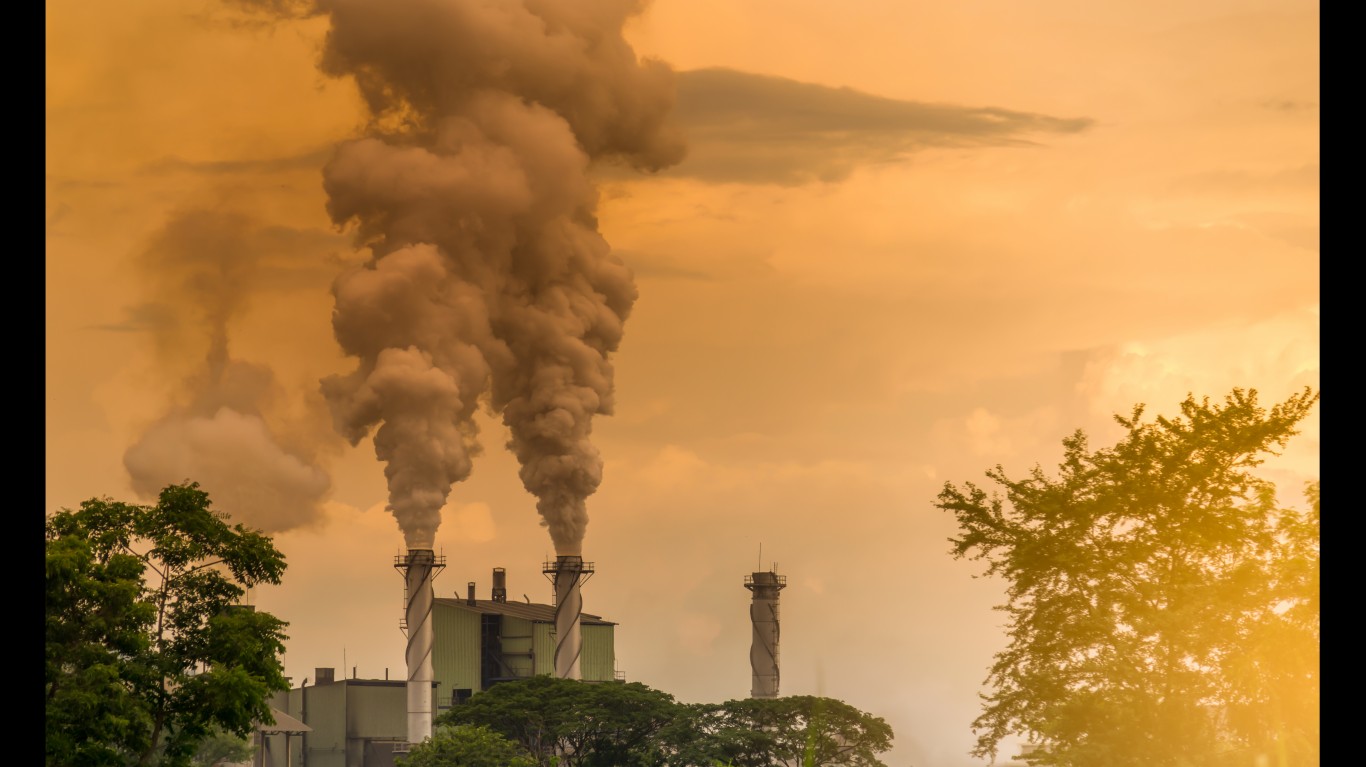
Last year’s uptick in emissions is not new. Global CO2 emissions have increased by an average of 1.5% annually over the past decade, although not all nations contribute to the increase and not by the same amount. On one hand, fossil fuel CO2 emissions decreased significantly in 25 countries, including in the United States, over the past decade, and it decreased in 40 countries over the past 25 years. On the other hand, CO2 emissions from fossil fuels more than doubled in 100 nations over the past 25 years.
Such dramatic increases in CO2 emissions frequently coincide with rapid economic growth. However, most of the world’s economies grew by consistently large margins over the 25-year period. While GDP growth was perhaps more dramatic in many of the countries with the largest carbon emissions growth, GDP growth was not insignificant also in the many countries reporting CO2 emissions decline over that period.
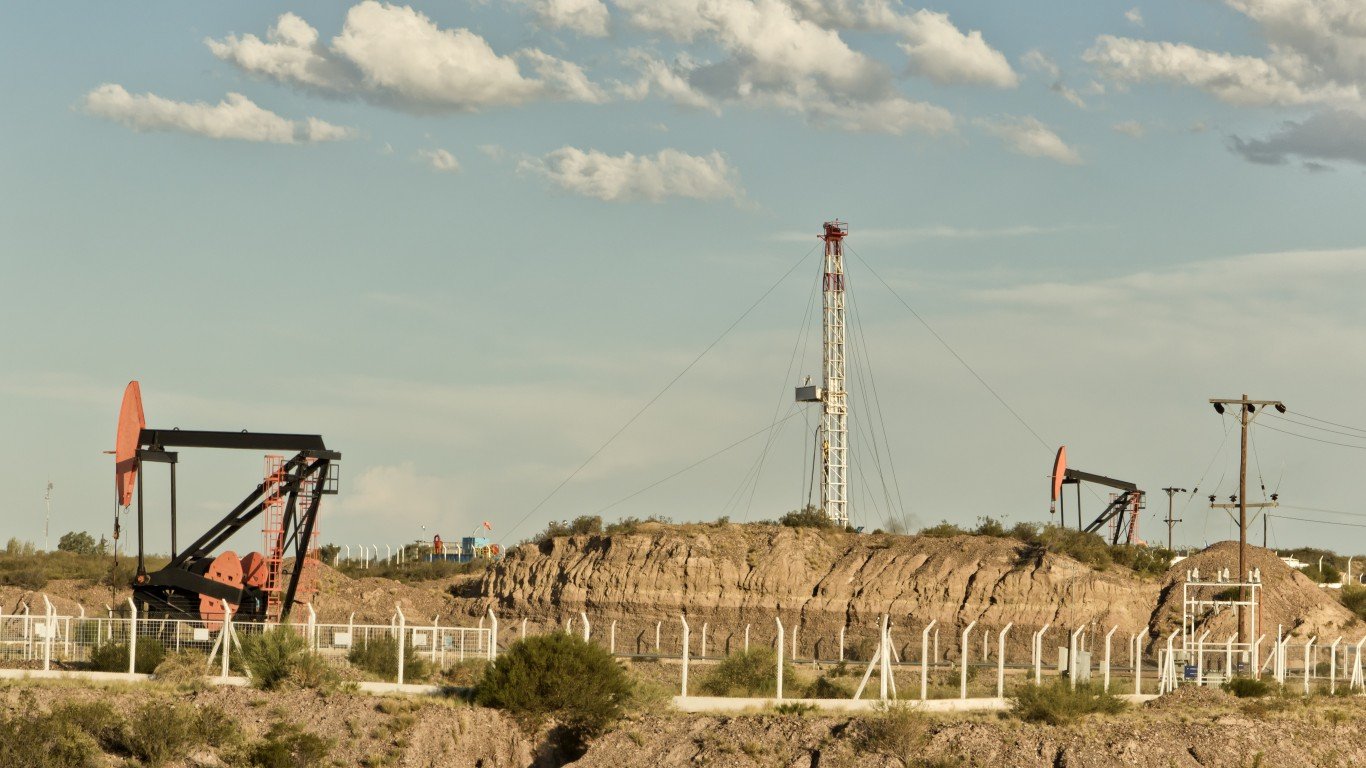
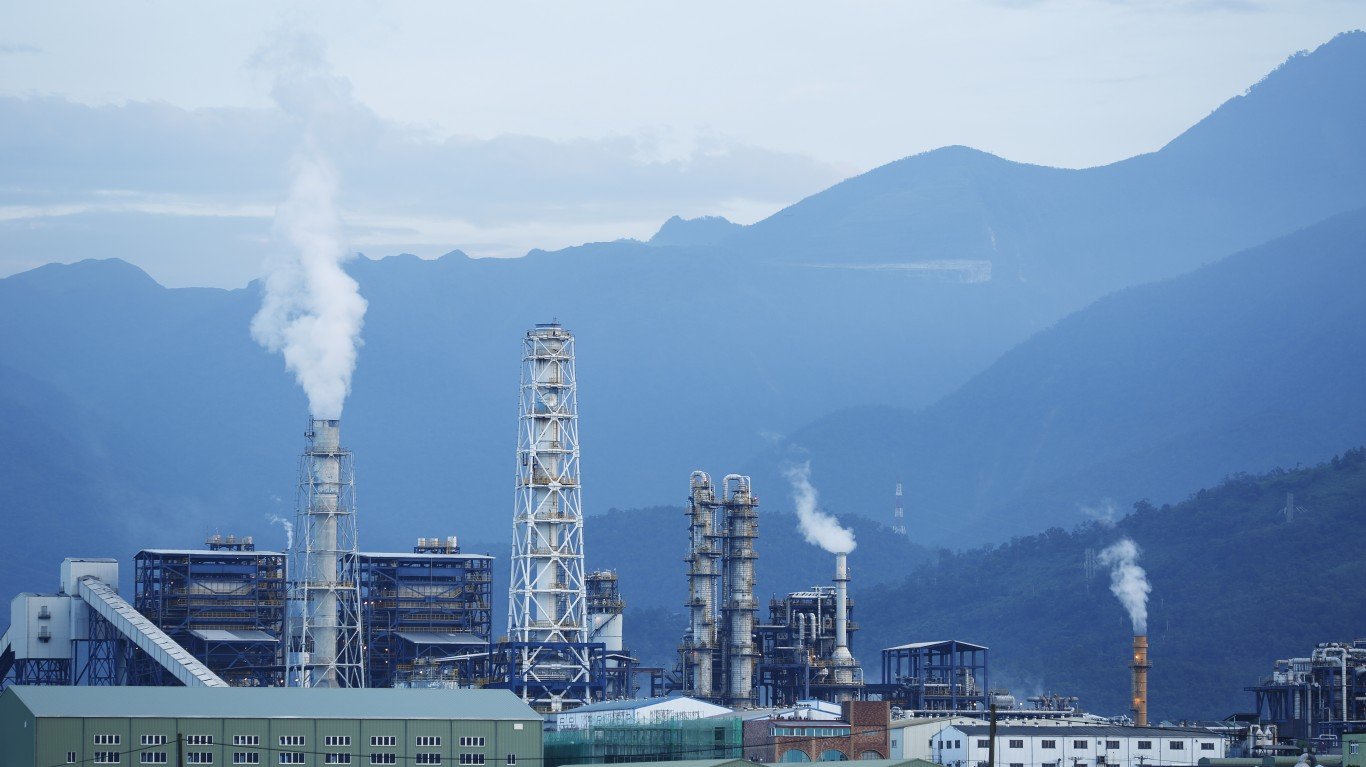
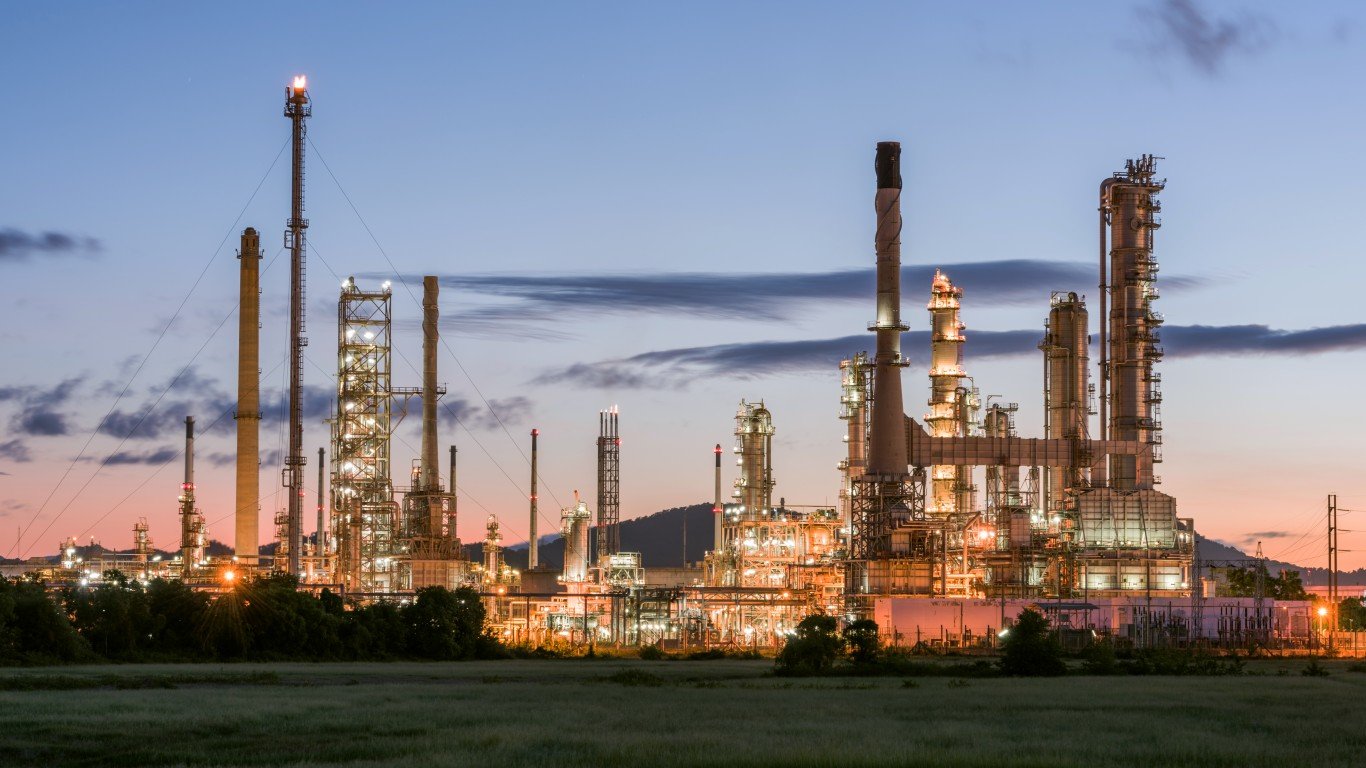
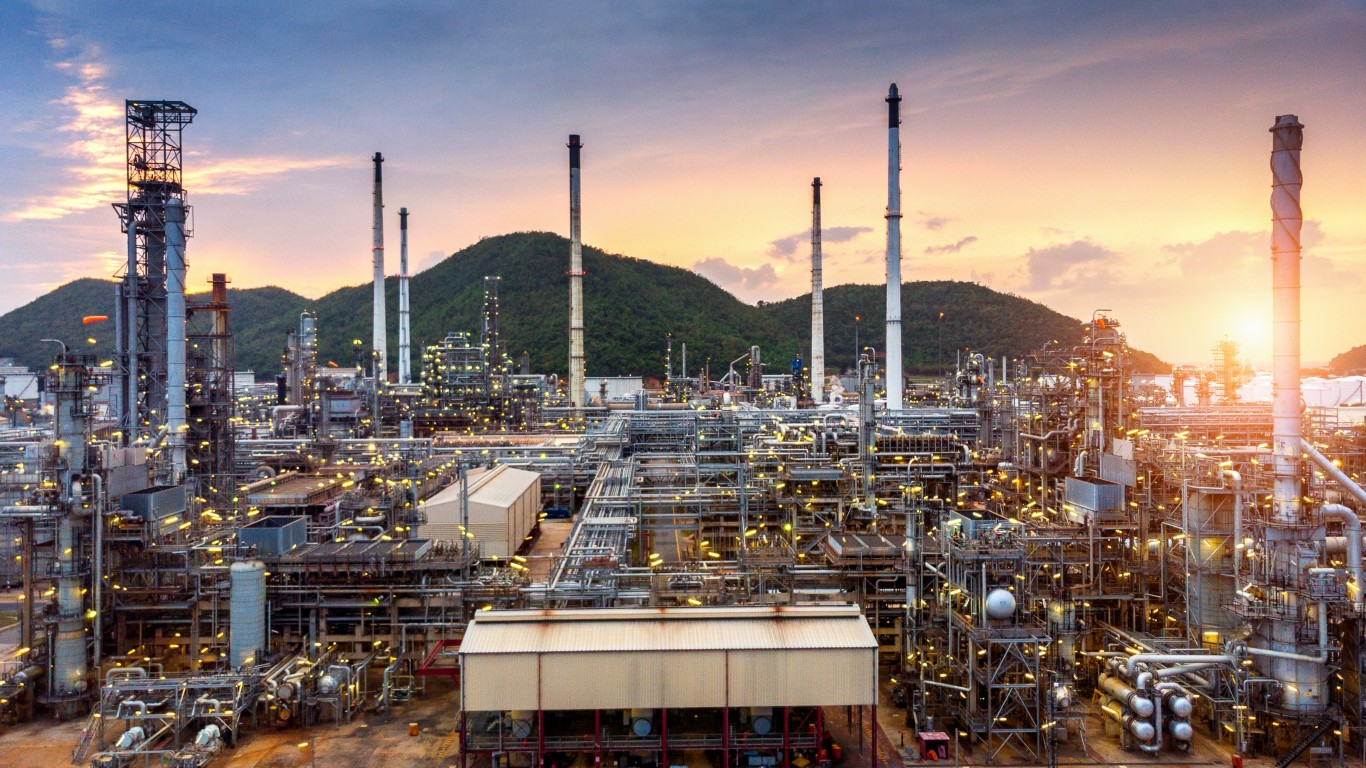
What distinguishes the economies on this list is the source of the growth. Qatar, for example, has increased its natural gas production substantially, and liquefaction processes release a lot of greenhouse gas. As is the case in other South-East Asian countries, Vietnam’s economy has grown substantially since 1992, and coal is being used to power that growth.
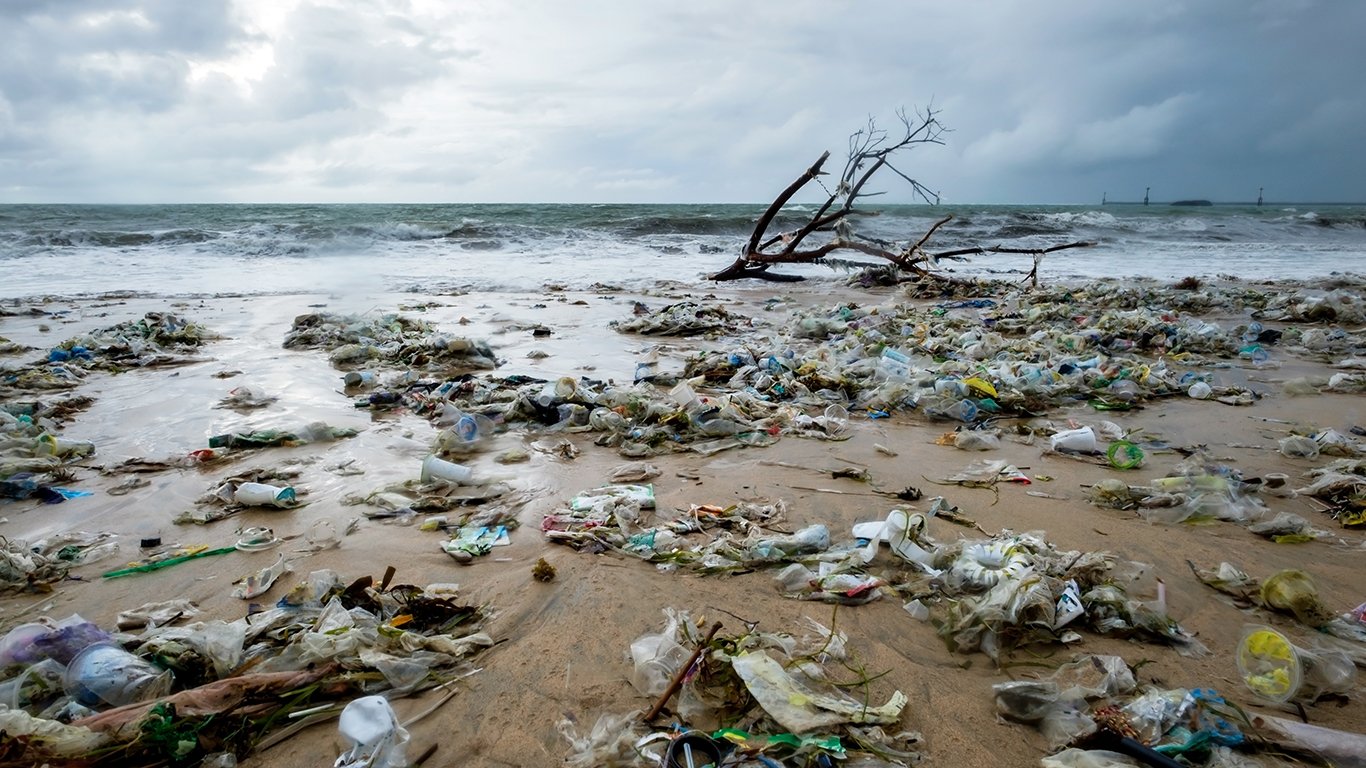
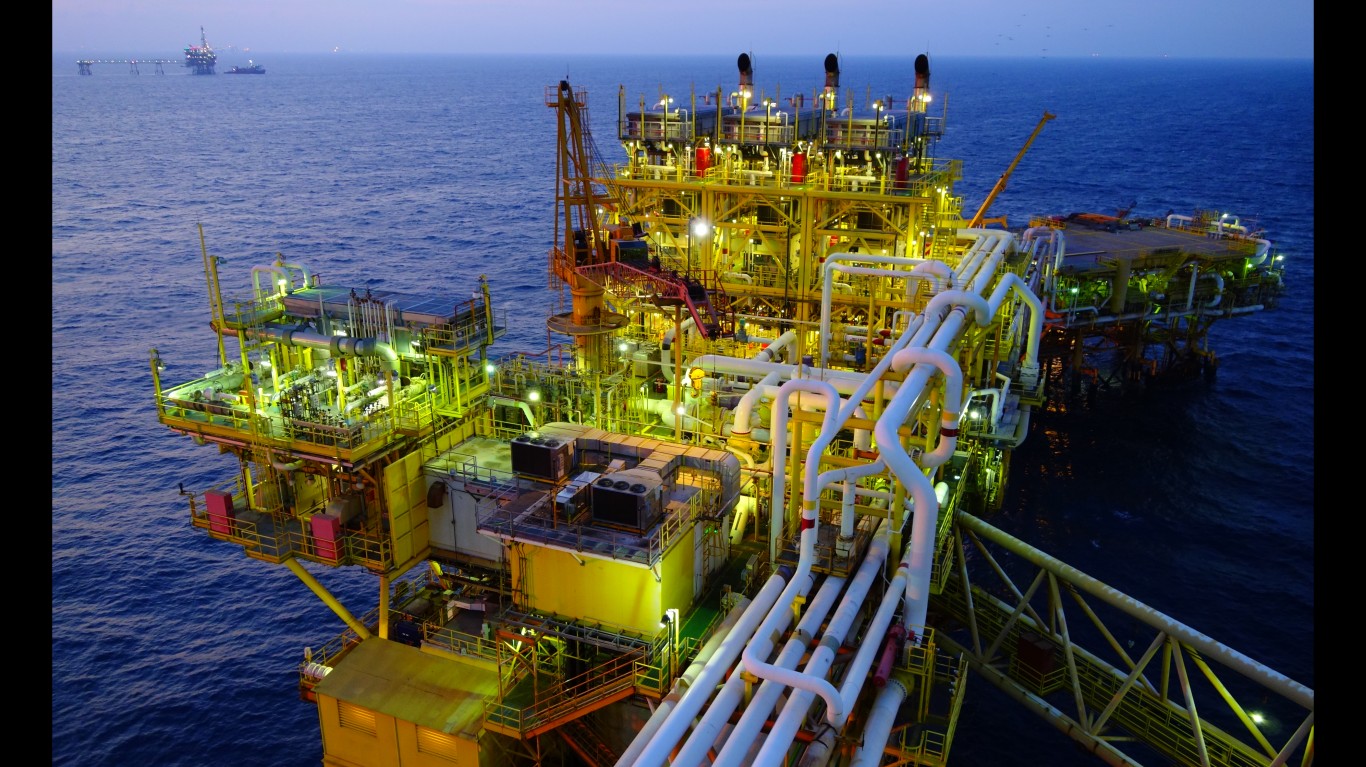
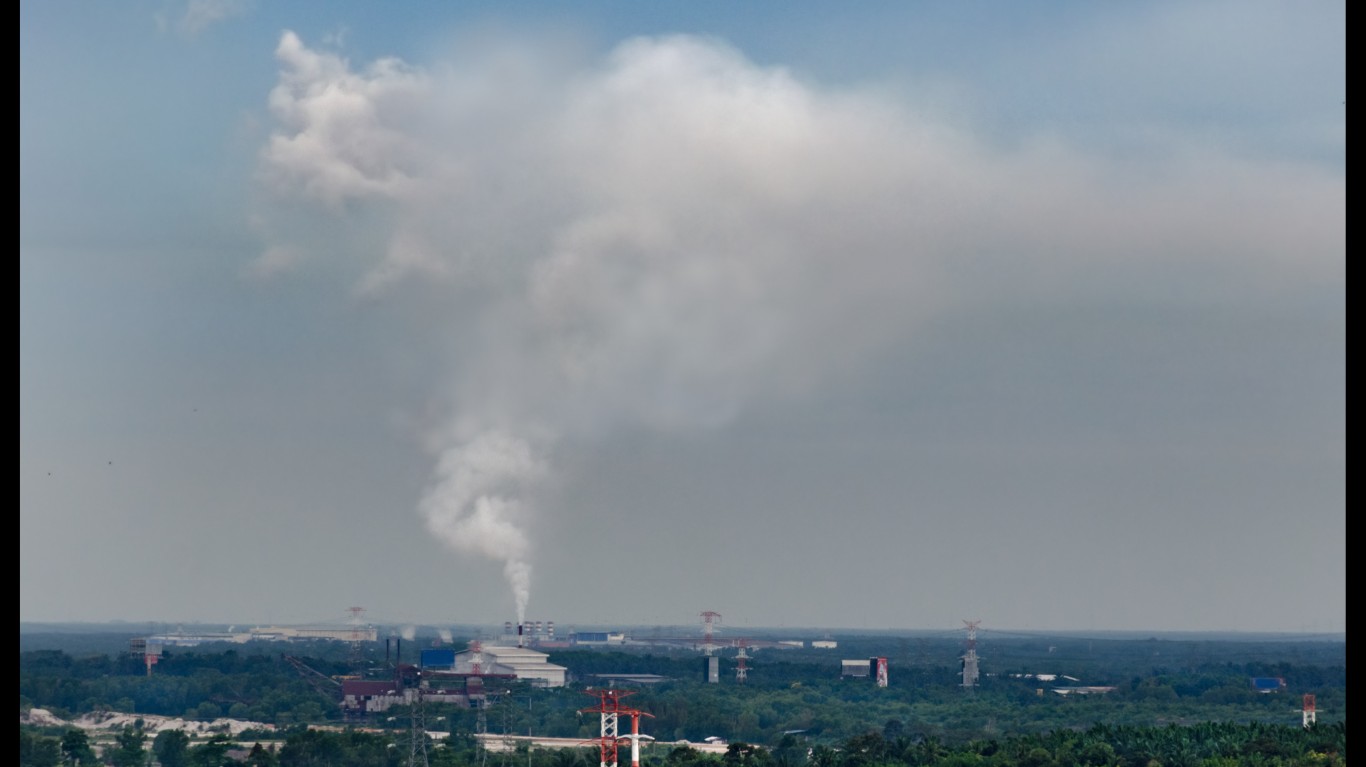
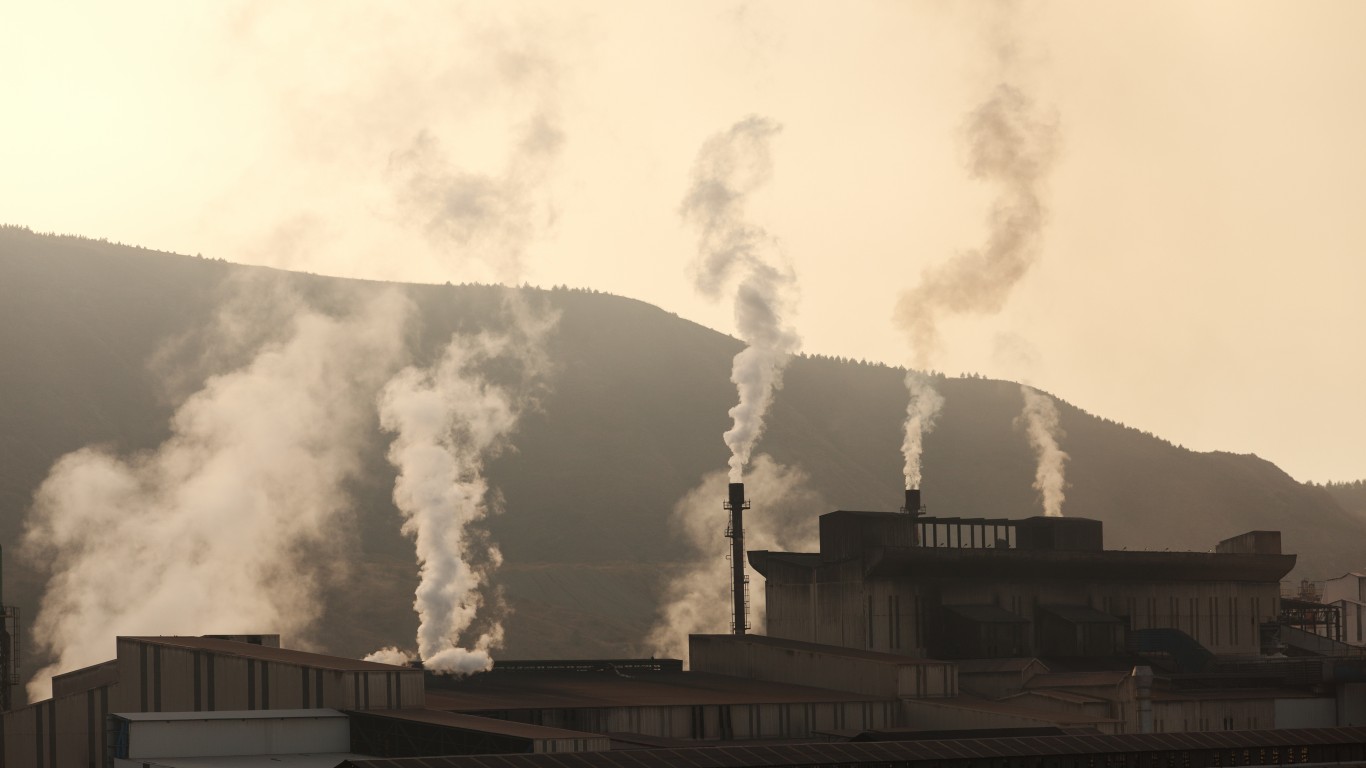
Resource extraction — which causes large CO2 emissions during extraction and process and later during use — has more than tripled worldwide since 1970, and continues to accelerate, even though the world population has only doubled in that time, according to the United Nations’ Global Resources Outlook 2019.
24/7 Wall St. reviewed the nations with the largest spikes in CO2 emissions between 1992 and 2017 using data from the Global Carbon Project 2018. (See our list list of the 25 Countries That Produce the Most CO2).
Click here to see the countries increasing carbon emissions the fastest
Click here to see our full methodology
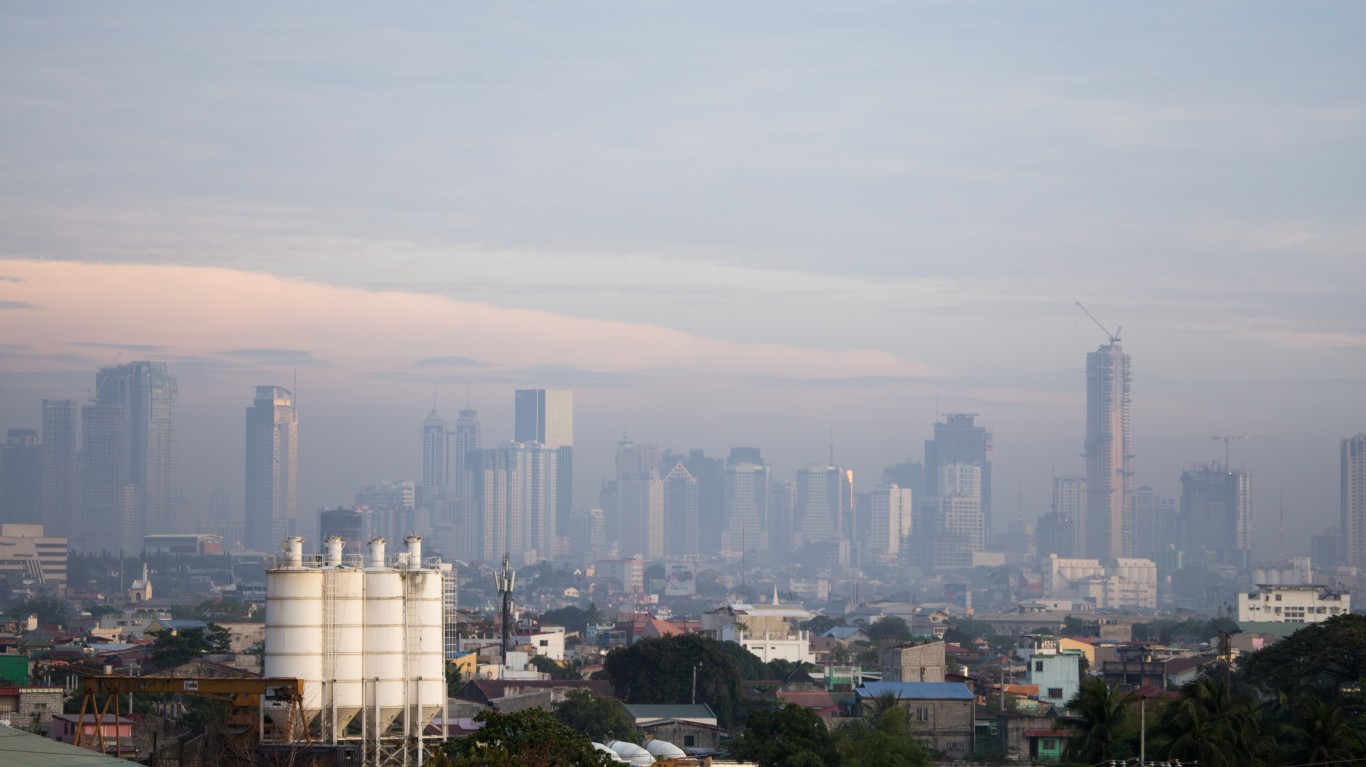
25. Philippines
> CO2 emissions increase 1992-2017: 79.31 million metric tons (164.2%)
> CO2 emissions in 1992: 48.29 million metric tons
> CO2 emissions in 2017: 127.61 million metric tons
> CO2 emissions in 2017 per person: 1.22 metric tons
> GDP growth 1992-2017: 221.5%
> GDP per capita 2017: $7,599
[in-text-ad]
24. Argentina
> CO2 emissions increase 1992-2017: 83.31 million metric tons (68.8%)
> CO2 emissions in 1992: 121.02 million metric tons
> CO2 emissions in 2017: 204.32 million metric tons
> CO2 emissions in 2017 per person: 4.62 metric tons
> GDP growth 1992-2017: 134.9%
> GDP per capita 2017: $18,932
[recirclink id=488456]
23. Kuwait
> CO2 emissions increase 1992-2017: 83.37 million metric tons (396.6%)
> CO2 emissions in 1992: 21.02 million metric tons
> CO2 emissions in 2017: 104.39 million metric tons
> CO2 emissions in 2017 per person: 25.24 metric tons
> GDP growth 1992-2017: Not available
> GDP per capita 2017: $65,531
22. USA
> CO2 emissions increase 1992-2017: 95.47 million metric tons (1.8%)
> CO2 emissions in 1992: 5,174.06 million metric tons
> CO2 emissions in 2017: 5,269.53 million metric tons
> CO2 emissions in 2017 per person: 16.21 metric tons
> GDP growth 1992-2017: 135.1%
> GDP per capita 2017: $54,471
[in-text-ad-2]

21. Qatar
> CO2 emissions increase 1992-2017: 103.07 million metric tons (385.6%)
> CO2 emissions in 1992: 26.73 million metric tons
> CO2 emissions in 2017: 129.80 million metric tons
> CO2 emissions in 2017 per person: 49.18 metric tons
> GDP growth 1992-2017: Not available
> GDP per capita 2017: $116,932
20. Canada
> CO2 emissions increase 1992-2017: 103.92 million metric tons (22.2%)
> CO2 emissions in 1992: 468.86 million metric tons
> CO2 emissions in 2017: 572.78 million metric tons
> CO2 emissions in 2017 per person: 15.60 metric tons
> GDP growth 1992-2017: 127.4%
> GDP per capita 2017: $44,018
[in-text-ad]
19. Pakistan
> CO2 emissions increase 1992-2017: 126.79 million metric tons (176.1%)
> CO2 emissions in 1992: 72.02 million metric tons
> CO2 emissions in 2017: 198.81 million metric tons
> CO2 emissions in 2017 per person: 1.01 metric tons
> GDP growth 1992-2017: 147.9%
> GDP per capita 2017: $5,035
[recirclink id=488594]
18. Taiwan
> CO2 emissions increase 1992-2017: 128.18 million metric tons (89.4%)
> CO2 emissions in 1992: 143.35 million metric tons
> CO2 emissions in 2017: 271.53 million metric tons
> CO2 emissions in 2017 per person: 11.54 metric tons
> GDP growth 1992-2017: 309.0%
> GDP per capita 2017: Not available

17. Australia
> CO2 emissions increase 1992-2017: 128.18 million metric tons (45.0%)
> CO2 emissions in 1992: 284.91 million metric tons
> CO2 emissions in 2017: 413.09 million metric tons
> CO2 emissions in 2017 per person: 16.79 metric tons
> GDP growth 1992-2017: 171.5%
> GDP per capita 2017: $44,643
[in-text-ad-2]
16. Iraq
> CO2 emissions increase 1992-2017: 135.57 million metric tons (230.2%)
> CO2 emissions in 1992: 58.89 million metric tons
> CO2 emissions in 2017: 194.45 million metric tons
> CO2 emissions in 2017 per person: 5.08 metric tons
> GDP growth 1992-2017: 377.1%
> GDP per capita 2017: $15,393
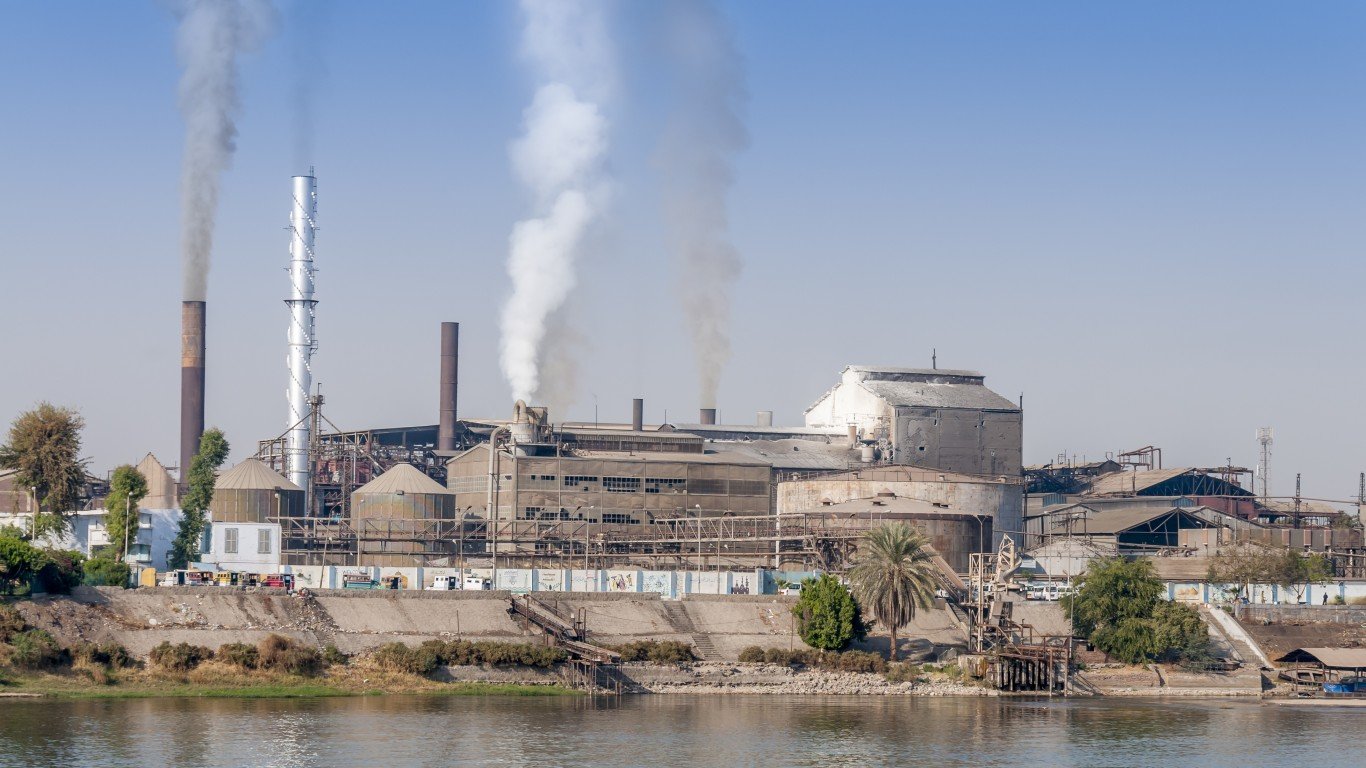
15. Egypt
> CO2 emissions increase 1992-2017: 137.84 million metric tons (170.5%)
> CO2 emissions in 1992: 80.83 million metric tons
> CO2 emissions in 2017: 218.66 million metric tons
> CO2 emissions in 2017 per person: 2.24 metric tons
> GDP growth 1992-2017: 191.8%
> GDP per capita 2017: $10,551
[in-text-ad]

14. South Africa
> CO2 emissions increase 1992-2017: 155.30 million metric tons (51.6%)
> CO2 emissions in 1992: 301.03 million metric tons
> CO2 emissions in 2017: 456.33 million metric tons
> CO2 emissions in 2017 per person: 8.05 metric tons
> GDP growth 1992-2017: 120.9%
> GDP per capita 2017: $12,294
[recirclink id=488561]
13. Mexico
> CO2 emissions increase 1992-2017: 156.09 million metric tons (46.7%)
> CO2 emissions in 1992: 334.21 million metric tons
> CO2 emissions in 2017: 490.29 million metric tons
> CO2 emissions in 2017 per person: 3.80 metric tons
> GDP growth 1992-2017: 164.8%
> GDP per capita 2017: $17,331
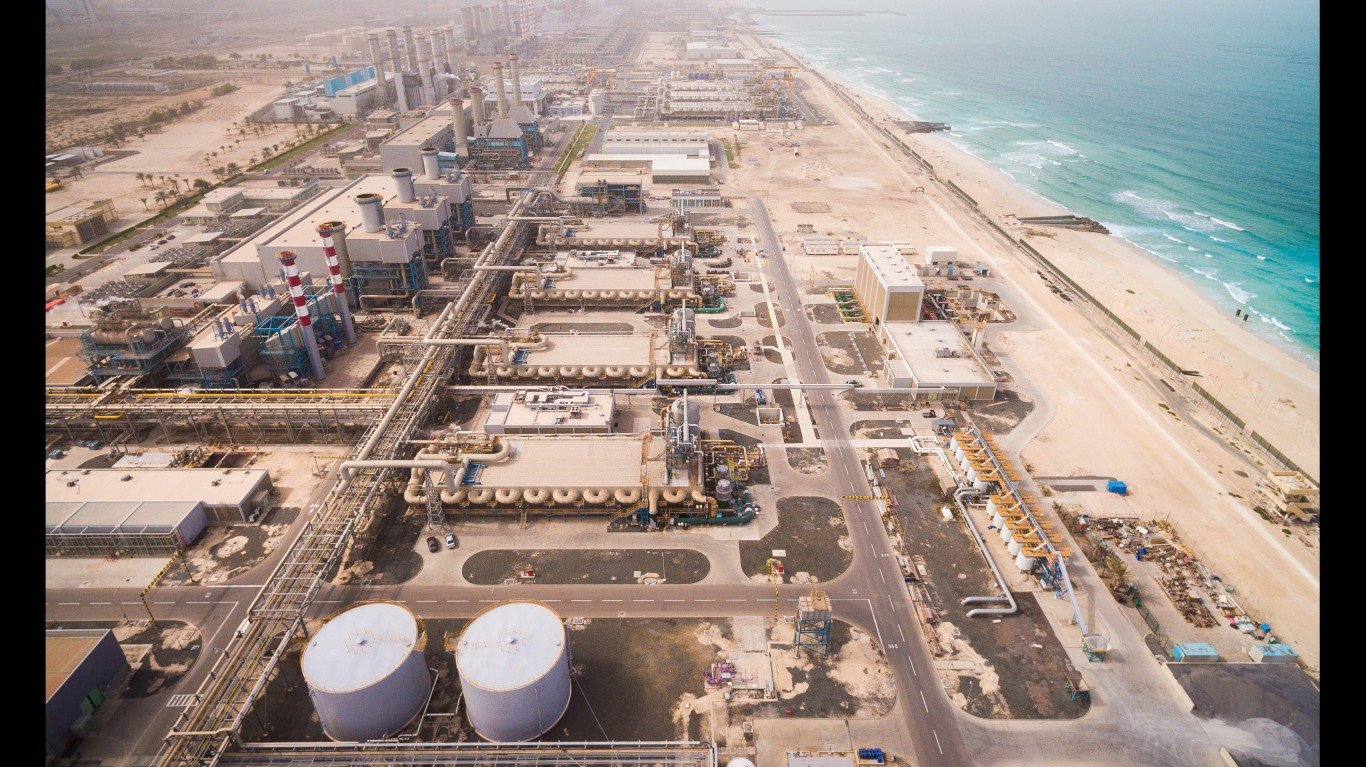
12. United Arab Emirates
> CO2 emissions increase 1992-2017: 174.02 million metric tons (301.3%)
> CO2 emissions in 1992: 57.76 million metric tons
> CO2 emissions in 2017: 231.77 million metric tons
> CO2 emissions in 2017 per person: 24.66 metric tons
> GDP growth 1992-2017: 5.6%
> GDP per capita 2017: $67,293
[in-text-ad-2]
11. Viet Nam
> CO2 emissions increase 1992-2017: 177.73 million metric tons (842.6%)
> CO2 emissions in 1992: 21.09 million metric tons
> CO2 emissions in 2017: 198.83 million metric tons
> CO2 emissions in 2017 per person: 2.08 metric tons
> GDP growth 1992-2017: 519.9%
> GDP per capita 2017: $6,172
10. Malaysia
> CO2 emissions increase 1992-2017: 180.11 million metric tons (241.9%)
> CO2 emissions in 1992: 74.47 million metric tons
> CO2 emissions in 2017: 254.58 million metric tons
> CO2 emissions in 2017 per person: 8.05 metric tons
> GDP growth 1992-2017: 261.9%
> GDP per capita 2017: $26,824
[in-text-ad]
9. Thailand
> CO2 emissions increase 1992-2017: 222.76 million metric tons (206.1%)
> CO2 emissions in 1992: 108.08 million metric tons
> CO2 emissions in 2017: 330.84 million metric tons
> CO2 emissions in 2017 per person: 4.79 metric tons
> GDP growth 1992-2017: 243.6%
> GDP per capita 2017: $16,279
[recirclink id=488514]
8. Brazil
> CO2 emissions increase 1992-2017: 257.68 million metric tons (118.0%)
> CO2 emissions in 1992: 218.38 million metric tons
> CO2 emissions in 2017: 476.07 million metric tons
> CO2 emissions in 2017 per person: 2.27 metric tons
> GDP growth 1992-2017: 126.1%
> GDP per capita 2017: $14,137
7. Indonesia
> CO2 emissions increase 1992-2017: 283.18 million metric tons (139.0%)
> CO2 emissions in 1992: 203.66 million metric tons
> CO2 emissions in 2017: 486.84 million metric tons
> CO2 emissions in 2017 per person: 1.84 metric tons
> GDP growth 1992-2017: 254.2%
> GDP per capita 2017: $11,189
[in-text-ad-2]
6. Turkey
> CO2 emissions increase 1992-2017: 288.83 million metric tons (181.6%)
> CO2 emissions in 1992: 159.07 million metric tons
> CO2 emissions in 2017: 447.90 million metric tons
> CO2 emissions in 2017 per person: 5.55 metric tons
> GDP growth 1992-2017: 316.6%
> GDP per capita 2017: $25,135
5. South Korea
> CO2 emissions increase 1992-2017: 333.90 million metric tons (118.3%)
> CO2 emissions in 1992: 282.19 million metric tons
> CO2 emissions in 2017: 616.10 million metric tons
> CO2 emissions in 2017 per person: 11.97 metric tons
> GDP growth 1992-2017: 286.5%
> GDP per capita 2017: $35,938
[in-text-ad]
4. Saudi Arabia
> CO2 emissions increase 1992-2017: 349.94 million metric tons (122.8%)
> CO2 emissions in 1992: 285.07 million metric tons
> CO2 emissions in 2017: 635.01 million metric tons
> CO2 emissions in 2017 per person: 19.28 metric tons
> GDP growth 1992-2017: 65.4%
> GDP per capita 2017: $48,986
[recirclink id=488498]
3. Iran
> CO2 emissions increase 1992-2017: 445.36 million metric tons (196.2%)
> CO2 emissions in 1992: 226.96 million metric tons
> CO2 emissions in 2017: 672.31 million metric tons
> CO2 emissions in 2017 per person: 8.28 metric tons
> GDP growth 1992-2017: 140.7%
> GDP per capita 2017: $18,983
2. India
> CO2 emissions increase 1992-2017: 1,768.01 million metric tons (253.0%)
> CO2 emissions in 1992: 698.76 million metric tons
> CO2 emissions in 2017: 2,466.77 million metric tons
> CO2 emissions in 2017 per person: 1.84 metric tons
> GDP growth 1992-2017: 435.9%
> GDP per capita 2017: $6,514
[in-text-ad-2]
1. China
> CO2 emissions increase 1992-2017: 7,181.64 million metric tons (270.3%)
> CO2 emissions in 1992: 2,657.11 million metric tons
> CO2 emissions in 2017: 9,838.75 million metric tons
> CO2 emissions in 2017 per person: 7.10 metric tons
> GDP growth 1992-2017: 1,228.3%
> GDP per capita 2017: $15,309
Methodology
To determine the countries increasing CO2 emissions the fastest, 24/7 Wall St. ranked countries based on growth between 1992 and 2017 in territorial CO2 emissions — millions of metric tons of CO2 emitted from fossil fuels and cement production within a country’s borders. We used data from the Global Carbon Project 2018, accessed through the Integrated Carbon Observation System of the Department of Physical Geography and Ecosystem Science at Lund University. Emissions are expressed in units of CO2.
We also considered from the World Bank each country’s methane emissions in 2012, the latest year for which data is available. Data on population, the share of the population in urban areas, GDP per capita in constant international purchasing power parity, electric power consumption in kWh per capita, and the sources of electricity generation, came from the World Bank and figures are for the most recent period available.
National estimates include emissions from fossil fuel combustion and oxidation and cement production and exclude emissions from bunker fuels. Bunker fuels are emissions from fuels used for international aviation and maritime transport. It is important to note that territorial emissions do not account for CO2 emitted from imports.
Contact [email protected] for any questions or corrections.