While the U.S. economy is flourishing in the wake of the Great Recession, not all parts of the country are benefiting equally from the economic recovery.
Economic growth is driven by several factors, including population growth and labor productivity. In the United States, areas with low cost of living, low unemployment, nice weather, and a high degree of urbanization tend to be among the places with the fastest population growth — and often the fastest economic growth.
To determine the states with the best and worst economies, 24/7 Wall St. ranked states based on an index comprising five measures: GDP growth, job growth, unemployment rate, poverty rate, and bachelor’s degree attainment rate.
One of the most important indicators of economic health is educational attainment. Individuals with greater educational attainment are more likely to acquire secure, high-paying jobs, and areas where a larger share of the population is better educated are more likely to attract advanced, high-growth industries.
Many of the states with the best economies are in the fast-growing West and Southwest regions of the United States. While the population growth of America’s largest metropolitan areas — New York, Los Angeles, and Chicago — has slowed in recent years, growth in mid- to large-sized Sun Belt cities such as Austin, Orlando, Raleigh, and Las Vegas has been increased, reaching more than three times the national population growth rate since 2013.
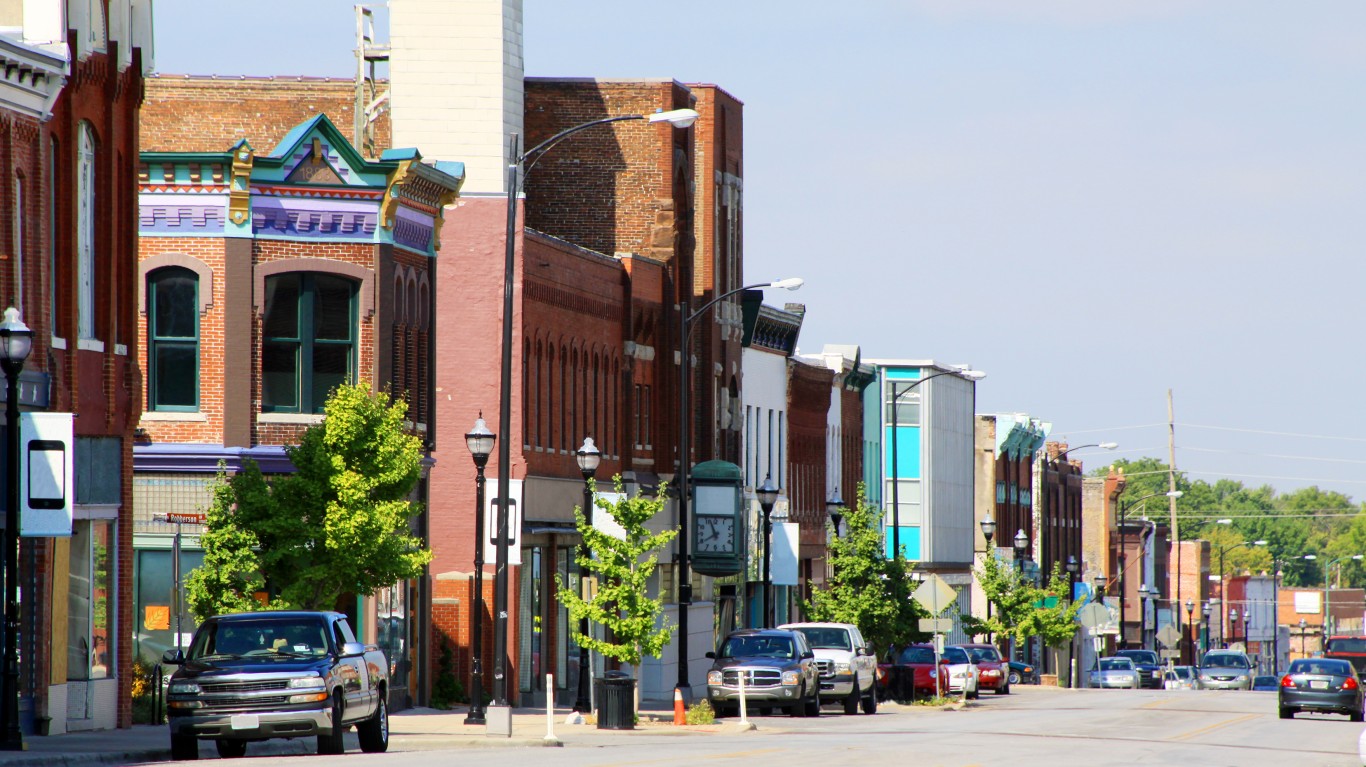
Meanwhile, many of the worst-ranking states are located in the Rust Belt region of the United States. While many parts of the Rust Belt have made efforts to transition to high-tech and service-oriented industries in the wake of the domestic manufacturing sector’s decline of the past 50 years, widespread poverty and low educational attainment remain major obstacles to economic revival in these states. Many of these Rust Belt states rank among the poorest states in the country.
Click here to see the states with the best and worst economies
Click here to see our methodology
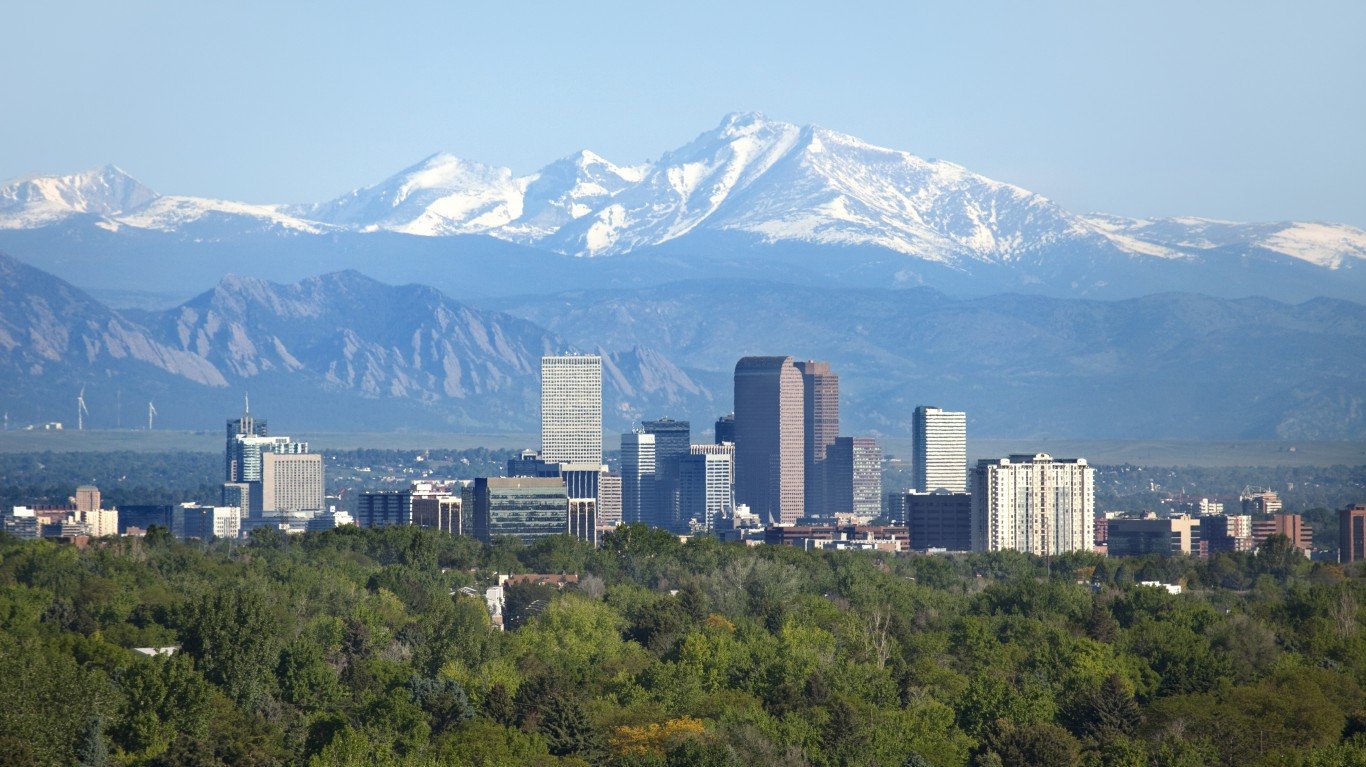
1. Colorado
> 5 yr. GDP annual growth rate: +5.0% (6th largest increase)
> 2018 GDP: $368.8 billion (16th largest)
> April 2019 unemployment: 3.4% (tied — 21st lowest)
> 5 yr. annual employment growth: +3.0% (2nd largest increase)
By a number of metrics measuring economic growth, wealth, educational attainment, and other factors, Colorado ranks as the best economy in the United States. The state’s economy was the sixth fastest growing over the past five years. One factor contributing to Colorado’s growth is its booming tourism industry. A record 84.7 million domestic travelers visited the state in 2017, setting a new all-time high for the eighth consecutive year. With the state setting new yearly records in domestic tourism, the arts, entertainment, recreation, accommmodation, and food services sector in Colorado grew at an average annual rate of 7.0%, the fifth fastest increase of any state.
[in-text-ad]
2. Massachusetts
> 5 yr. GDP annual growth rate: +4.5% (13th largest increase)
> 2018 GDP: $567.3 billion (10th largest)
> April 2019 unemployment: 2.9% (tied — 12th lowest)
> 5 yr. annual employment growth: +2.3% (11th largest increase)
Massachusetts is home to seven of the 50 best national universities, according to U.S. News and World Report. It also has one of the most educated populations in the country. Some 43.1% of adults have at least a bachelor’s degree, the largest share of any state and far more than the 32.0% national college attainment rate. Massachusetts’ highly educated labor force is likely one factor contributing to the rapid economic growth of advanced, high-paying industries in the state.
The professional business services sector grew at an average annual rate of 6.5% from 2013 to 2018 — the third fastest increase nationwide — and today the sector accounts for 18.1% of state GDP, the largest share of any state other than Virginia.
[recirclink id=522699]

3. Utah
> 5 yr. GDP annual growth rate: +5.7% (3rd largest increase)
> 2018 GDP: $177.3 billion (20th smallest)
> April 2019 unemployment: 2.9% (tied — 12th lowest)
> 5 yr. annual employment growth: +2.6% (6th largest increase)
Utah’s economy was the third fastest growing of U.S. states from 2013 through 2018. One of the main drivers of growth was the state’s booming information sector. The economic output of the information sector grew 53.8% from $5.9 billion in 2013 to $9.0 billion in 2018, the second largest growth of any industry in Utah over that period. Much of the growth likely occurred in the Silicon Slopes region of the state, a cluster of fast-growing tech companies and startups stretching roughly from Salt Lake City to Provo.
The number of employed workers in Utah rose at an average annual rate of 2.6% from 2013 to 2018, the sixth fastest in increase of any state. The state’s population grew by 10.3% between 2010 and 2018 as well, the most of any state. Pull factors for new residents likely include the state’s low cost of living and unemployment rate.

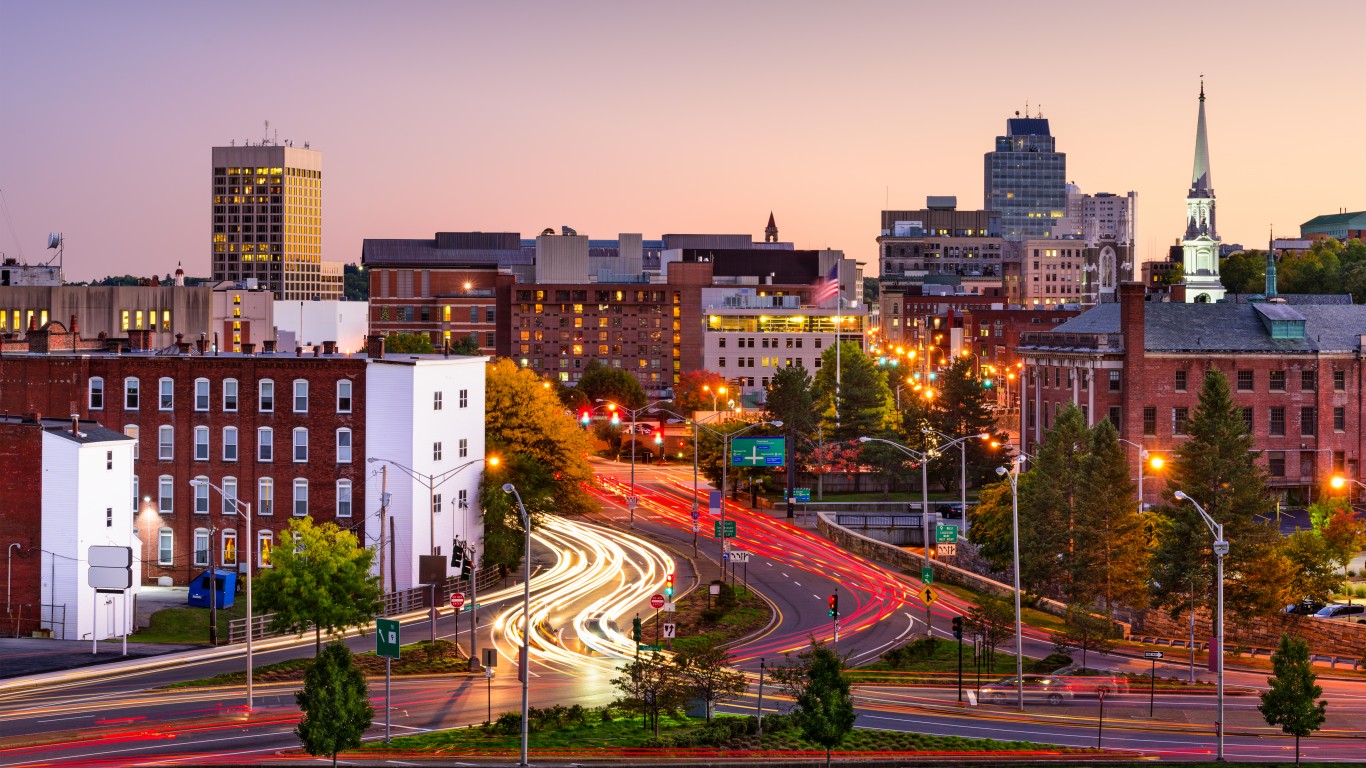
4. New Hampshire
> 5 yr. GDP annual growth rate: +3.8% (20th largest increase)
> 2018 GDP: $84.7 billion (12th smallest)
> April 2019 unemployment: 2.4% (tied — 4th lowest)
> 5 yr. annual employment growth: +1.1% (24th largest increase)
While New Hampshire’s GDP growth was somewhat average over the last five years — an annual growth rate of 3.8% compared to the 4.1% national figure — the state ranks as the fourth best economy due to its general wealth, highly-educated population, and healthy labor market.
The typical New Hampshire household earns nearly $13,000 more than the typical U.S. household annually, and just 7.7% of residents live below the poverty line — the smallest share nationwide. While 32.0% of Americans 25 and older have a bachelor’s degree, in New Hampshire 36.9% do, the eighth largest share in the country. Individuals with higher educational attainment are more likely to be employed, and in New Hampshire just 2.4% of the labor force is unemployed, well below the 3.6% national rate.
[in-text-ad-2]

5. Washington
> 5 yr. GDP annual growth rate: +6.1% (the largest increase)
> 2018 GDP: $563.2 billion (12th largest)
> April 2019 unemployment: 4.7% (6th highest)
> 5 yr. annual employment growth: +2.4% (8th largest increase)
Washington ranks as one of the best economies in the United States due largely to its rapid economic growth — the 6.1% average annual GDP growth rate from 2013 to 2018 was the fastest of any state and far greater than the 4.1% national figure. Growth was led by the state’s information sector, which grew 72.9% from $43.2 billion in output in 2013 to $74.7 billion in 2018 — the sector’s second largest increase of any state other than Nevada. Some of the largest tech companies headquartered in Washington include Microsoft, Amazon, and Expedia.

6. Hawaii
> 5 yr. GDP annual growth rate: +4.0% (18th largest increase)
> 2018 GDP: $92.0 billion (13th smallest)
> April 2019 unemployment: 2.8% (tied — 8th lowest)
> 5 yr. annual employment growth: +1.3% (19th largest increase)
Despite slowing tourism — the sector lagged behind the nation as a whole in GDP growth from 2013 to 2018 — Hawaii remains one of the best economies in the United States due to its healthy job market and affluent population. Just 2.8% of the Hawaiian labor force is unemployed, far below the 3.6% national unemployment rate. The typical household earns $77,765 a year, $17,000 more than the U.S. median annual household income and the most of any state other than New Jersey and Maryland. While 13.4% of Americans live below the poverty line, Hawaii’s poverty rate is 9.5%, the fourth lowest in the nation.
[in-text-ad]
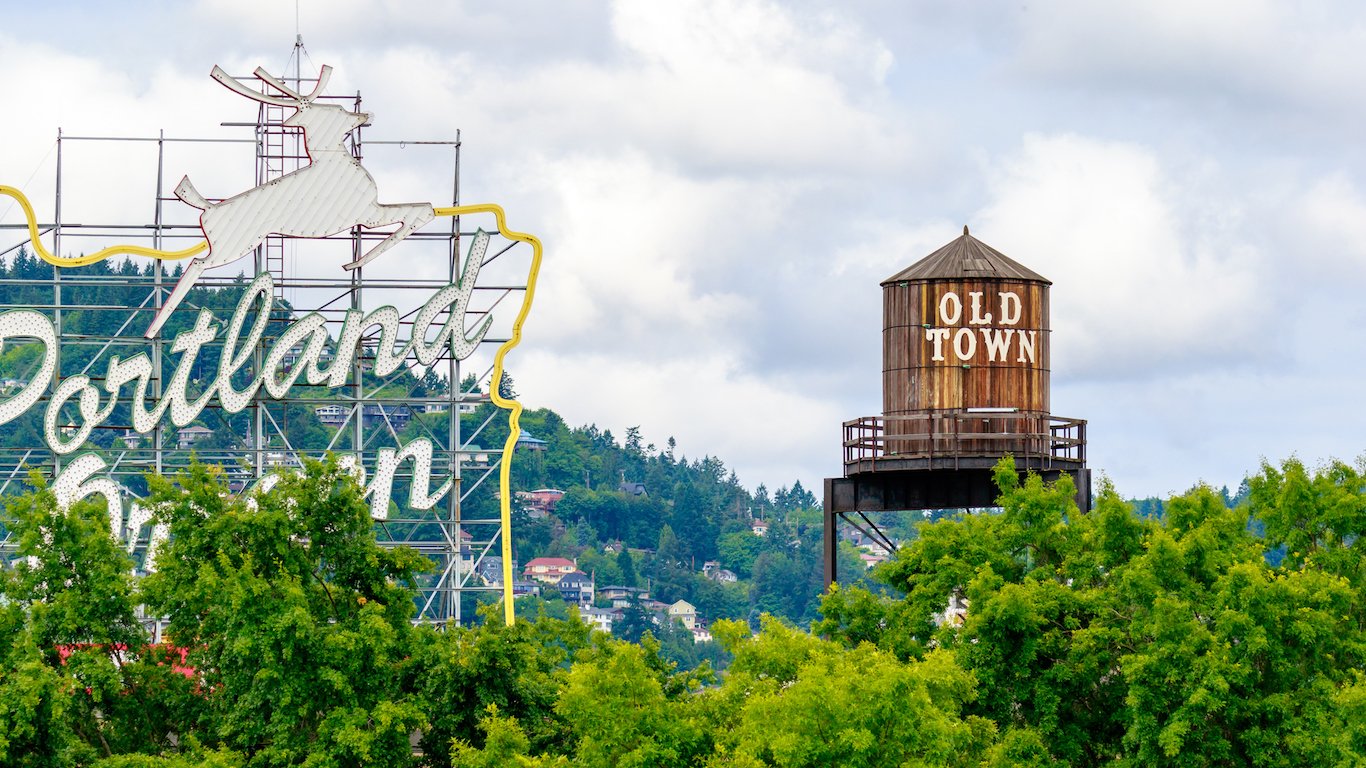
7. Oregon
> 5 yr. GDP annual growth rate: +5.9% (2nd largest increase)
> 2018 GDP: $238.7 billion (25th largest)
> April 2019 unemployment: 4.3% (tied — 9th highest)
> 5 yr. annual employment growth: +2.8% (5th largest increase)
Oregon is one of many states in the Western United States posting rapid economic growth over the past five years. The state’s GDP grew at an average annual rate of 5.9% from 2013 to 2018, the second fastest increase of any state and far greater than the 4.1% national figure. GDP growth was led by the state’s construction sector, which grew from $6.6 billion in 2013 to $11.0 billion in 2018, a 68.7% increase, outpacing the 43.0% growth rate for the sector nationwide. Some of the largest construction projects currently underway include the 600-room Hyatt Regency Portland at the Oregon Convention Center and the $1 billion Penny and Phil Knight Campus for Accelerating Scientific Impact at the University of Oregon.
[recirclink id=510120]

8. Maryland
> 5 yr. GDP annual growth rate: +3.9% (19th largest increase)
> 2018 GDP: $412.9 billion (15th largest)
> April 2019 unemployment: 3.8% (tied — 18th highest)
> 5 yr. annual employment growth: +1.0% (23rd smallest increase)
Some 39.7% of adults in Maryland have at least a bachelor’s degree, far more than the 32.0% national share and the third highest college attainment rate of any state. Areas with greater educational attainment are more likely to attract high-paying advanced industry, such as professional and business services and finance.
The professional and business services sector accounts for 14.2% of Maryland’s GDP, the sector’s fifth largest share of any state. The typical Maryland household earns over $20,000 more than the typical U.S. household annually, and just 9.3% of the state population lives below the poverty line — the second lowest poverty rate nationwide.
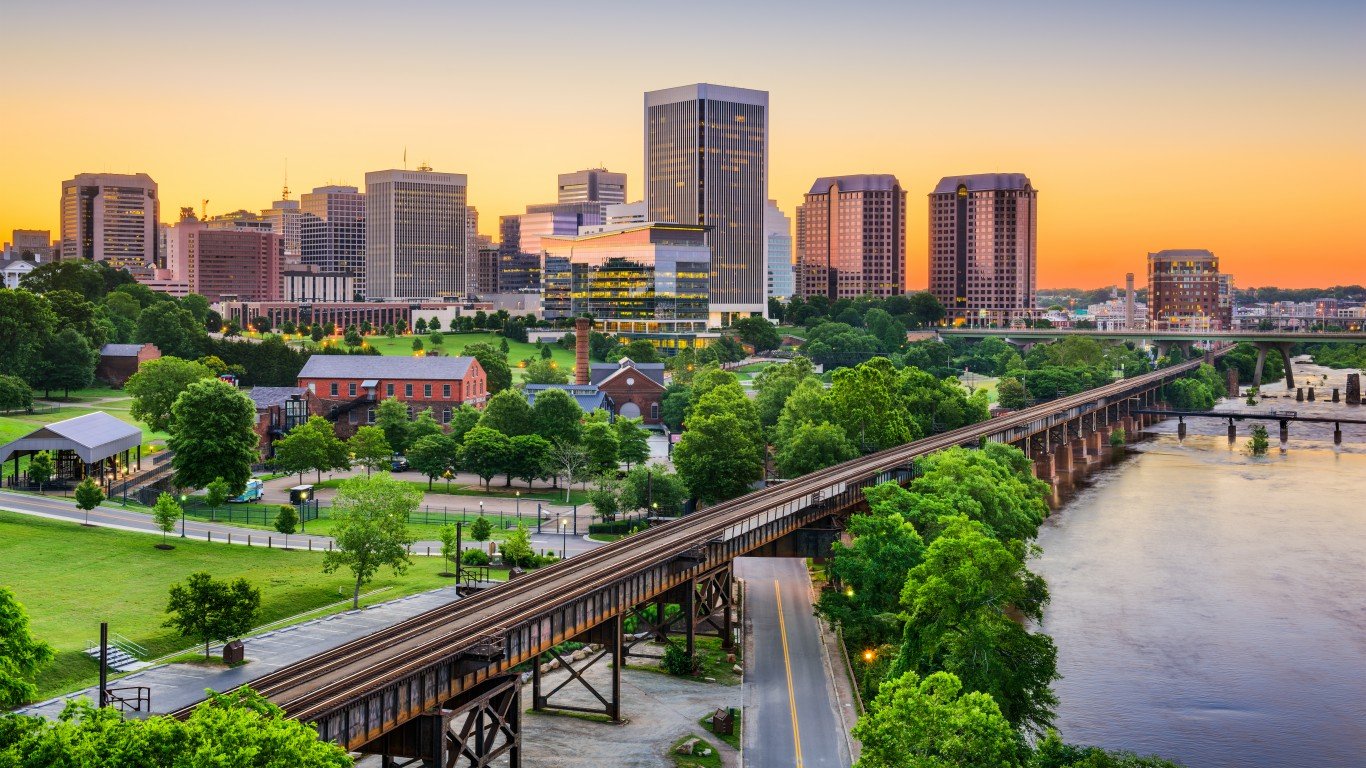
9. Virginia
> 5 yr. GDP annual growth rate: +3.3% (22nd smallest increase)
> 2018 GDP: $534.4 billion (13th largest)
> April 2019 unemployment: 2.9% (tied — 12th lowest)
> 5 yr. annual employment growth: +1.0% (24th smallest increase)
While 32.0% of Americans 25 and older have a bachelor’s degree, in Virginia 38.7% of adults do, the fifth largest share of any state. High educational attainment can be a major pull factor for businesses with advanced, high-paying jobs that tend to require a college degree, such as professional and business services. The professional and business services sector accounts for 19.0% of Virginia’s GDP, the largest share of any state.
Due to its proximity to Washington, D.C., a large share of the Virginia workforce also works in high-paying federal jobs. The typical Virginia household earns $71,535 a year, $11,000 more than the national median household income. Virginia also has one of the healthiest job markets in the country, with just 2.9% of the labor force unemployed.
[in-text-ad-2]

10. Minnesota
> 5 yr. GDP annual growth rate: +3.8% (22nd largest increase)
> 2018 GDP: $368.3 billion (17th largest)
> April 2019 unemployment: 3.3% (tied — 18th lowest)
> 5 yr. annual employment growth: +1.2% (22nd largest increase)
While 3.6% of the U.S. labor force is out of a job, in Minnesota the unemployment rate is 3.3%, tied as the 18th lowest of any state. Other factors contributing to Minnesota’s high rank include its high educational attainment and general prosperity. Some 93.1% of adults have a high school diploma, and 36.1% have a college degree, the highest and ninth highest such attainment rates, respectively. The typical Minnesota household outearns the U.S. median by about $8,000, and just 9.5% of state residents live in poverty — far below the 13.4% national poverty rate. The North Star State is also one of the cheaper states to live in, as goods and services cost 2.5% less in Minnesota han they do nationwide.
Despite its many pull factors, Minnesota has posted relatively lackluster growth over the last several years.

11. Idaho
> 5 yr. GDP annual growth rate: +4.8% (9th largest increase)
> 2018 GDP: $77.0 billion (10th smallest)
> April 2019 unemployment: 2.8% (tied — 8th lowest)
> 5 yr. annual employment growth: +2.8% (3rd largest increase)
From 2013 to 2018, Idaho’s GDP grew at an average annual rate of 4.8%, outpacing the 4.1% national growth rate. Growth was led by the state’s construction sector, which grew from $3.0 billion to $5.1 billion over the same period — the 69.3% increase was the fifth largest of any state. Construction now accounts for 6.7% of Idaho’s GDP, the largest share nationwide. Other fast-growing industries include professional and business services and the arts, entertainment, recreation, accommodation, and food services sector, which grew at nation-leading annual rates of 6.8% and 9.5%, respectively.
[in-text-ad]

12. Delaware
> 5 yr. GDP annual growth rate: +4.3% (16th largest increase)
> 2018 GDP: $75.0 billion (9th smallest)
> April 2019 unemployment: 3.2% (tied — 14th lowest)
> 5 yr. annual employment growth: +2.4% (9th largest increase)
The largest contributor to Delaware’s economic growth was the state’s finance, insurance, rental, and leasing sector, which grew an average of 6.4% a year, the fourth fastest increase nationwide. Many financial service firms are likely attracted to Delaware for the tax breaks and other accommodations the state enacted for the local banking industry. Today, the finance, insurance, rental, and leasing sector accounts for 45.3% of Delaware GDP, more than twice the 20.7% national figure and by far the largest share of any state.
[recirclink id=497115]
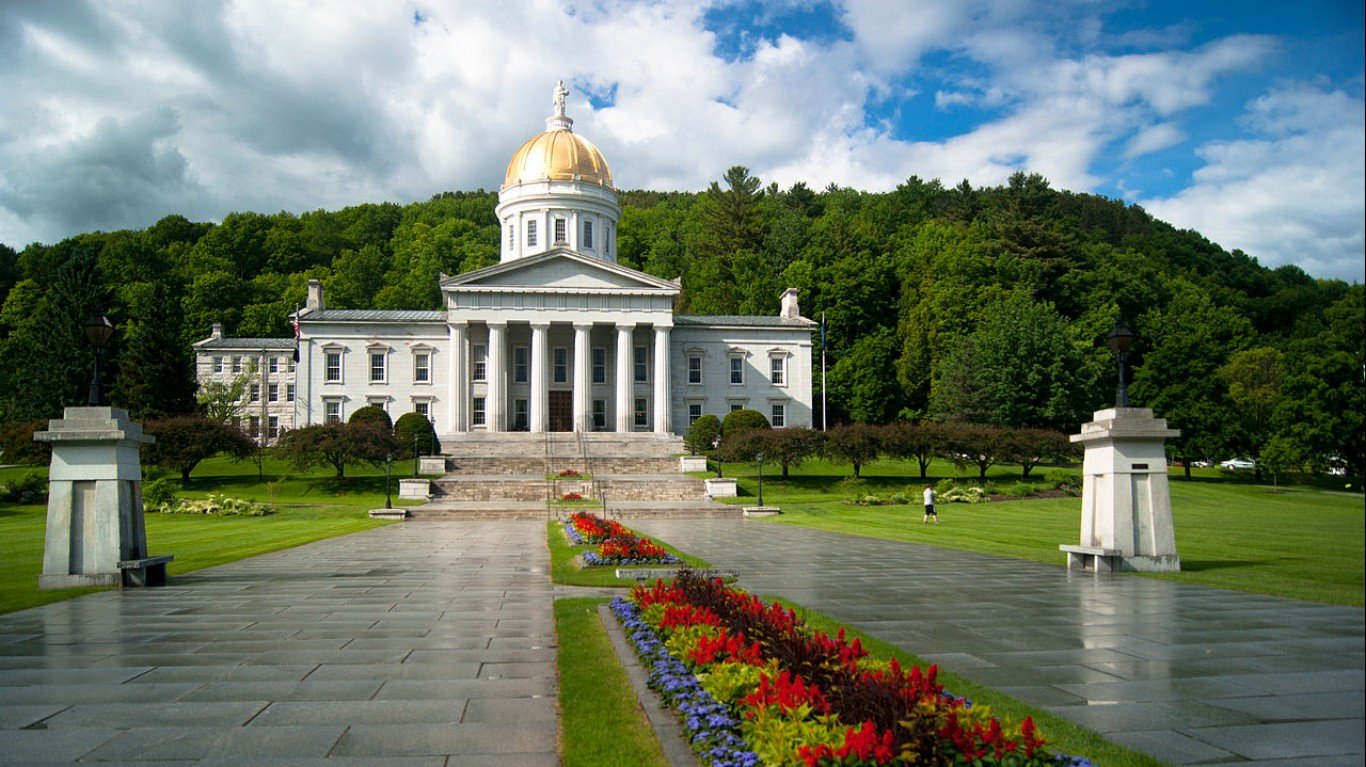
13. Vermont
> 5 yr. GDP annual growth rate: +3.0% (18th smallest increase)
> 2018 GDP: $33.7 billion (the smallest)
> April 2019 unemployment: 2.2% (the lowest)
> 5 yr. annual employment growth: +0.1% (5th smallest increase)
While 32.0% of Americans 25 and over hold a bachelor’s degree, in Vermont, 38.3% of adults do, the seventh largest share of any state. Some 92.6% of adults have a high school diploma, the sixth largest share. College graduates are more likely to be employed, and just 2.2% of the Vermont labor force is out of work and looking for a job — the lowest unemployment rate nationwide.
Despite this, Vermont lags behind most states in economic growth, and from 2013 to 2018 employment grew at an average annual rate of just 0.1% — the fifth smallest increase of any state. Likely partially as a result, more residents moved out of the state than moved in from 2010 to 2018. Some of the biggest drags on economic growth include the agriculture and utilities sectors.
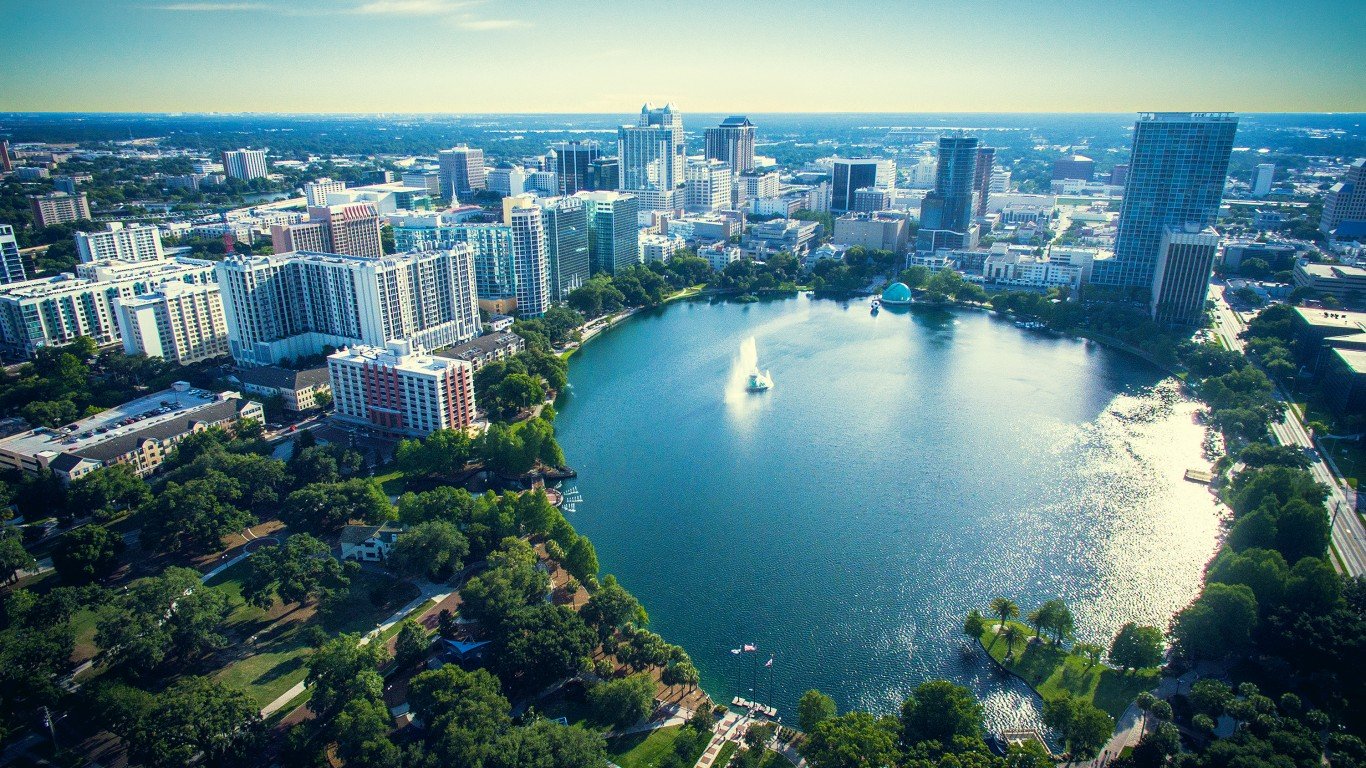
14. Florida
> 5 yr. GDP annual growth rate: +5.3% (5th largest increase)
> 2018 GDP: $1.0 trillion (4th largest)
> April 2019 unemployment: 3.4% (tied — 21st lowest)
> 5 yr. annual employment growth: +2.4% (7th largest increase)
Florida is one of many Sun Belt states posting heavy inbound migration. The state’s population grew by 11.9% due to net migration from 2010 to 2018 — surpassing New York as the third largest state in 2014 — by far the largest increase in the country. Likely partially as a result, Florida’s GDP grew at an average annual rate of 5.3% from 2013 to 2018, the fifth fastest increase of any state.
While Florida is outpacing the nation as a whole in GDP growth, the state lags behind the country as a whole in other measures of economic health. The median annual household income in Florida is roughly $8,000 below the national figure, and 14.0% of residents live in poverty — greater than the 13.4% national poverty rate. Just 29.7% of Florida adults have a bachelor’s degree, less than the 32.0% U.S. college attainment rate.
[in-text-ad-2]

15. Connecticut
> 5 yr. GDP annual growth rate: +2.1% (7th smallest increase)
> 2018 GDP: $274.2 billion (23rd largest)
> April 2019 unemployment: 3.8% (tied — 18th highest)
> 5 yr. annual employment growth: +1.2% (20th largest increase)
Some 38.7% of Connecticut adults have at least a bachelor’s degree, the fifth highest college attainment rate in the country. Individuals with higher educational attainment are more likely to have secure, high-paying jobs, and in Connecticut, the typical household earns $74,168 a year, nearly $14,000 more than the U.S. median and the fifth most of any state. The Connecticut economy is disproportionately composed of advanced, high-growth industries like finance and information
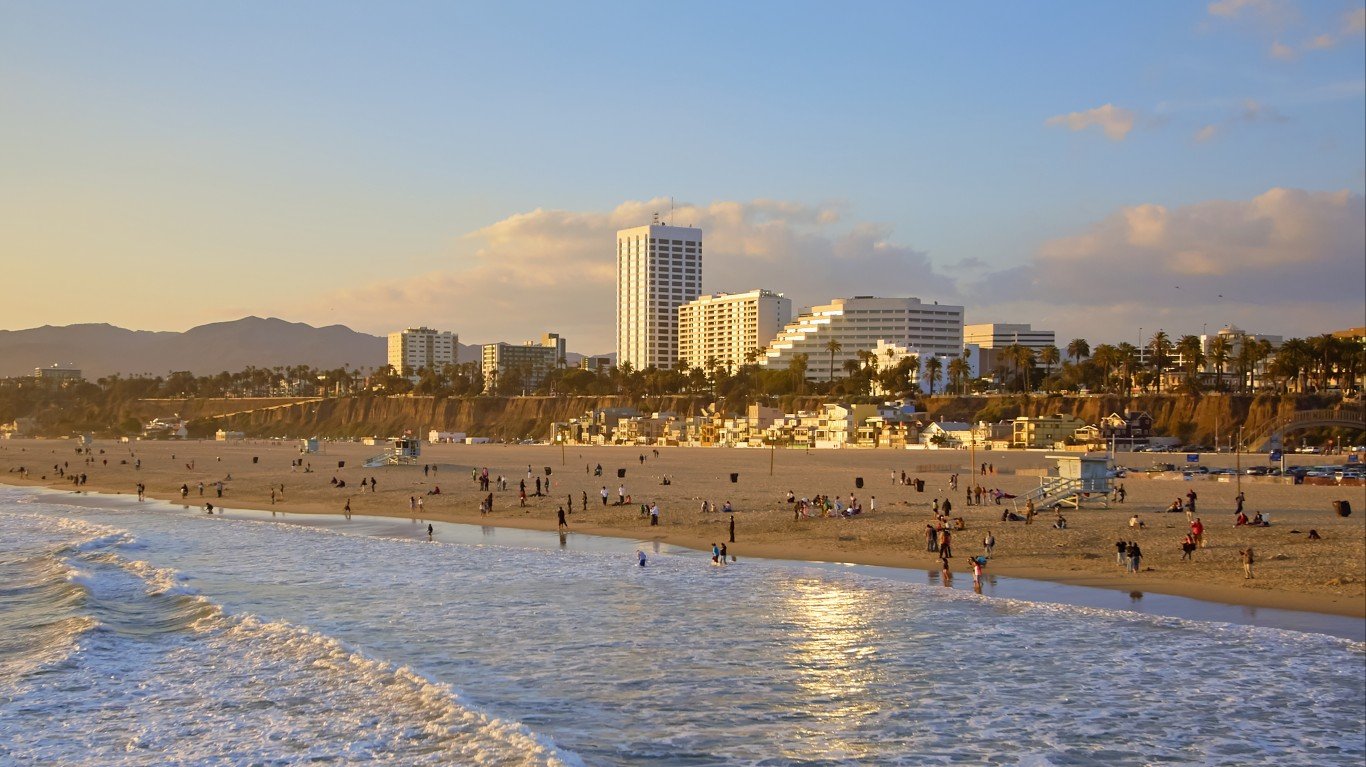
16. California
> 5 yr. GDP annual growth rate: +5.6% (4th largest increase)
> 2018 GDP: $3.0 trillion (the largest)
> April 2019 unemployment: 4.3% (tied — 9th highest)
> 5 yr. annual employment growth: +1.8% (17th largest increase)
The largest state economy, California’s share of the U.S. GDP has grown steadily from 13.5% in 2013 to 14.5% in 2018. Over the same period, California’s GDP grew at an average annual rate of 5.6%, faster than the 4.1% national figure and the fourth largest increase of any state. Growth was led by the state’s information sector, which grew at an average rate of 11.0% a year, more than in any state other than Washington and Nevada. Today, California’s information sector — which includes global tech giants such as Apple, Alphabet, Intel, Oracle, and Facebook — accounts for 10.3% of state GDP and 27.2% of the economic value generated by the sector nationwide.
[in-text-ad]

17. New Jersey
> 5 yr. GDP annual growth rate: +3.2% (21st smallest increase)
> 2018 GDP: $624.9 billion (8th largest)
> April 2019 unemployment: 3.9% (tied — 16th highest)
> 5 yr. annual employment growth: +0.3% (7th smallest increase)
In New Jersey, 39.7% of adults have at least a bachelor’s degree, the third largest share among states after Colorado and Massachusetts. Individuals with higher educational attainment are more likely to have advanced, high-paying jobs in major cities, and many New Jersey residents commute to jobs in nearby New York City and Philadelphia.
While New Jersey outranks a majority of states in wealth and education, population loss may be contributing to slowing economic growth in the Garden State. From 2010 to 2018, the population declined by 1.6% due to net migration, the seventh largest loss of any state. GDP grew at an average annual rate of 3.2% from 2013 to 2018, lagging behind the 4.1% national rate.
[recirclink id=550479]
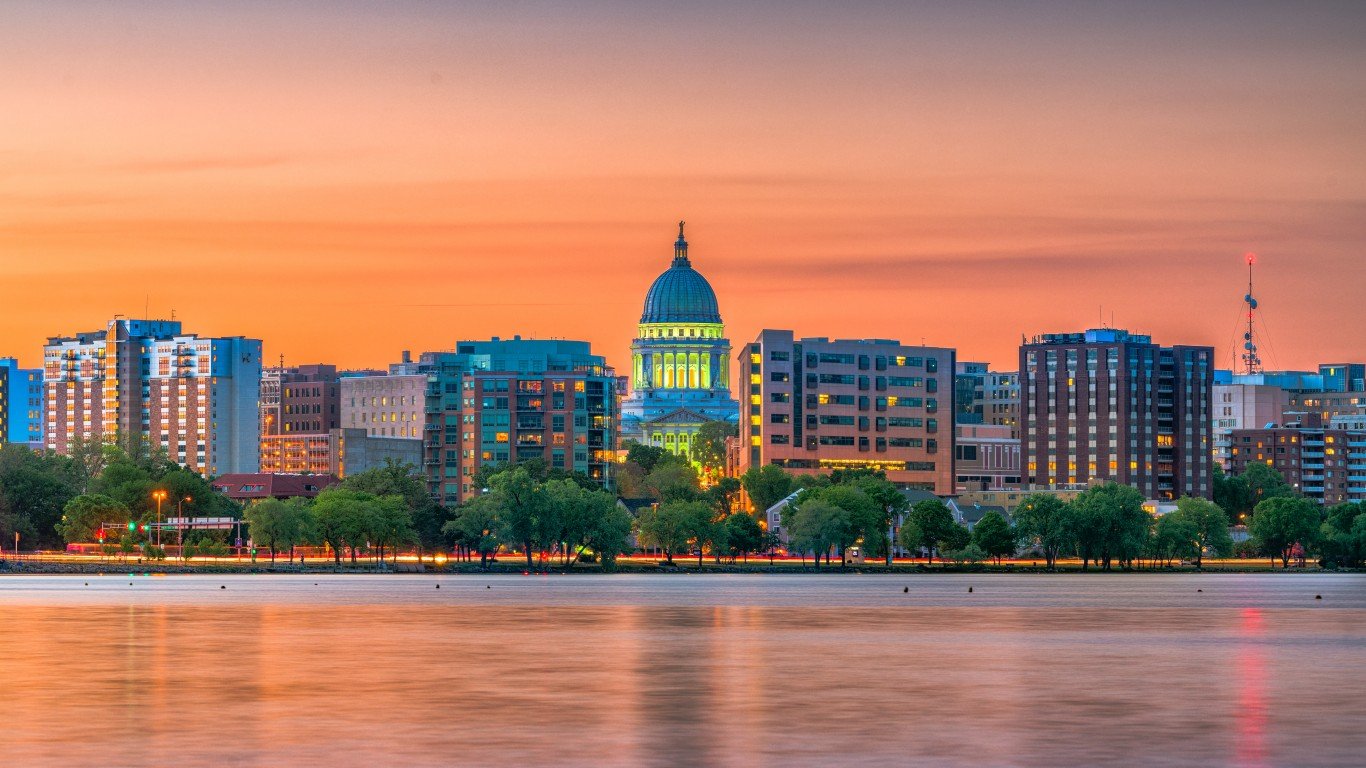
18. Wisconsin
> 5 yr. GDP annual growth rate: +3.6% (24th largest increase)
> 2018 GDP: $337.0 billion (21st largest)
> April 2019 unemployment: 2.8% (tied — 8th lowest)
> 5 yr. annual employment growth: +1.1% (23rd largest increase)
One of many states in the Great Lakes region with relatively lackluster economic growth over the past five years, Wisconsin’s GDP grew at an average annual rate of 3.6% from 2013 to 2018, slower than the 4.1% national figure. One factor separating Wisconsin from its neighboring states is the growth in its mining sector. Due in part to its booming frac sand industry, the output of the mining sector grew at an average annual rate of 23.0% from 2013 to 2018, the second largest increase of any state.

19. Georgia
> 5 yr. GDP annual growth rate: +5.0% (7th largest increase)
> 2018 GDP: $588.2 billion (9th largest)
> April 2019 unemployment: 3.8% (tied — 18th highest)
> 5 yr. annual employment growth: +2.4% (10th largest increase)
Georgia’s population grew 4.0% due to migration from 2010 to 2018, outpacing the 2.5% national rate. Unemployment fell from 7.3% in April 2014 to 3.8% in April 2019, the fourth largest decrease of any state. Georgia’s GDP grew at an average annual rate of 5.0% from 2013 to 2018, the seventh fastest increase nationwide.
While Georgia is outpacing the nation as a whole in GDP growth, the state lags behind the country as a whole in other measures of economic health. The median household income in Georgia is roughly $4,000 below the national median, and 14.9% of residents live in poverty — greater than the 13.4% national poverty rate. Some 30.9% of Georgia adults have a bachelor’s degree, less than the 32.0% U.S. college attainment rate.
[in-text-ad-2]
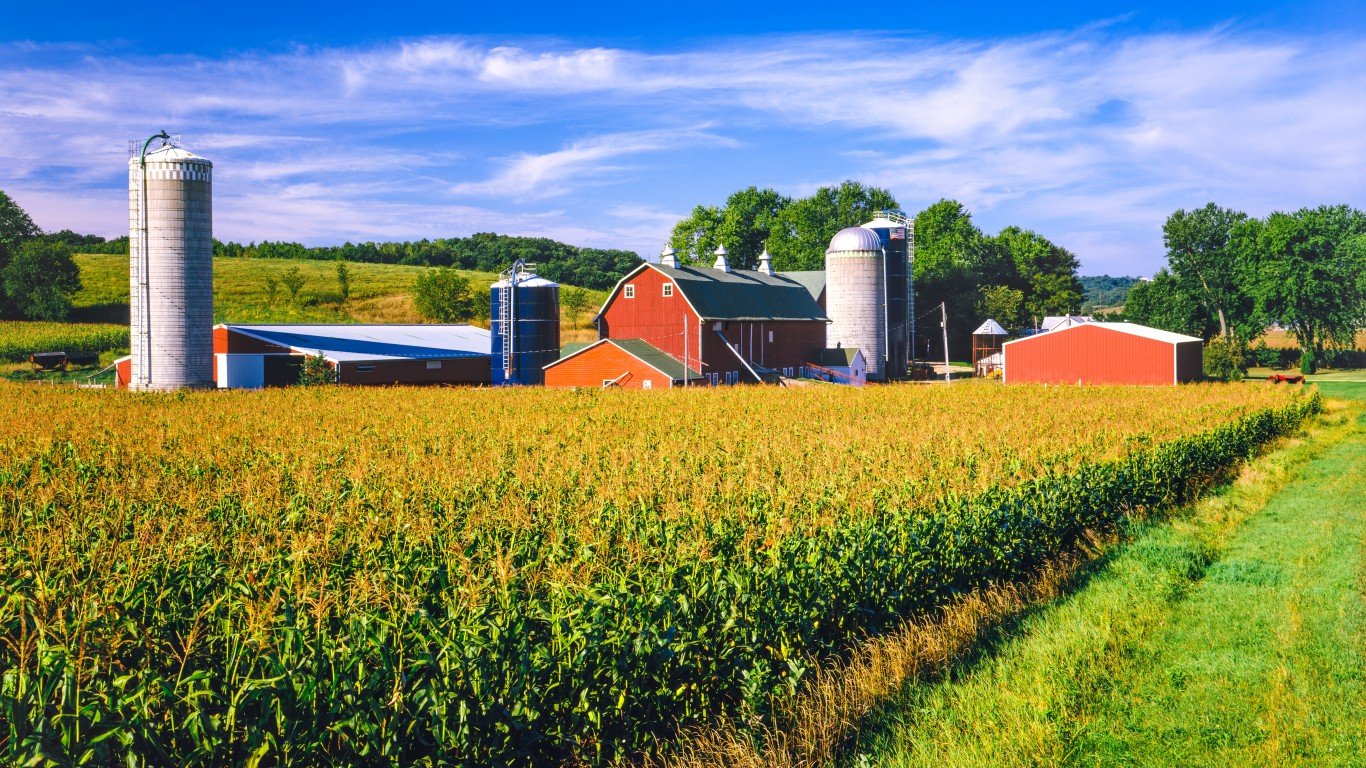
20. Iowa
> 5 yr. GDP annual growth rate: +3.5% (24th smallest increase)
> 2018 GDP: $190.2 billion (21st smallest)
> April 2019 unemployment: 2.4% (tied — 4th lowest)
> 5 yr. annual employment growth: +0.6% (13th smallest increase)
One of the many manufacturing-dependent states in the Plains region with relatively lackluster economic growth in recent years, Iowa’s GDP grew at an average annual rate of 3.5% from 2013 to 2018, slower than the 4.1% national rate. Growth was led by the finance, insurance, real estate, rental, and leasing sector, which grew at an average annual rate of 7.6% — the second fastest rate of any state.
Iowa is one of the cheapest states to live in — goods and services cost 10.2% less in Iowa than they do nationwide — and has one of the healthiest job markets. Just 2.4% of the labor force is out of work and looking for a job, tied with New Hampshire as the fourth lowest unemployment rate. Low unemployment can help lessen financial struggle, and just 10.7% of Iowa residents live in poverty, less than the 13.4% national figure. Despite these pull factors, Iowa’s population growth due to net migration was roughly one-third the national rate from 2010 to 2018.
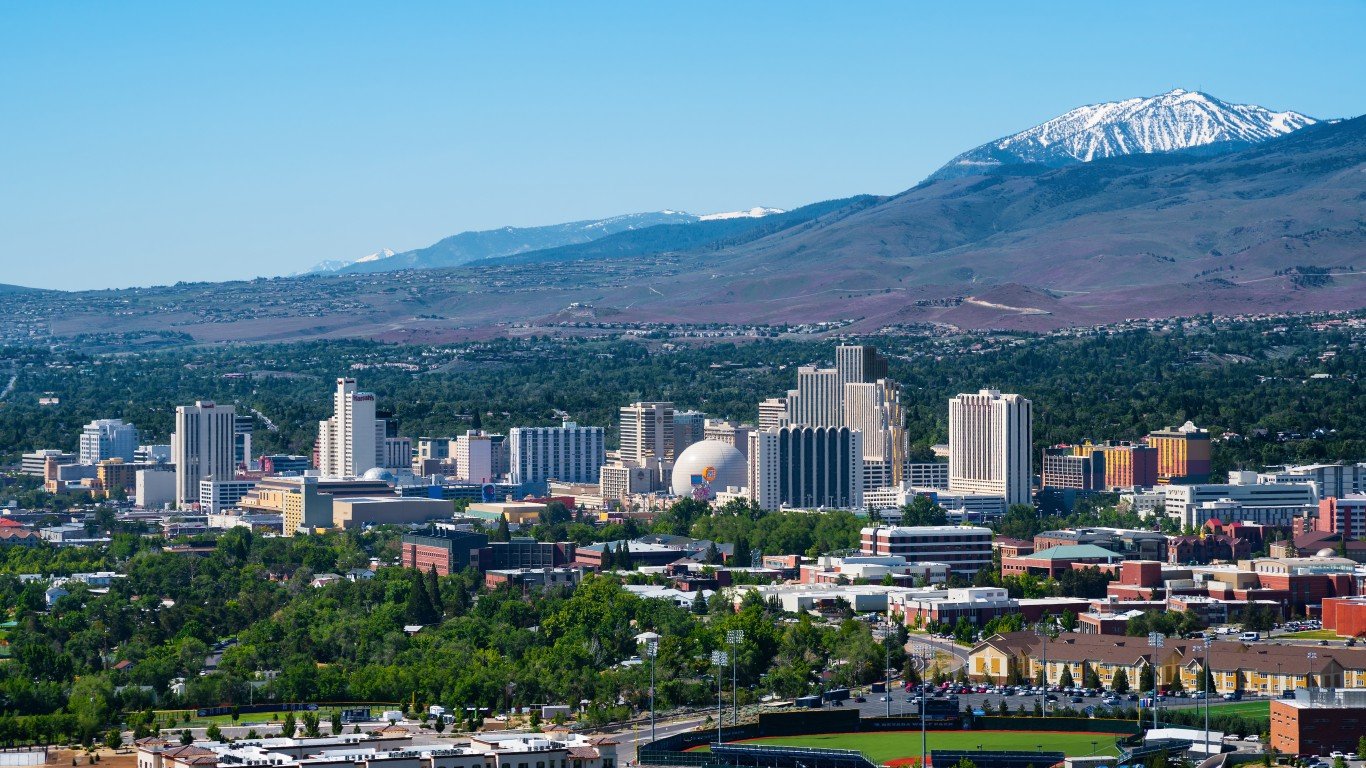
21. Nevada
> 5 yr. GDP annual growth rate: +4.9% (8th largest increase)
> 2018 GDP: $165.8 billion (18th smallest)
> April 2019 unemployment: 4.0% (tied — 13th highest)
> 5 yr. annual employment growth: +2.8% (4th largest increase)
The GDP of Nevada grew at an average annual rate of 4.9% from 2013 to 2018, the eighth largest increase of any state. Growth was driven by the state’s booming information sector, which grew at a nation-leading pace of 13.2% over the same period — more than twice the sector’s national growth rate. Some of the biggest recent tech investments in the state include an Apple data center in Sparks completed in February 2019, a Google data center in Henderson slated for completion in December 2020, and the Tesla’s battery assembly facility Gigafactory 1 in Sparks, currently operational and undergoing further construction.
While Nevada is posting some of the fastest GDP growth rates in the nation, it lags behind the country as a whole in other measures of economic health. Just 24.9% of adults have at least a bachelor’s degree, the sixth smallest share of any state. Additionally, while unemployment has fallen more in Nevada over the last five years than in any state other than Rhode Island, some 4.0% of the Nevada workforce remains out of work, above the 3.6% national figure.
[in-text-ad]

22. Maine
> 5 yr. GDP annual growth rate: +3.7% (23rd largest increase)
> 2018 GDP: $64.4 billion (8th smallest)
> April 2019 unemployment: 3.3% (tied — 18th lowest)
> 5 yr. annual employment growth: +0.5% (10th smallest increase)
With a GDP of $64.4 billion, Maine is the eighth smallest economy in the United States. The state economy has experienced a relatively lackluster growth over the past five years, with GDP increasing at an average annual rate of 3.7% — compared to 4.1% nationwide. Some of the fastest growing sectors include arts, entertainment, recreation, accommodation, and food services, professional and business services, and construction. Meanwhile, the fastest shrinking sectors include mining and utilities.
In other measures of economic health, Maine is roughly in line with the nation as a whole. Some 32.1% of adults have a bachelor’s degree, compared to the 32.0% national college attainment rate. Additionally, 3.3% of the Maine workforce is out of a job, slightly below the 3.6% national unemployment rate.
[recirclink id=526773]
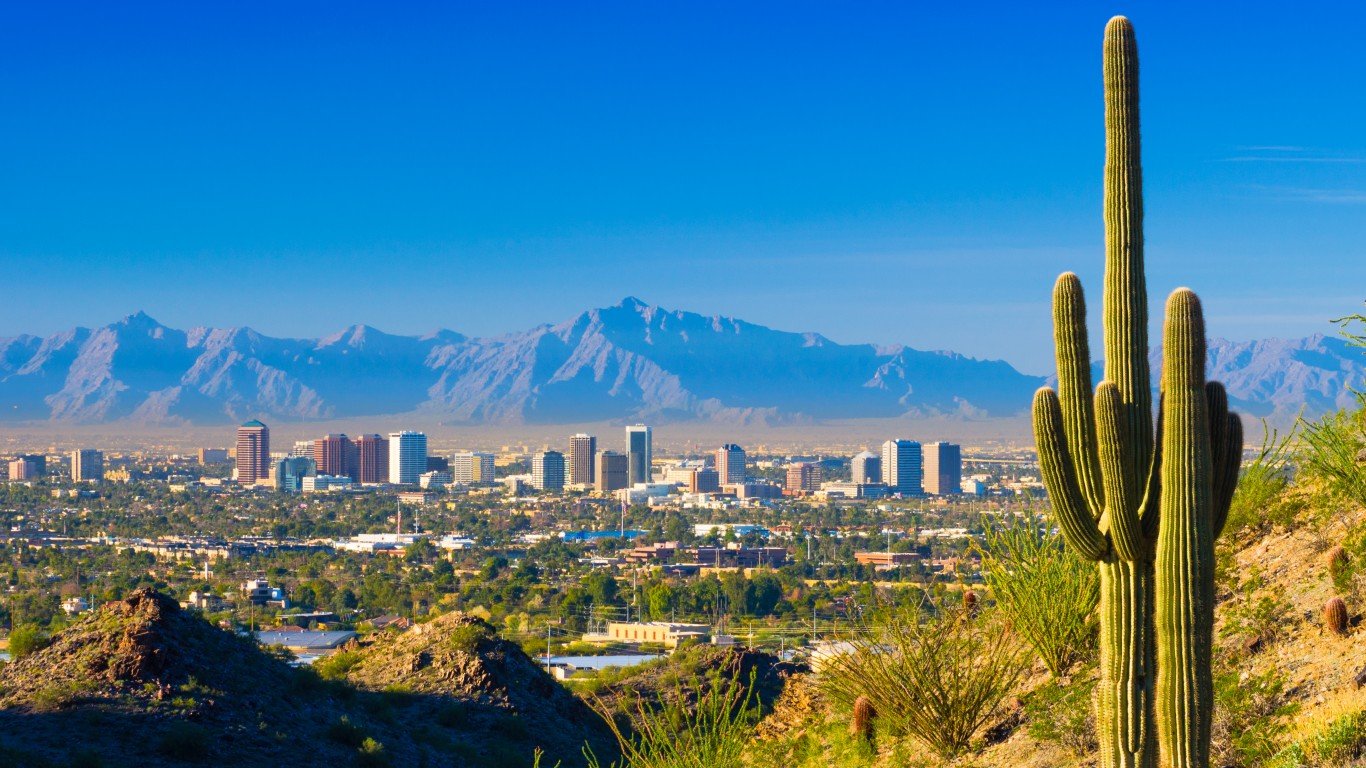
23. Arizona
> 5 yr. GDP annual growth rate: +4.7% (10th largest increase)
> 2018 GDP: $346.8 billion (20th largest)
> April 2019 unemployment: 4.9% (tied — 3rd highest)
> 5 yr. annual employment growth: +3.2% (the largest increase)
The population of Arizona increased 7.9% due to net migration from 2010 to 2018, more than three times the 2.5% national rate and the fourth most of any state. Employment grew at an average annual rate of 3.2% from 2013 to 2018, more than twice the national growth rate and the largest increase of any state.
While Arizona is outpacing the nation as a whole in GDP growth, the state lags behind the country as a whole in other measures of economic health. The typical household earns roughly $4,000 less than the typical U.S. household annually, and 14.9% of residents live in poverty — more than the 13.4% national poverty rate. Arizona also has one of the least healthy job markets of any state. Some 4.3% of the Arizona workforce is currently unemployed, the third highest unemployment rate nationwide.
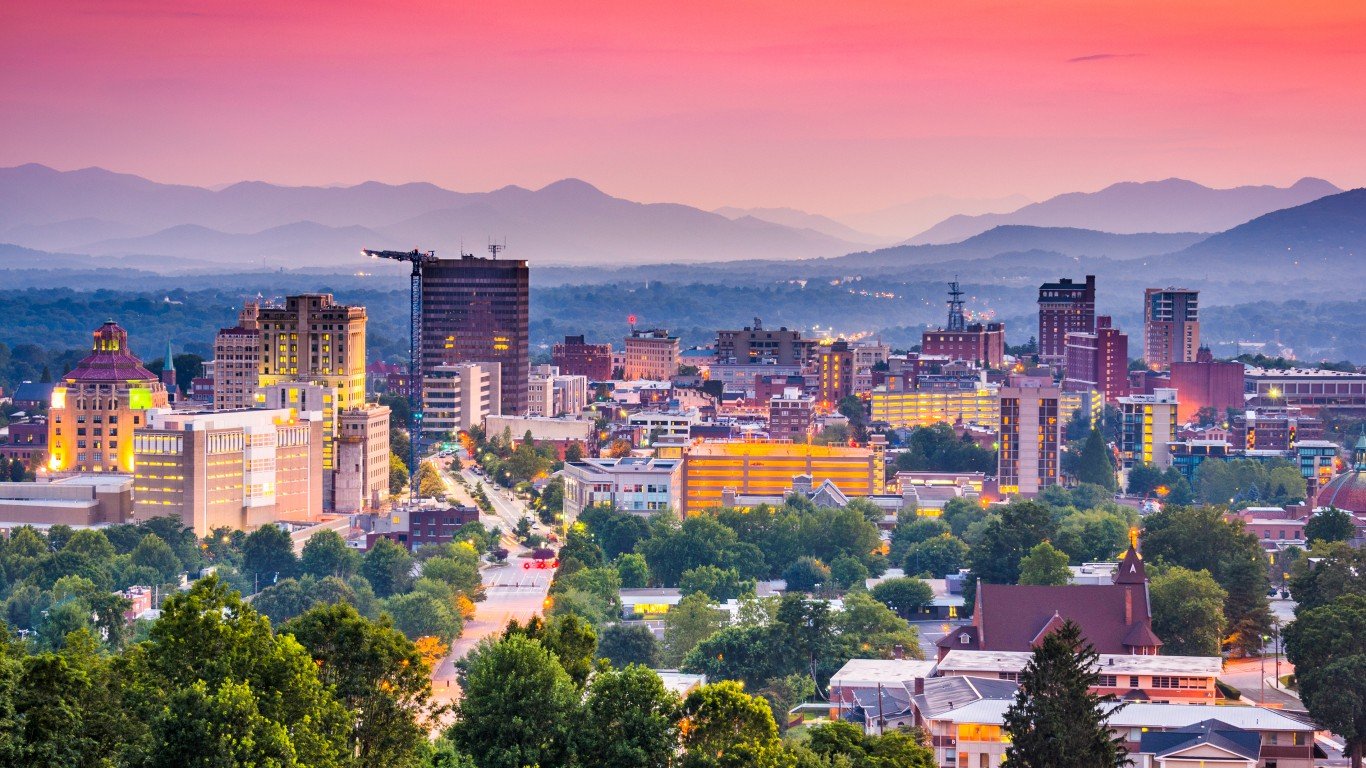
24. North Carolina
> 5 yr. GDP annual growth rate: +4.4% (14th largest increase)
> 2018 GDP: $565.8 billion (11th largest)
> April 2019 unemployment: 4.0% (tied — 13th highest)
> 5 yr. annual employment growth: +2.1% (14th largest increase)
The population of North Carolina grew 5.9% due to net migration from 2010 to 2018, more than twice the 2.5% national rate. GDP grew at an average annual rate of 4.4% from 2013 to 2018, outpacing the 4.1% national GDP growth rate. Like the nation as a whole, the fastest-growing sectors in North Carolina were construction, information, and transportation and warehousing.
Some factors likely attracting new residents to North Carolina may be the state’s low cost of living — goods and services cost 8.7% less in North Carolina than they do nationwide — and housing affordability. Still, North Carolina lags behind the country as a whole in other measures important to economic health. Some 14.7% of North Carolina residents live in poverty, and 4.0% of the workforce is unemployed — both greater than the respective national rates of 13.4% and 3.6%.
[in-text-ad-2]
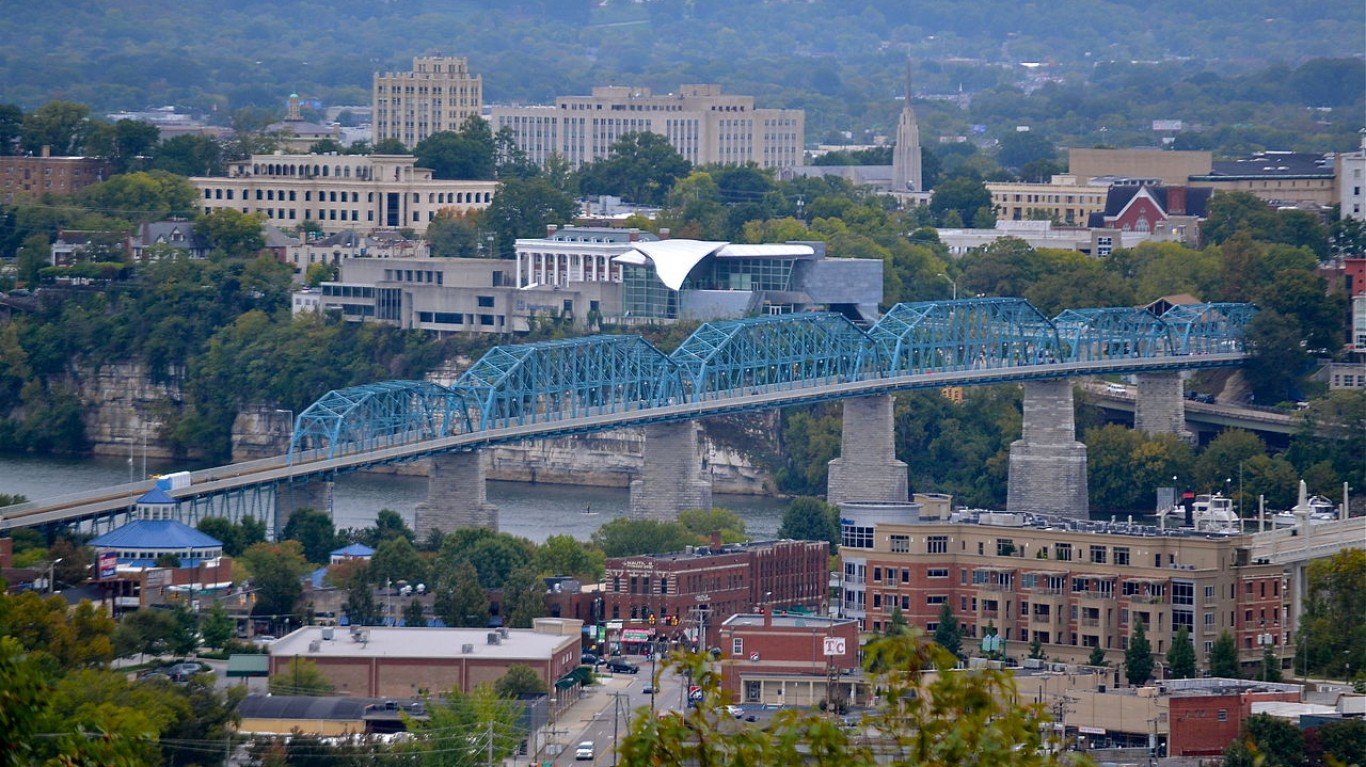
25. Tennessee
> 5 yr. GDP annual growth rate: +4.5% (12th largest increase)
> 2018 GDP: $365.6 billion (19th largest)
> April 2019 unemployment: 3.2% (tied — 14th lowest)
> 5 yr. annual employment growth: +2.1% (15th largest increase)
From 2010 to 2018, the population of Tennessee grew at an average annual rate of 4.6% due to net migration, outpacing the 2.5% national rate. Some pull factors likely include the state’s low cost of living — goods and services cost 9.6% less in Tennessee than they do nationwide — and falling unemployment. The unemployment rate fell from 6.6% in April 2014 to 3.2% in April 2019 — the sixth largest percentage-point drop of any state. From 2013 to 2018 the GDP of Tennessee grew at an average annual rate of 4.5% — greater than the 4.1% national figure.
In other measures of economic health, however, Tennessee lags far behind the country as a whole. Just 27.3% of adults have a bachelor’s degree, far below the 32.0% national college attainment rate. Individuals with less college attainment are more likely to struggle financially, and 15.0% of residents in Tennessee live in poverty — the 10th highest poverty rate of any state.

26. South Carolina
> 5 yr. GDP annual growth rate: +4.7% (11th largest increase)
> 2018 GDP: $230.4 billion (25th smallest)
> April 2019 unemployment: 3.4% (tied — 21st lowest)
> 5 yr. annual employment growth: +2.1% (13th largest increase)
The population of South Carolina increased by 7.8% due to net migration from 2010 to 2018, the fifth most of any state. Some pull factors may include the state’s low cost of living — goods and services cost 9.6 cents less on the dollar in the state than they do nationwide — warm Sun Belt climate, and falling unemployment. While the U.S. unemployment rate fell from 6.2% in April 2014 to 3.6% in April 2019, the South Carolina unemployment rate fell from 6.3% to 3.4%.
Some factors contributing to South Carolina’s economy rank in the lower half of states, however, may be the state’s low educational attainment and high poverty rate. Just 28.0% of adults have a bachelor’s degree, far below the 32.0% national college attainment rate. Some 15.4% of South Carolina residents live in poverty, the ninth highest poverty rate of any state.
[in-text-ad]
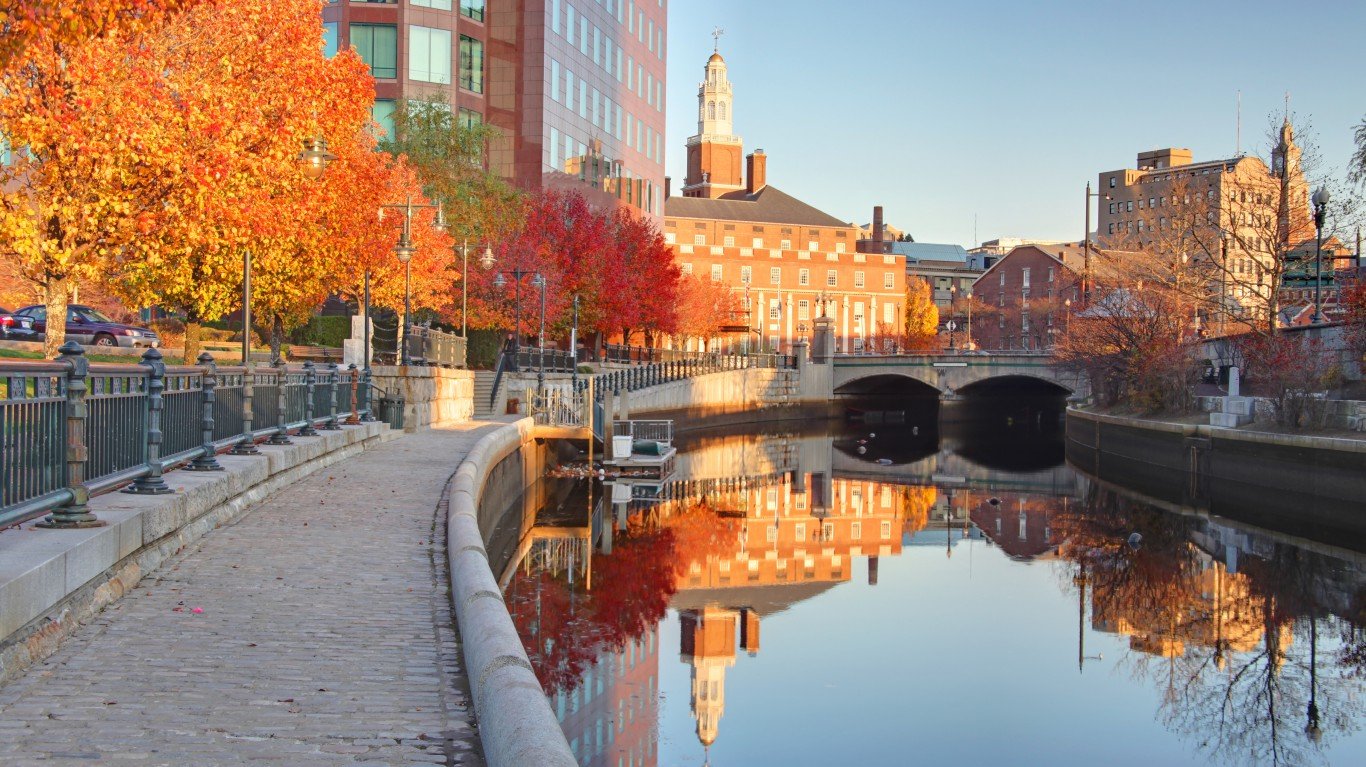
27. Rhode Island
> 5 yr. GDP annual growth rate: +2.8% (15th smallest increase)
> 2018 GDP: $61.0 billion (7th smallest)
> April 2019 unemployment: 3.7% (tied — 23rd highest)
> 5 yr. annual employment growth: +1.1% (25th largest increase)
With a GDP of just $61.0 billion, Rhode Island is the seventh smallest state economy. Rhode Island is a heavily service-oriented economy, with a wealthy, educated population. The state had the largest decline in unemployment of any state over the past five years. Unemployment fell from 8.2% in April 2014 — the highest of any state — to 3.7% in April 2019, just slightly above the current national unemployment rate of 3.6%.
Despite falling unemployment and general prosperity, Rhode Island’s population shrank as a result of net migration over the last several years, and the state has experienced lackluster economic growth. The state’s GDP grew at an average annual rate of 2.8%, far less than the 4.1% national figure.
[recirclink id=504457]

28. Nebraska
> 5 yr. GDP annual growth rate: +2.7% (13th smallest increase)
> 2018 GDP: $123.0 billion (16th smallest)
> April 2019 unemployment: 2.9% (tied — 12th lowest)
> 5 yr. annual employment growth: +0.2% (6th smallest increase)
With a GDP of $123.0 billion, Nebraska is the 16th smallest state economy. The Nebraska economy is heavily dependent on the agriculture sector, which contracted at an average annual rate of 5.3% from 2013 to 2018 throughout the United States. In Nebraska, the sector shrunk at an average annual rate of 10.2%, falling from $10.1 billion to $5.9 billion over that time. Meanwhile, the fastest growing sectors in the state included utilities, finance, and information. Overall, the GDP of Nevada grew at an average rate of 2.7% from 2013 to 2018, far slower than the 4.1% national rate.

29. New York
> 5 yr. GDP annual growth rate: +4.3% (15th largest increase)
> 2018 GDP: $1.7 trillion (3rd largest)
> April 2019 unemployment: 3.9% (tied — 16th highest)
> 5 yr. annual employment growth: +0.6% (11th smallest increase)
New York population increased 0.8% between 2010 and 2018, much smaller than most states. Some factors keeping residents away may include the high cost of living — including exorbitant housing expenses — and high unemployment. Goods and services cost 15.8 cents more on the dollar in the state than they do nationwide, the highest cost of living of any state other than Hawaii. A typical house in New York costs 4.8 times the state’s median household income, higher than the 3.6 times average nationwide, and the sixth worst affordability ratio of all states. Additionally, the unemployment rate of 3.9% is higher than the national rate of 3.6%.
[in-text-ad-2]
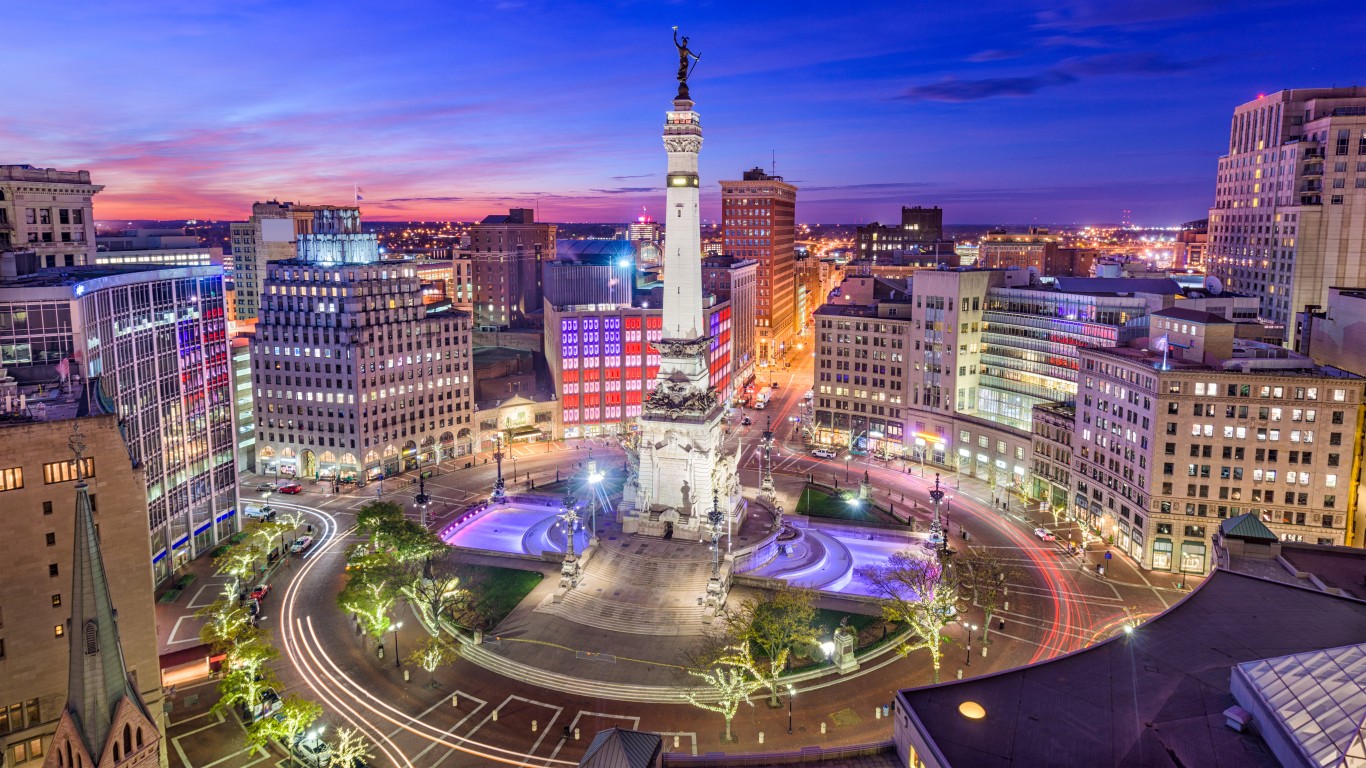
30. Indiana
> 5 yr. GDP annual growth rate: +3.5% (25th largest increase)
> 2018 GDP: $366.7 billion (18th largest)
> April 2019 unemployment: 3.6% (tied — 25th highest)
> 5 yr. annual employment growth: +2.1% (12th largest increase)
Indiana is one of several states in the Great Lakes region to experience sluggish economic growth over the past several years. The GDP of Indiana grew at an average annual rate of 3.5% from 2013 to 2018, trailing behind the 4.1% national growth rate.
In other measures of economic health, Indiana is roughly in line with the nation as a whole. Some 3.6% of the Indiana workforce is out of work and looking for a job — equivalent to the national unemployment rate — and 13.5% of residents live in poverty, compared to the 13.4% national poverty rate.

31. Kansas
> 5 yr. GDP annual growth rate: +3.1% (19th smallest increase)
> 2018 GDP: $167.0 billion (19th smallest)
> April 2019 unemployment: 3.5% (22nd lowest)
> 5 yr. annual employment growth: +0.4% (8th smallest increase)
The population of Kansas declined by 1.8% due to net migration from 2010 to 2018, the fourth largest contraction of any state. Declining population change can be a contributor to — or sign of — economic contraction, and from 2013 to 2018 the GDP of Kansas grew at an average annual rate of 3.1% a year, trailing behind the 4.1% national growth rate. Some of the fastest growing sectors include manufacturing, finance, and professional and business services. Meanwhile, some of the sectors that declined include mining, agriculture, and information.
Despite its sluggish GDP growth, Kansas ranks above the majority of states in other measures of economic well-being. Some 33.7% of adults in Kansas have at least a bachelor’s degree, above the 32.0% national college attainment rate. Individuals with greater educational attainment are less likely to struggle financially, and just 11.9% of Kansas residents live in poverty — less than the 13.4% national rate.
[in-text-ad]

32. Texas
> 5 yr. GDP annual growth rate: +3.4% (23rd smallest increase)
> 2018 GDP: $1.8 trillion (2nd largest)
> April 2019 unemployment: 3.7% (tied — 23rd highest)
> 5 yr. annual employment growth: +2.0% (16th largest increase)
Texas is one of several states to have trailed the U.S. as a whole in economic growth over the past several years. The GDP of the Texas mining sector shrank from $183.3 billion in 2013 to $148.3 billion in 2018 — this 19.1% decline was the largest percentage drop of any industry in the state. Meanwhile, some of the fastest growing sectors were arts, entertainment, recreation, accommodation, and food services, construction, and finance and insurance. Overall, Texas’s GDP grew at an average annual rate of 3.4% from 2013 to 2018, slower than the 4.1% national growth rate.
Texas also lags behind the nation as a whole in other measures of economic health. Just 29.6% of adults in Texas have a bachelor’s degree, less than the 32.0% national college attainment rate. Businesses with advanced, high-paying jobs are less likely to move to areas with low educational attainment, and areas with lower college attainment rates are more likely to be low-income overall. In Texas 14.7% of residents live in poverty, more than the 13.4% national poverty rate.
[recirclink id=554405]

33. Montana
> 5 yr. GDP annual growth rate: +2.6% (11th smallest increase)
> 2018 GDP: $49.0 billion (3rd smallest)
> April 2019 unemployment: 3.6% (tied — 25th highest)
> 5 yr. annual employment growth: +1.0% (25th smallest increase)
From 2013 to 2018, the GDP of Montana grew at an average annual rate of 2.6%, trailing far behind the national growth rate of 4.1%. Like the U.S. as a whole, mining was the largest drag on economic growth. The economic output generated by mining, quarrying, and oil and gas extraction fell from $2.7 billion in 2013 to $1.8 billion in 2018, more than twice the rate of decline for the national mining sector.
In other measures of economic well-being, Montana ranks near the middle of all states. Some 3.6% of the labor force is unemployed — equivalent to the national unemployment rate — and 32.3% of residents have a bachelor’s degree, roughly in line with the 32.0% national college attainment rate. Some 12.5% of Montana residents live in poverty, compared to 13.4% of Americans nationwide.
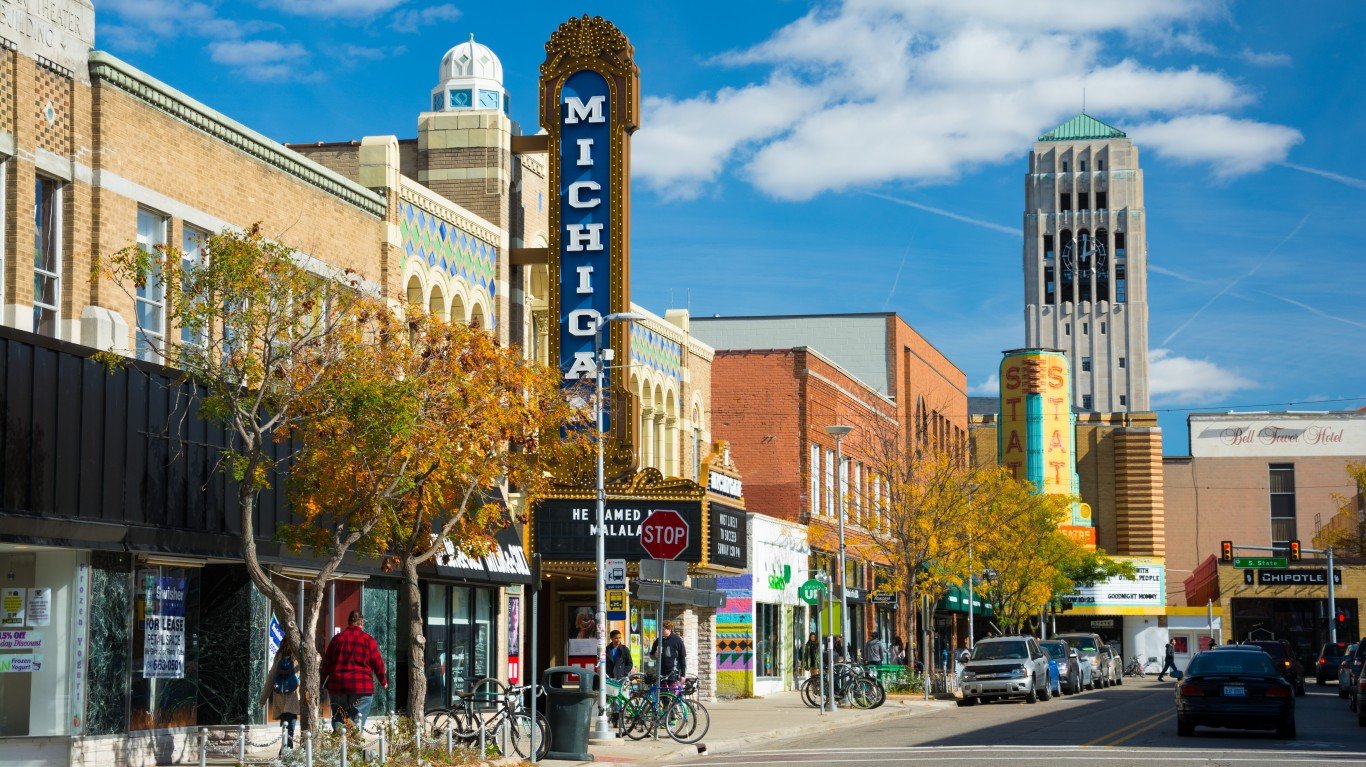
34. Michigan
> 5 yr. GDP annual growth rate: +4.1% (17th largest increase)
> 2018 GDP: $528.0 billion (14th largest)
> April 2019 unemployment: 4.1% (12th highest)
> 5 yr. annual employment growth: +1.8% (18th largest increase)
Michigan is one of several states in the Great Lakes region to rank in the bottom half of the state economies. From 2010 to 2018, more residents moved out of Michigan than moved in, and the population grew at roughly one-fifth the national rate overall. Despite declining more over the past five years than all but two states, Michigan’s unemployment rate remains relatively high at 4.1%, far above the 3.6% national figure.
Despite below-average population growth and above-average unemployment, Michigan’s economy kept pace with the nation as a whole over the past five years, increasing at an average annual rate of 4.1% from 2013 to 2018.
[in-text-ad-2]
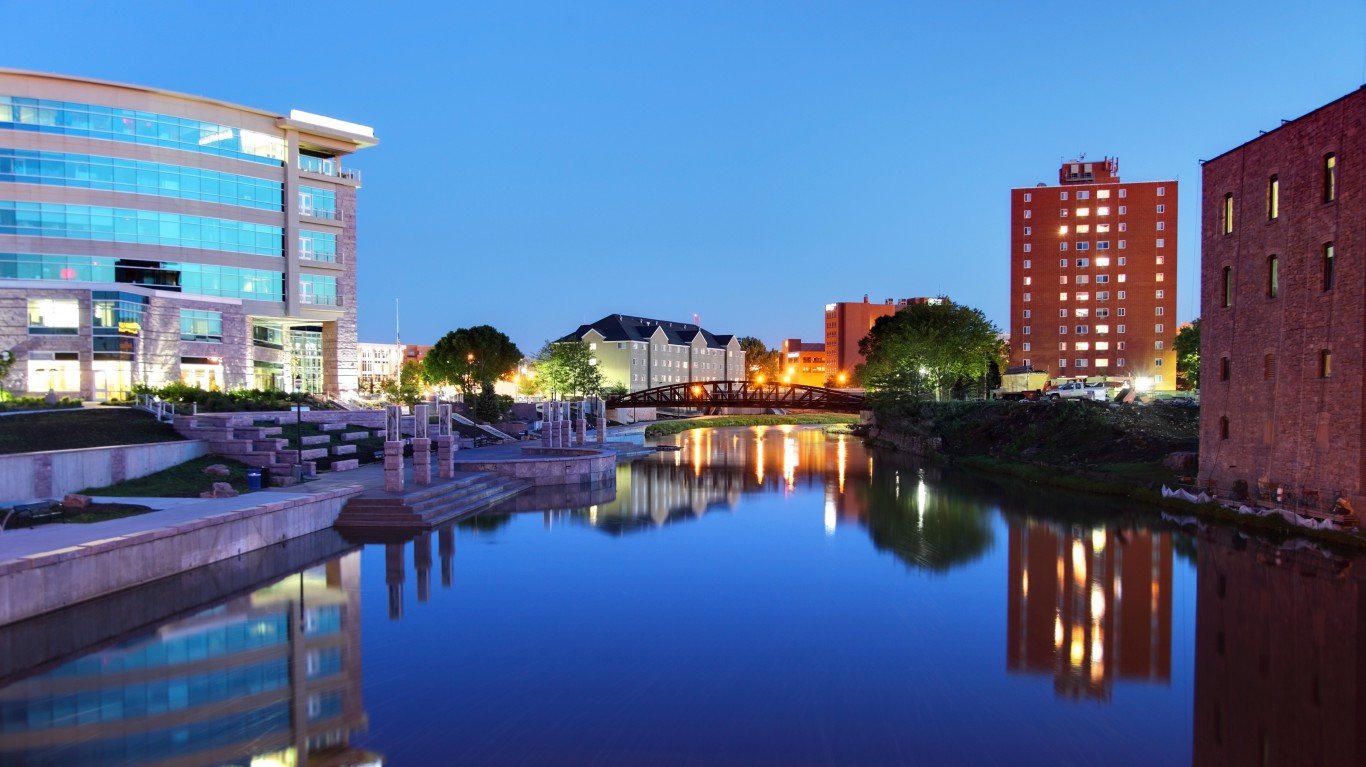
35. South Dakota
> 5 yr. GDP annual growth rate: +2.9% (16th smallest increase)
> 2018 GDP: $51.6 billion (4th smallest)
> April 2019 unemployment: 2.8% (tied — 8th lowest)
> 5 yr. annual employment growth: +0.9% (20th smallest increase)
The GDP of South Dakota grew at an average rate of 2.9% a year from 2013 to 2018, lagging behind the 4.1% national growth rate. The biggest contributor to South Dakota’s GDP growth was the finance, insurance, real estate, rental, and leasing sector, which grew from $10.6 billion to $13.2 billion. Meanwhile, the biggest drags on GDP growth came from the mining and agriculture sectors.
One factor limiting economic growth in South Dakota may be the relative lack of highly educated labor in the state. While 32.0% of Americans 25 and over have a bachelor’s degree, in South Dakota just 28.1% of adults have a four-year college diploma.
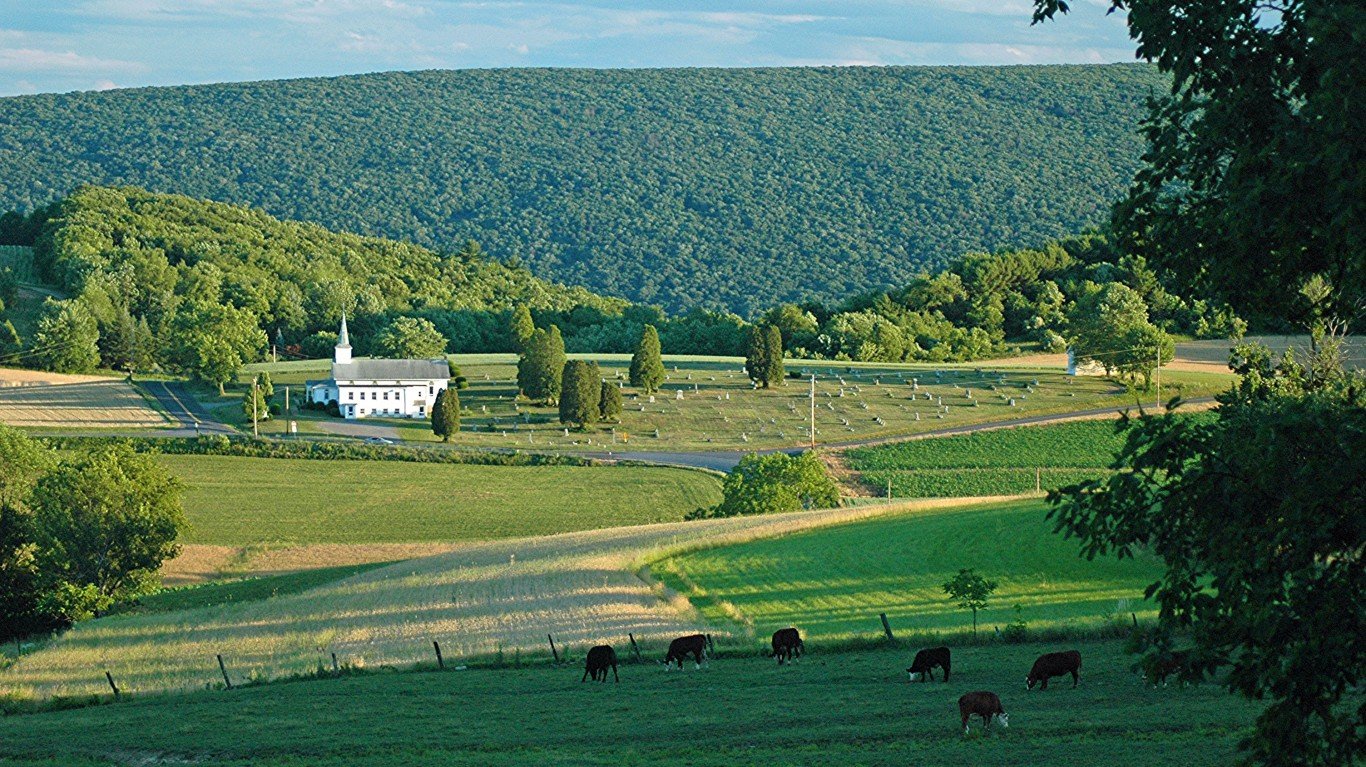
36. Pennsylvania
> 5 yr. GDP annual growth rate: +3.5% (25th smallest increase)
> 2018 GDP: $788.5 billion (6th largest)
> April 2019 unemployment: 3.8% (tied — 18th highest)
> 5 yr. annual employment growth: +0.6% (12th smallest increase)
The GDP of Pennsylvania grew at an average annual rate of 3.5% from 2013 to 2018, less than the 4.1% national growth rate. The state’s agriculture sector shrank at an average annual rate of 5.0% — similar to 5.3% rate of contraction for the sector nationwide. Employment in Pennsylvania grew at an average annual rate of 0.6% from 2013 to 2018, approximately one-third the national rate of employment growth.
While Pennsylvania lags behind the nation as a whole in GDP and employment growth, the Keystone State ranks near the middle of all states in several other measures of economic health. Some 3.8% of the Pennsylvania labor force is out of work and looking for a job — compared to the 3.6% national unemployment rate — and 31.4% of adults have a bachelor’s degree, slightly below the 32.0% national college attainment rate.
[in-text-ad]

37. Illinois
> 5 yr. GDP annual growth rate: +3.2% (20th smallest increase)
> 2018 GDP: $864.6 billion (5th largest)
> April 2019 unemployment: 4.4% (8th highest)
> 5 yr. annual employment growth: +0.8% (15th smallest increase)
Largely due to outbound migration, the population of Illinois declined by 0.7% from 2010 to 2018, the second largest contraction of any state. Some 4.4% of the Illinois labor force is out of work, the eighth highest unemployment rate nationwide. From 2013 to 2018, the GDP of Illinois grew at an average annual rate of 3.2% — far slower than the 4.1% national growth rate.
Illinois ranks above the majority of states in several economic measures related to general prosperity and availability of talented labor. The typical Illinois household outearns the typical U.S. household by roughly $3,000 a year, and 12.6% of residents live below the poverty line — below the 13.4% national poverty rate. Some 34.4% of adults in Illinois have a bachelor’s degree, more than the 32.0% national college attainment rate.
[recirclink id=552427]
38. Missouri
> 5 yr. GDP annual growth rate: +2.7% (14th smallest increase)
> 2018 GDP: $317.7 billion (22nd largest)
> April 2019 unemployment: 3.3% (tied — 18th lowest)
> 5 yr. annual employment growth: +1.0% (22nd smallest increase)
From 2013 to 2018, the GDP of Missouri grew at an average annual rate of 2.7%, trailing behind the 4.1% national growth rate.
In other measures of economic health, Missouri ranks toward the middle of all states. Some 3.3% of the Missouri workforce is out of work, compared to the 3.6% national unemployment rate, and 13.4% of residents live below the poverty line, equivalent to the national poverty rate. In educational attainment, however, Missouri ranks closer to the bottom of all states. Just 29.1% of state adults have a bachelor’s degree, less than the 32.0% national college attainment rate.

39. North Dakota
> 5 yr. GDP annual growth rate: +0.3% (3rd smallest increase)
> 2018 GDP: $54.7 billion (6th smallest)
> April 2019 unemployment: 2.3% (2nd lowest)
> 5 yr. annual employment growth: 0.0% (4th largest decrease)
While North Dakota led the nation in GDP growth from 2010 to 2012, the sharp decline in oil prices in 2014 reversed the state’s economic fortunes and resulted in negative GDP growth in 2015 and 2016. The swings amounted to an annual GDP growth of 0.3% from 2013 to 2018, the third smallest growth of any state and far behind the 4.1% national average for the period.
Unemployment and poverty in North Dakota, however, remain among the nation’s best. Just 2.3% of the North Dakota labor force is unemployed, the second lowest unemployment rate of any state. Similarly, 10.3% of North Dakota residents live in poverty, the ninth lowest poverty rate and far below the 13.4% national figure.
[in-text-ad-2]
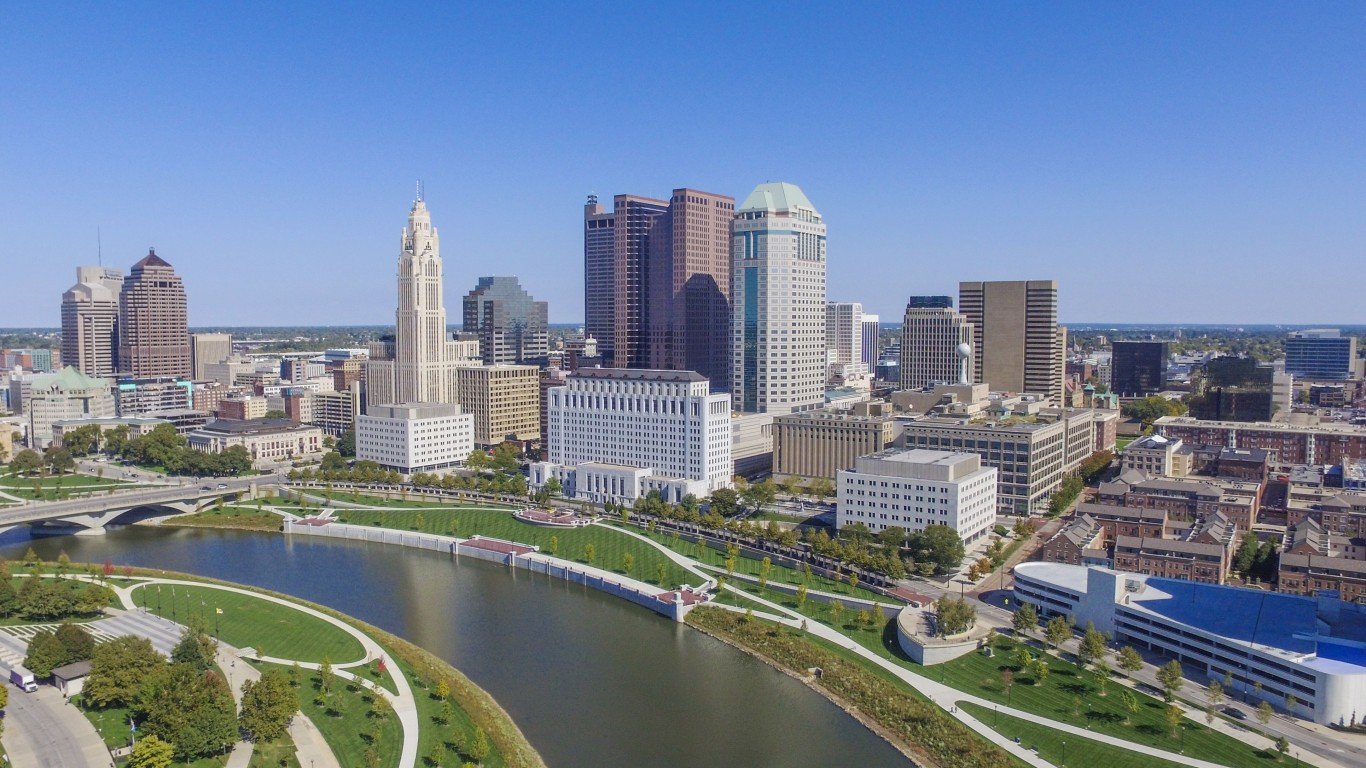
40. Ohio
> 5 yr. GDP annual growth rate: +3.8% (21st largest increase)
> 2018 GDP: $676.2 billion (7th largest)
> April 2019 unemployment: 4.3% (tied — 9th highest)
> 5 yr. annual employment growth: +0.7% (14th smallest increase)
Ohio is one of many manufacturing-dependent Rust Belt states to rank among the worst economies in the United States. Due to both negative net migration and lackluster natural growth, the population of Ohio grew by just 1.3% from 2010 to 2018, roughly one-fifth the national population growth rate. Some 4.3% of the Ohio labor force is out of work, the ninth largest unemployment rate of any state. From 2013 to 2018, employment in Ohio grew at an average annual rate of just 0.7%, less than half the 1.5% national figure.
A relative lack of qualified workers may also be hindering economic growth in Ohio. Just 28.0% of adults have a bachelor’s degree, far less than the 32.0% national college attainment rate.
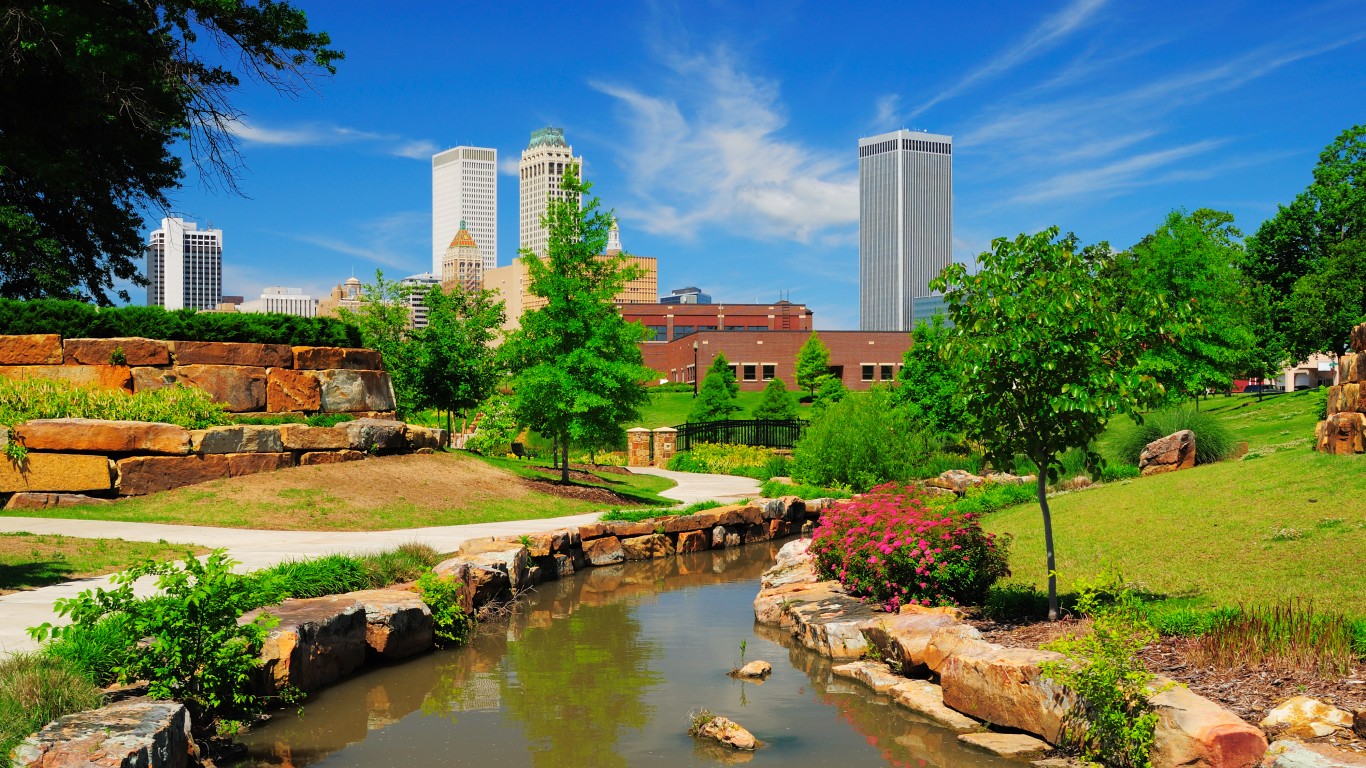
41. Oklahoma
> 5 yr. GDP annual growth rate: +1.8% (5th smallest increase)
> 2018 GDP: $200.0 billion (22nd smallest)
> April 2019 unemployment: 3.3% (tied — 18th lowest)
> 5 yr. annual employment growth: +0.8% (17th smallest increase)
Oklahoma’s GDP rose at an average annualized rate of 1.8% from 2013 to 2018, the fifth slowest pace of any state and less than half the 4.1% national figure. Due in part to the sharp drop in oil prices in 2014, the mining sector contracted by roughly $2.4 billion in economic output over the five-year period, falling from accounting for 16.4% of Oklahoma’s GDP in 2013 to 13.7% in 2018.
Other factors inhibiting Oklahoma’s economic growth are the state’s low educational attainment and high poverty rate. Just 25.5% of adults in Oklahoma have a bachelor’s degree, the eighth smallest share of any state and far below the 32.0% national college attainment rate. The median household income in Oklahoma is roughly $10,000 less than the national figure, and 15.8% of state residents live below the poverty line, the eighth highest poverty rate nationwide.
[in-text-ad]

42. Alabama
> 5 yr. GDP annual growth rate: +2.9% (17th smallest increase)
> 2018 GDP: $221.1 billion (24th smallest)
> April 2019 unemployment: 3.8% (tied — 18th highest)
> 5 yr. annual employment growth: +0.9% (21st smallest increase)
While 32.0% of Americans 25 and older have a bachelor’s degree, in Alabama just 25.5% of adults do — the eighth lowest college attainment rate of any state. Just 86.5% of adults have a high school diploma, the seventh lowest high school attainment rate. Low educational attainment can limit the number of high-paying firms attracted to a given geography and increases the likelihood of poverty for individuals and populations overall. In Alabama, the typical household earns just $48,123 a year, about $12,000 less than the U.S. median. Some 16.4% of residents live in poverty, the seventh highest poverty rate of any state.
[recirclink id=552140]
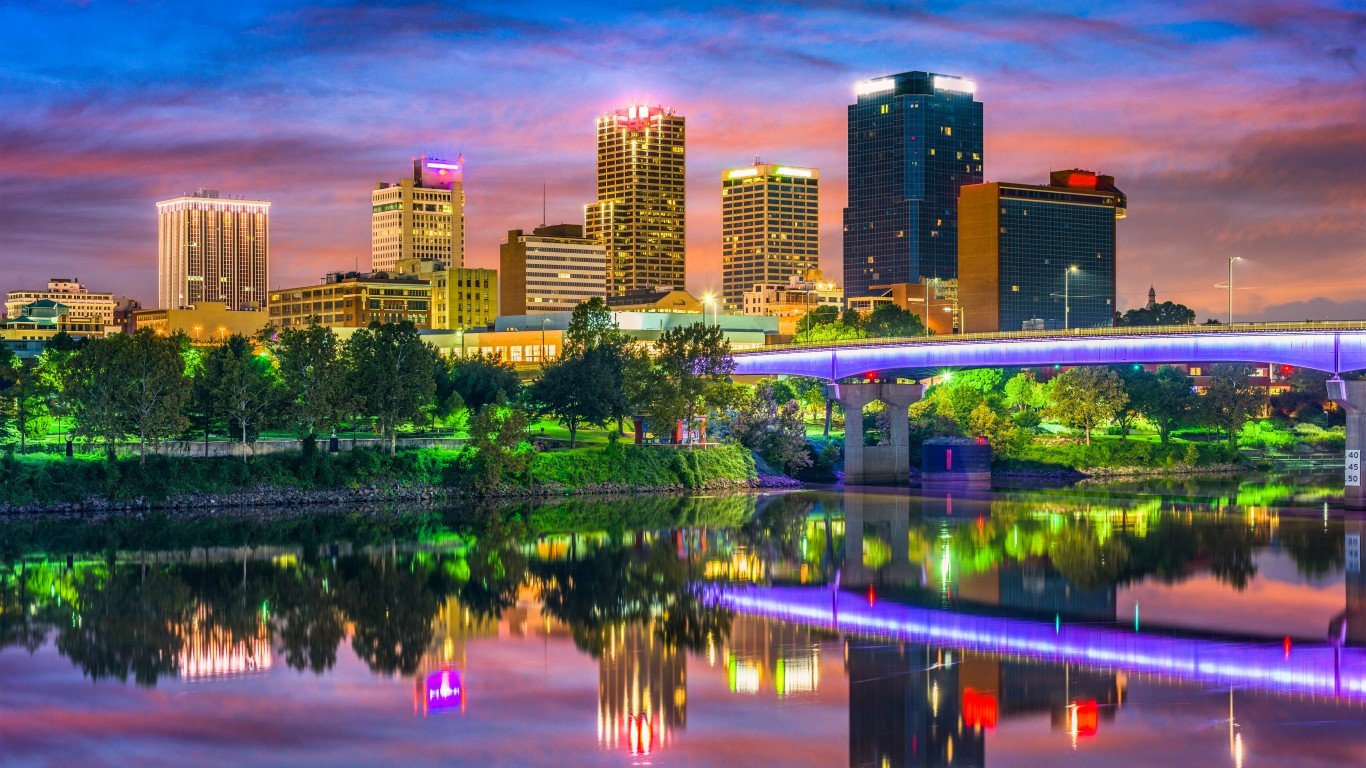
43. Arkansas
> 5 yr. GDP annual growth rate: +2.3% (8th smallest increase)
> 2018 GDP: $128.1 billion (17th smallest)
> April 2019 unemployment: 3.6% (tied — 25th highest)
> 5 yr. annual employment growth: +1.2% (21st largest increase)
Just 23.4% of adults in Arkansas have a bachelor’s degree, the third lowest college attainment rate of any state. Individuals with lower educational attainment are less likely to have secure, high-paying jobs, and areas with lower college attainment tend to be poorer than in more-educated geographies. In Arkansas, the typical household earns $45,869 a year, over $14,000 less than the national median. Some 16.4% of residents live in poverty, far above the 13.4% national poverty rate and the seventh highest poverty rate of any state.
Poverty and a lack of talented labor may be limiting economic growth in Arkansas. GDP grew at an average annual rate of 2.3% from 2013 to 2018, the eighth slowest pace of any state and far less than the 4.1% national figure.
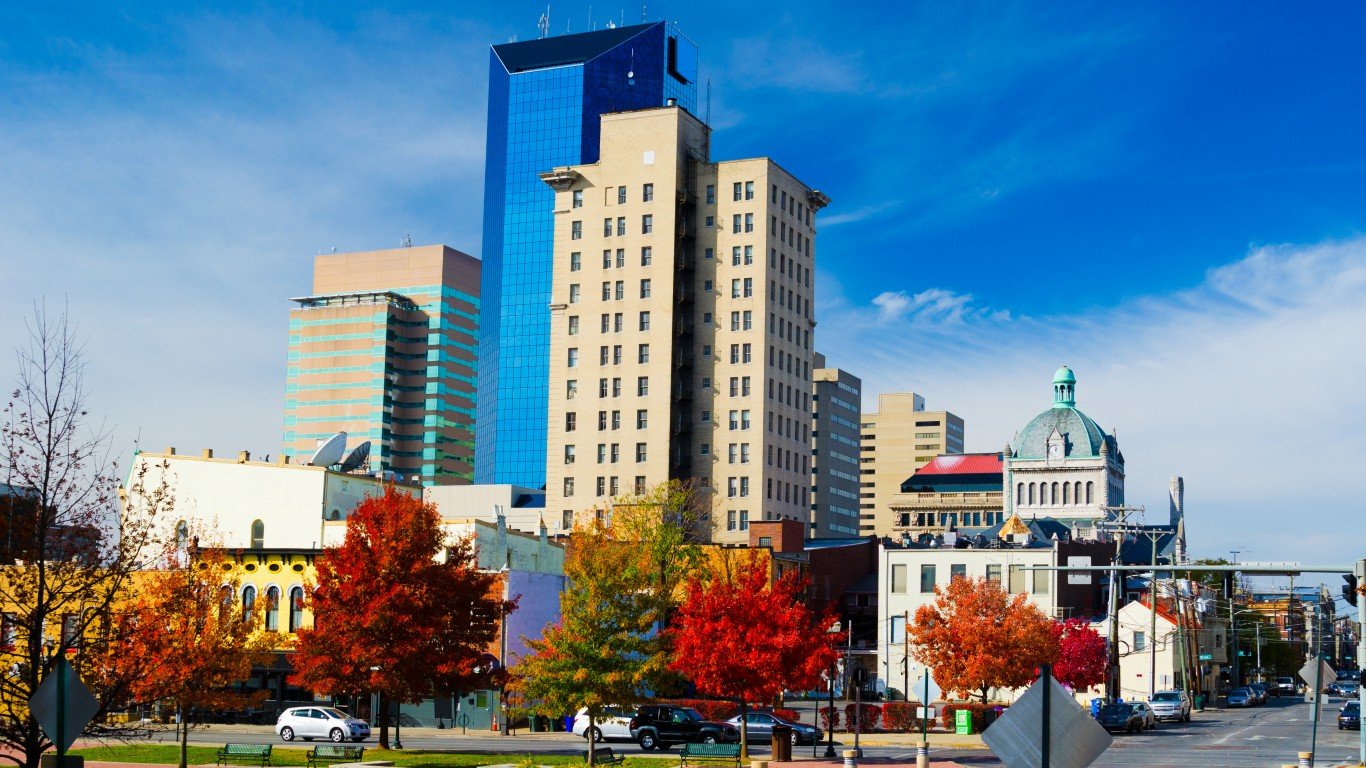
44. Kentucky
> 5 yr. GDP annual growth rate: +2.7% (12th smallest increase)
> 2018 GDP: $208.3 billion (23rd smallest)
> April 2019 unemployment: 4.0% (tied — 13th highest)
> 5 yr. annual employment growth: +0.8% (18th smallest increase)
While 32.0% of Americans 25 and over have at least a bachelor’s degree, in Kentucky 24.0% of Americans have a four-year college diploma, the fifth smallest share of any state. Individuals with lower educational attainment are less likely to have secure, high-paying jobs, and vice versa. The typical Kentucky household earns approximately $12,000 less than the typical U.S. household annually, and 17.2% of state residents currently live in poverty — far more than the 13.4% national poverty rate.
Poverty and low educational attainment can discourage prospective businesses from moving to a given area and limit economic growth overall. While the U.S. GDP grew at an annualized rate of 4.1% from 2013 to 2018, Kentucky’s grew at an average rate of 2.7%, the 12th slowest pace of any state.
[in-text-ad-2]
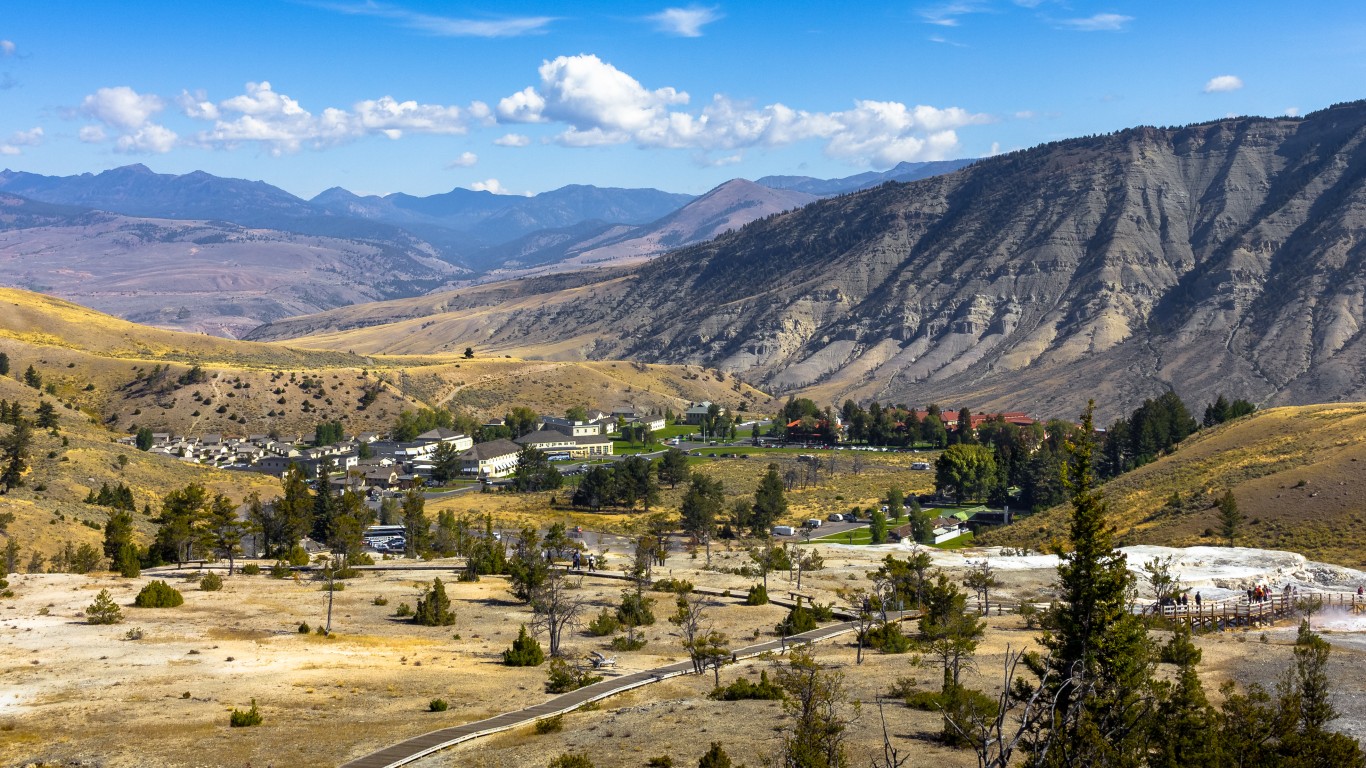
45. Wyoming
> 5 yr. GDP annual growth rate: +0.2% (2nd smallest increase)
> 2018 GDP: $39.4 billion (2nd smallest)
> April 2019 unemployment: 3.6% (tied — 25th highest)
> 5 yr. annual employment growth: -1.0% (the largest decrease)
Wyoming is one of a number of mining-heavy states to rank among the worst economies in the United States. In 2013, the mining sector accounted for 26.2% of the state’s GDP, the second largest share in the country. As the price of oil fell by more than 40% over the past five years, the economic value of the state’s mining sector declined by approximately $2.3 billion, falling to account for 20.1% of Wyoming’s GDP by 2018. Over the same period, the GDP across all sectors in Wyoming grew at an average annual rate of 0.2%, the second smallest increase of any state.

46. New Mexico
> 5 yr. GDP annual growth rate: +2.4% (10th smallest increase)
> 2018 GDP: $99.4 billion (14th smallest)
> April 2019 unemployment: 5.0% (2nd highest)
> 5 yr. annual employment growth: +0.8% (16th smallest increase)
From 2010 to 2018, the population of New Mexico declined by 1.7% due to net migration, the fifth largest contraction of any state. One push factor may be the state’s tough job market. As of April 2019, 5.0% of the New Mexico labor force was out of work, the second highest unemployment rate of any state.
Population loss is one common indicator of a weak regional economy, and from 2013 to 2018, the GDP of New Mexico grew at an average annual rate of just 2.4% — the 10th smallest increase of any state. Like the nation as a whole, the state mining sector was the largest drag on GDP growth.
[in-text-ad]

47. Louisiana
> 5 yr. GDP annual growth rate: +1.9% (6th smallest increase)
> 2018 GDP: $252.1 billion (24th largest)
> April 2019 unemployment: 4.5% (7th highest)
> 5 yr. annual employment growth: +0.4% (9th smallest increase)
The GDP of Louisiana grew at an average annual rate of 1.9% from 2013 to 2018, the sixth smallest increase of any state and less than half the 4.1% national figure. Like the nation as a whole, the largest drag on economic growth was the state’s mining sector. As the price of oil fell by more than 40% over the past five years, the economic value of the state’s mining sector declined by approximately $6.0 billion, falling from accounting for 7.4% of Louisiana’s GDP in 2013 to 4.4% in 2018.
Low educational attainment may hinder the development of high-growth sectors like information and professional business services in Louisiana and stymie overall GDP growth throughout the state. Just 23.8% of Louisiana adults have a bachelor’s degree, the fourth smallest share of any state. Additionally, some 4.5% of the workforce is unemployed, the seventh highest unemployment rate of any state.
[recirclink id=522699]
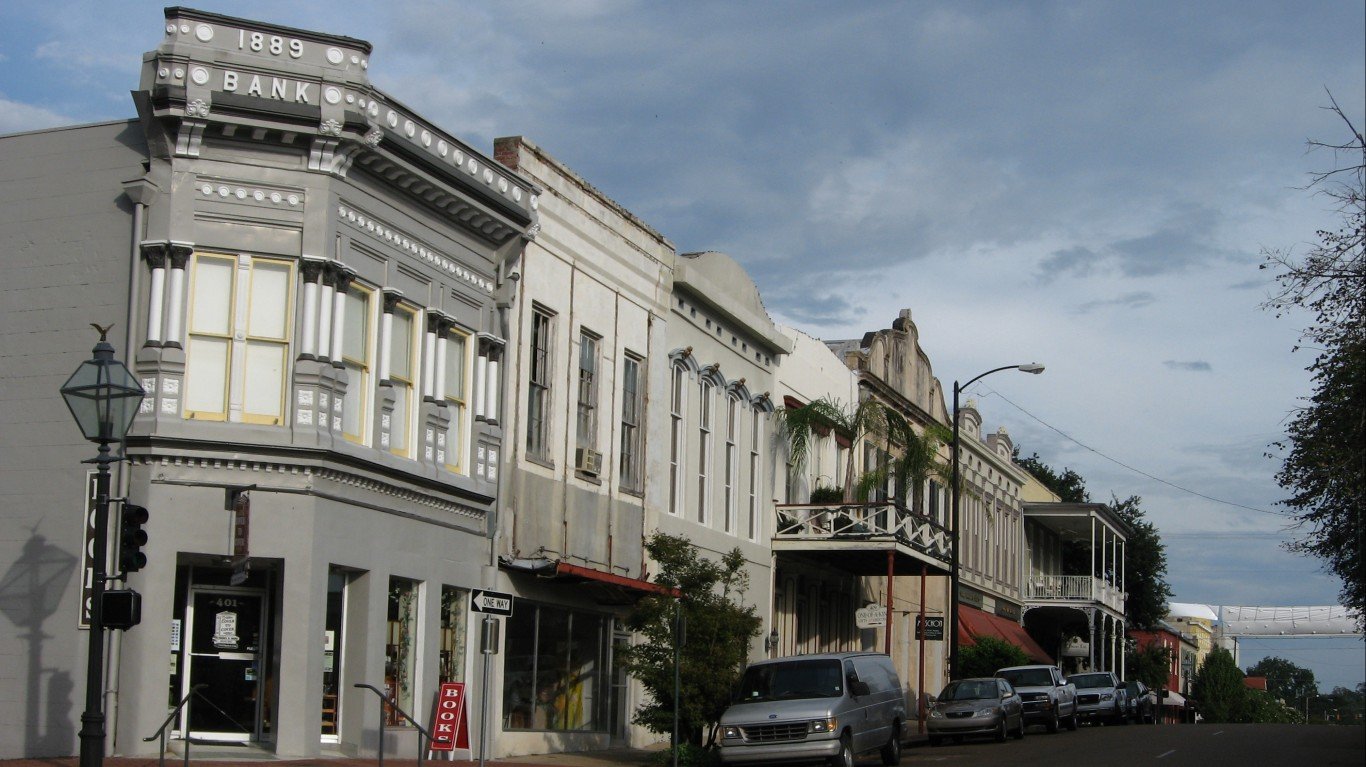
48. Mississippi
> 5 yr. GDP annual growth rate: +2.3% (9th smallest increase)
> 2018 GDP: $114.1 billion (15th smallest)
> April 2019 unemployment: 4.9% (tied — 3rd highest)
> 5 yr. annual employment growth: +0.9% (19th smallest increase)
While 32.0% of Americans 25 and over have a bachelor’s degree, just 21.9% of adults in Mississippi do, the second smallest share of any state. Individuals with lower educational attainment are less likely to hold secure, high-paying jobs, and areas with lower college attainment are more likely to be low-income overall. The typical Mississippi household earns approximately $17,000 less a year than the U.S. median, and 19.8% of state residents live in poverty — the highest poverty rate in the country.
Poverty and the gap in skills between the Mississippi workforce and the U.S. workforce are likely major hindrances to the state’s economic growth. The GDP of Mississippi grew at an average annual rate of just 2.3% from 2013 to 2018, the ninth smallest increase of any state. Some 4.9% of the Mississippi labor force is out of work, tied with West Virginia as the third highest unemployment rate.
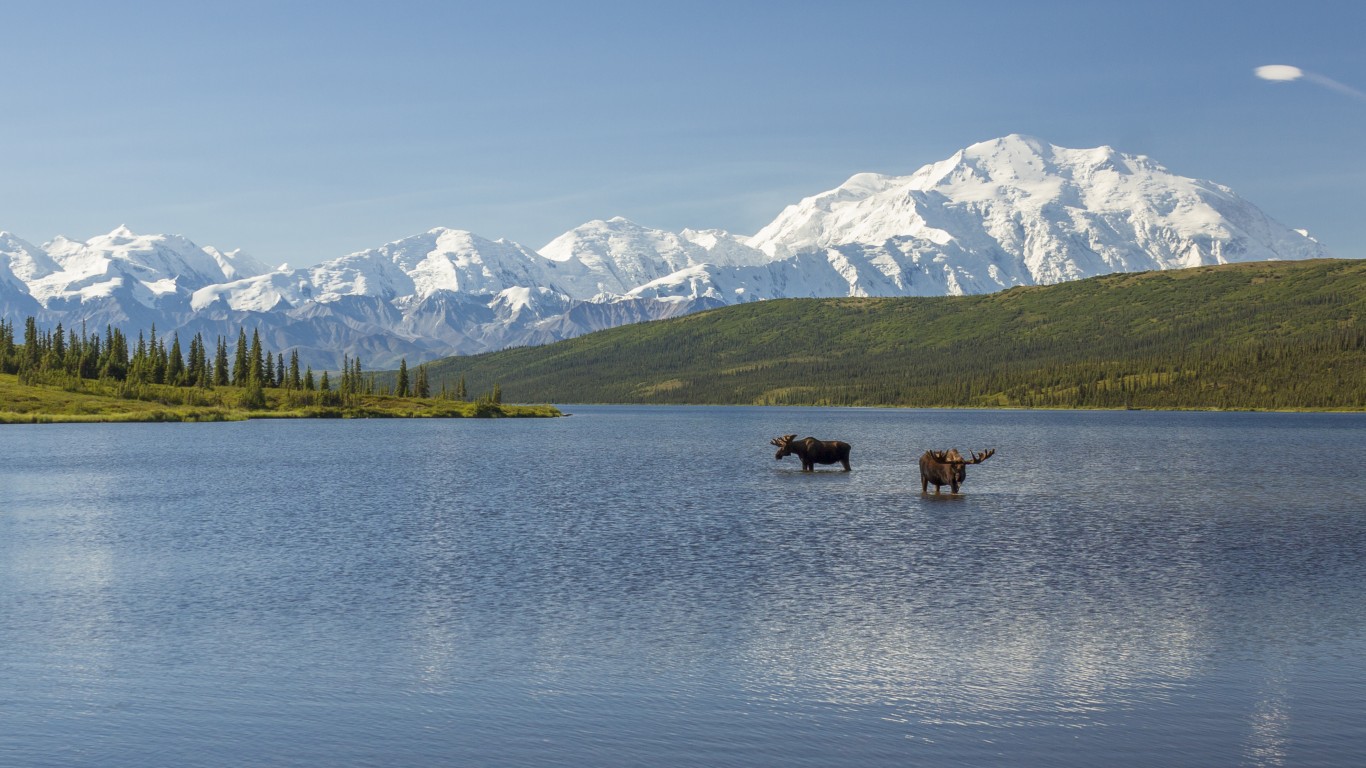
49. Alaska
> 5 yr. GDP annual growth rate: -0.9% (the largest decrease)
> 2018 GDP: $54.0 billion (5th smallest)
> April 2019 unemployment: 6.5% (the highest)
> 5 yr. annual employment growth: -0.4% (2nd largest decrease)
In recent years, the Alaskan economy has struggled, in large part due to falling oil prices. In 2013, the mining sector accounted for 28.8% of Alaskan GDP, the largest share of any state and more than 12 times the national proportion. As the price of oil fell more than 40% over the past five years, the economic value of the state’s mining sector fell by approximately $7.6 billion, falling to 16.1% of Alaska’s GDP by 2018. The overall GDP of Alaska fell at an average rate of 0.9% a year from 2013 to 2018 — the only state with negative economic growth over the period.
Alaska also has one of the highest unemployment rates in the country. While the U.S. unemployment rate has fallen steadily since the recession, from 9.9% in April 2010 to 3.6% in April 2019, Alaska’s unemployment rate fell at a much slower pace over that time, from 8.5% to 6.5% — today the highest of any state.
[in-text-ad-2]
50. West Virginia
> 5 yr. GDP annual growth rate: +1.8% (4th smallest increase)
> 2018 GDP: $77.5 billion (11th smallest)
> April 2019 unemployment: 4.9% (tied — 3rd highest)
> 5 yr. annual employment growth: -0.1% (3rd largest decrease)
Due to both natural decrease and net negative migration, the population of West Virginia fell by 2.5% over the past eight years, the largest decline of any state. Population loss is one of the main indicators of a weak regional economy, and from 2013 to 2018, the GDP of West Virginia increased by just 1.8% a year on average — less than half the 4.1% national growth rate. Like the nation as a whole, the largest drag on economic growth was the state’s mining sector, which contracted from $8.8 billion in 2013 to $8.0 billion in 2018.
While West Virginia is attempting to develop more advanced, service-oriented industries, the state’s low educational attainment and high poverty rates are a hindrance to economic growth. Just 20.2% of adults have a bachelor’s degree, the smallest share of any state. The typical West Virginia household earns roughly $17,000 less than the typical U.S. household annually, and 19.1% of the state lives below the poverty line — the fourth highest poverty rate in the country.
Methodology
To determine the states with the best and worst economies, 24/7 Wall St. ranked states based on an index comprising five measures: GDP growth, job growth, unemployment rate, poverty rate, and the bachelor’s degree attainment rate among adults. The average annual GDP growth rate from 2013 to 2018 came from the Bureau of Economic Analysis and was included in the index at full weight. The average annual employment growth rate from 2013 to 2018 came from the Bureau of Labor Statistics and was included in the index at full weight. The seasonally-adjusted unemployment rate as of April 2019 also came from the BLS and was included in the index at full weight. The share of adults living below the poverty line and the share of residents 25 and over with at least a bachelor’s degree came from the U.S. Census Bureau’s 2017 American Community Survey were both included in the index at full weight.
In addition to the components in the index, we considered additional state data. GDP and contributions to GDP growth by industry came from the BEA. Median household income, high school attainment rate, and the share of workers commuting outside of the state for work came from the 2017 ACS. The affordability ratio of median home value to median household income is a 24/7 Wall St. calculation based on ACS data. Data on regional price parity came from the BEA and is for 2017. Population change due to natural increase and net migration from 2010 to 2018 came from the U.S. Census Bureau. All data are for the most recent period available.
Contact [email protected] for any questions or corrections.