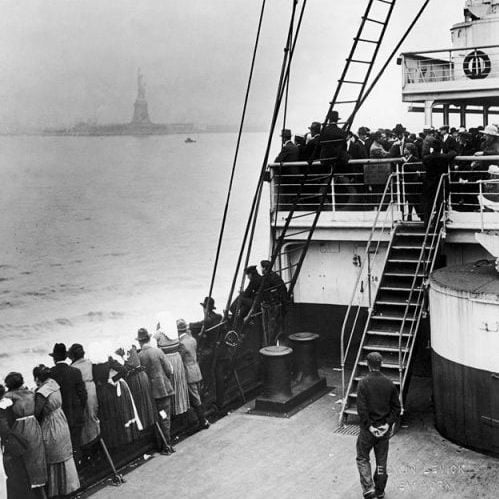
Immigration is shaping up to be one of the hot button issues in the 2020 presidential elections. Despite being described as a nation of immigrants, the United States in recent years has been divided on the subject.
There seems to have been a rise in anti-immigration sentiment over the last few years, yet 59% of Americans think immigrants make the country stronger, according to a March 2019 poll by Pew Research Center.
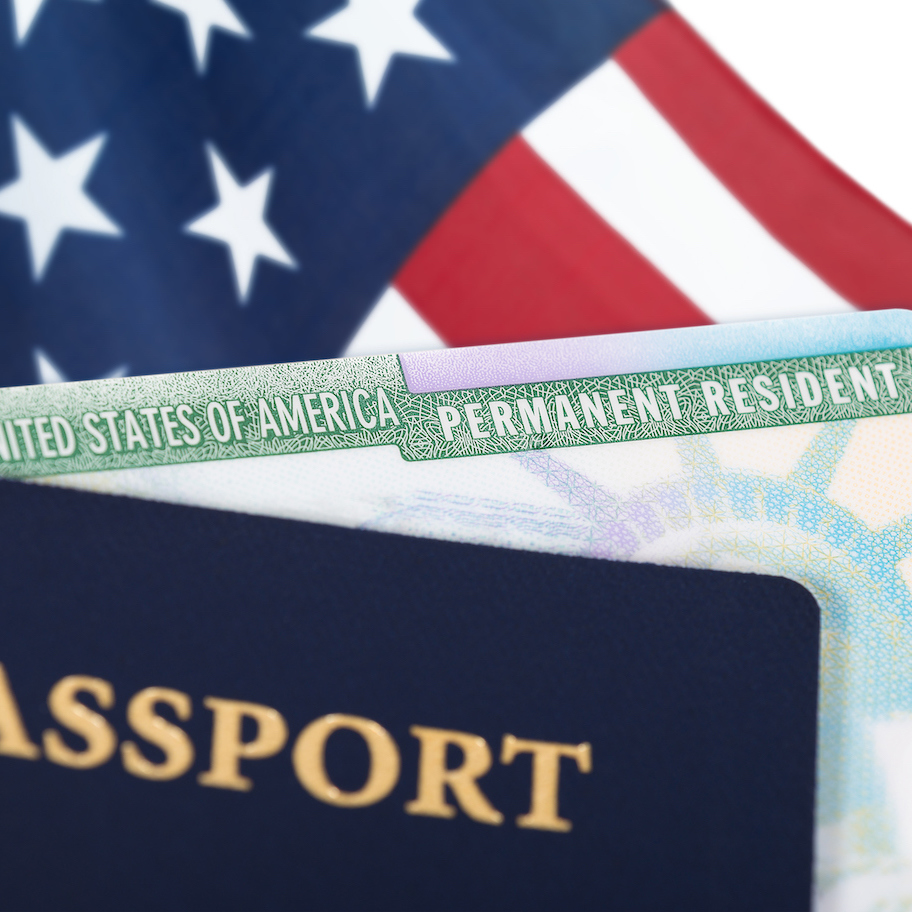
The United States remains a massive melting pot of people born in other countries, either moving permanently or for the long-term to the U.S. During the last decade alone, about 7.2 million immigrants became naturalized citizens. During the 2018 fiscal year, nearly 757,000 people received a U.S. passport, a five-year high, despite the rate of approving citizenship applications declining slightly to just below 90%.
About 73% of the new citizens in 2018 resided in 10 states — California, Florida, New York, Texas, New Jersey, Illinois, Massachusetts, Virginia, Pennsylvania, and Washington, in descending order.
About 13.4% of the country’s population, or over 43 million people, were born abroad, and many more have at least one foreign-born parent. In 13 of the 15 states with the highest share of foreign-born citizens, the percentage is higher than the national average of 13.4%. By comparison, in 16 states the share of the foreign-born population is less than 5.0%.
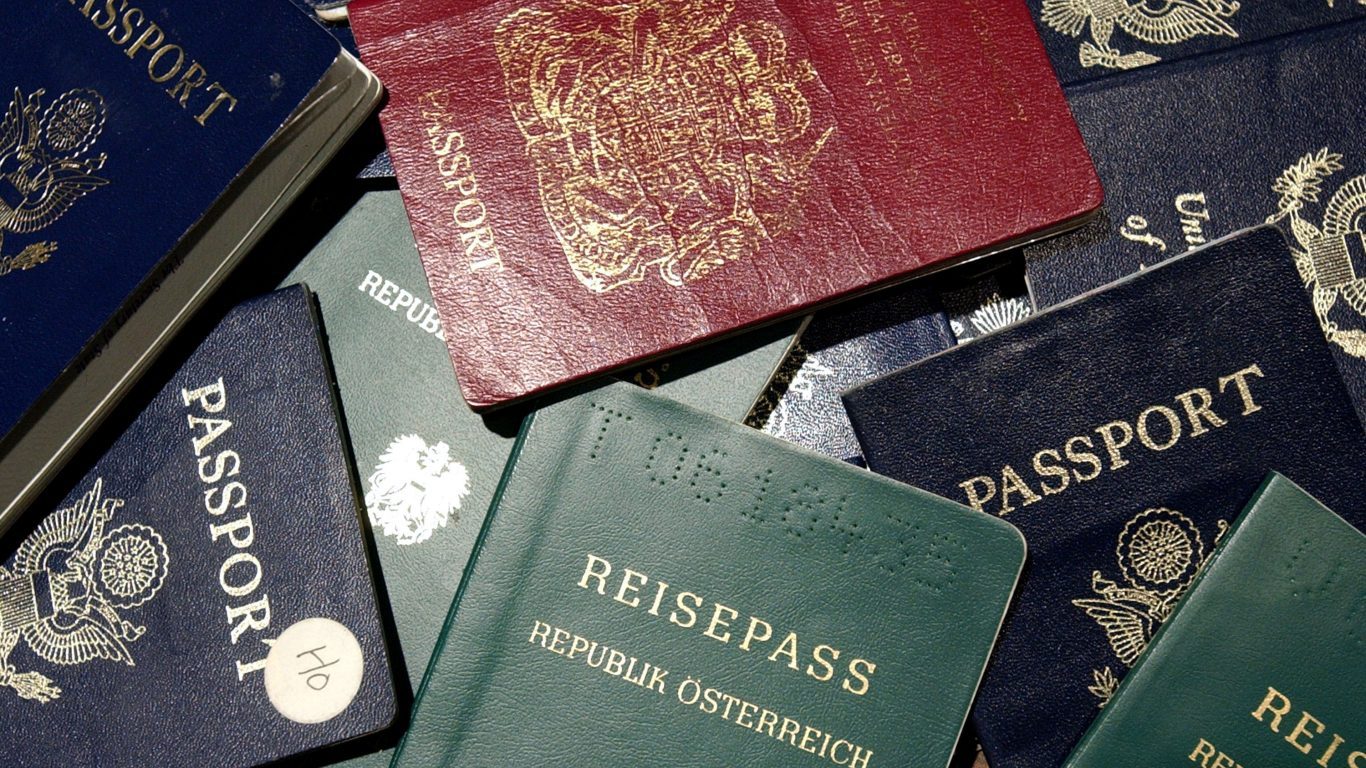
Mexican-born immigrants are the largest immigrant group by percentage in six of the 15 states with the largest immigrant populations. Immigrants born in India, China, the Philippines, and Cuba make up the next largest countries of origin of naturalized Americans, each contributing to the multitude of languages spoken by American families all across the country — this is the most commonly spoken foreign language in every state.
Click here to see the number of foreign-born citizens in every state.
To identify the number of foreign-born citizens in every state, 24/7 Tempo reviewed population breakdowns by naturalization from the U.S. Census Bureau’s 2017 American Community Survey 5-Year Estimates. The list is ranked in ascending order from the state with the least share of foreign-born citizens to the state with the largest.
Data on population change due to net international migration and the country of origin for the largest foreign-born populations within each state also came from the ACS. Data on naturalizations and green cards by origin country and fiscal year came from the Department of Homeland Security’s Yearbook of Immigration Statistics 2017.

50. West Virginia
> Share of foreign-born citizens: 1.61% (total of 29,578 people)
> Share of foreign-born non-citizens: 0.80% (total of 14,628 people)
> State’s total population: 1,836,843
> Origin of largest immigrant groups: India (9.11%), Mexico (8.79%)
> No. of naturalized citizens in 2017: 560
> No. of green cards granted in 2017: 776 (or 42 per 100,000 people)
[in-text-ad]

49. Montana
> Share of foreign-born citizens: 2.11% (total of 21,771 people)
> Share of foreign-born non-citizens: 1.01% (total of 10,396 people)
> State’s total population: 1,029,862
> Origin of largest immigrant groups: Canada (17.66%), Mexico (11.39%)
> No. of naturalized citizens in 2017: 347
> No. of green cards granted in 2017: 529 (or 51 per 100,000 people)
[recirclink id=450256]

48. Mississippi
> Share of foreign-born citizens: 2.31% (total of 68,894 people)
> Share of foreign-born non-citizens: 1.42% (total of 42,470 people)
> State’s total population: 2,986,220
> Origin of largest immigrant groups: Mexico (34.06%), Vietnam (6.63%)
> No. of naturalized citizens in 2017: 662
> No. of green cards granted in 2017: 1,793 (or 60 per 100,000 people)

47. South Dakota
> Share of foreign-born citizens: 3.32% (total of 28,358 people)
> Share of foreign-born non-citizens: 2.09% (total of 17,888 people)
> State’s total population: 855,444
> Origin of largest immigrant groups: Mexico (10.85%), Ethiopia (6.92%)
> No. of naturalized citizens in 2017: 632
> No. of green cards granted in 2017: 1,017 (or 119 per 100,000 people)
[in-text-ad-2]
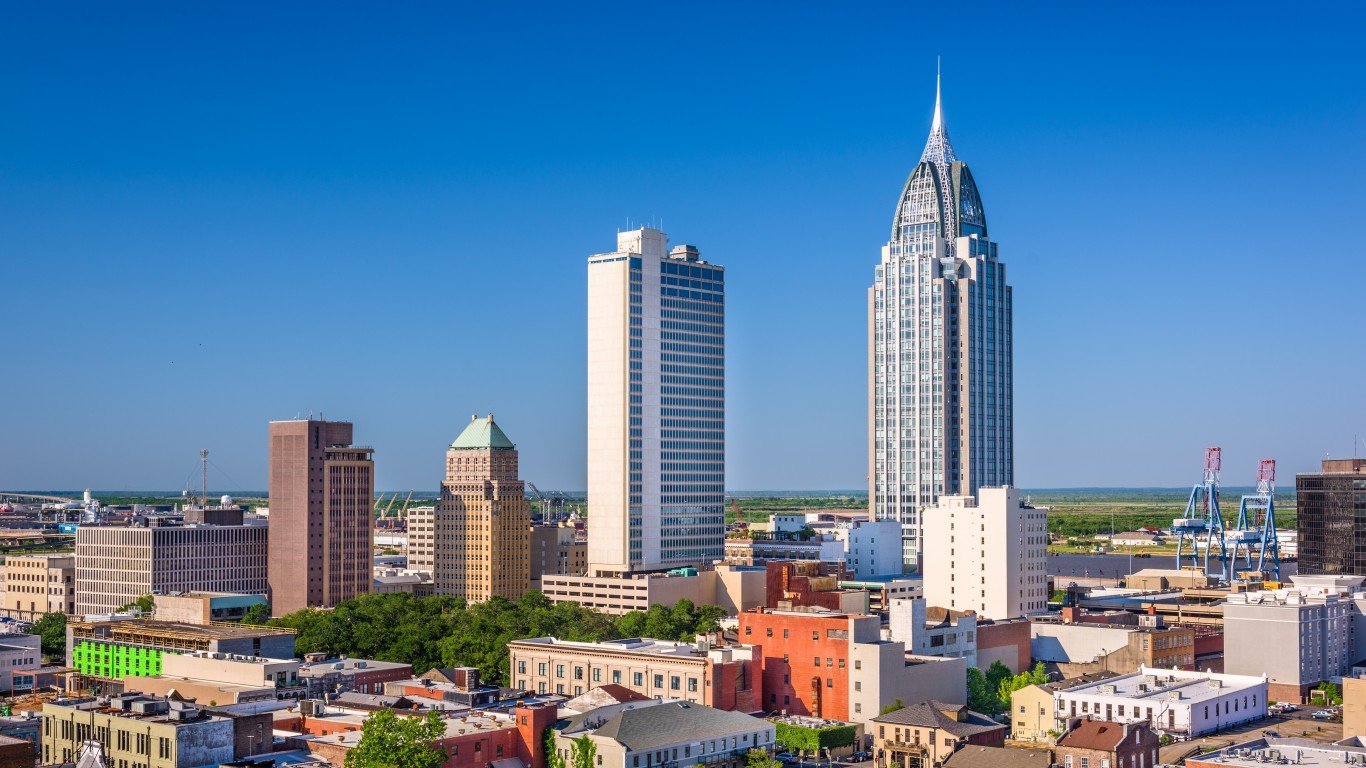
46. Alabama
> Share of foreign-born citizens: 3.46% (total of 167,926 people)
> Share of foreign-born non-citizens: 2.19% (total of 106,217 people)
> State’s total population: 4,850,771
> Origin of largest immigrant groups: Mexico (31.15%), Guatemala (6.71%)
> No. of naturalized citizens in 2017: 1,045
> No. of green cards granted in 2017: 3,801 (or 78 per 100,000 people)

45. Wyoming
> Share of foreign-born citizens: 3.55% (total of 20,719 people)
> Share of foreign-born non-citizens: 2.20% (total of 12,807 people)
> State’s total population: 583,200
> Origin of largest immigrant groups: Mexico (41.60%), Philippines (6.23%)
> No. of naturalized citizens in 2017: 247
> No. of green cards granted in 2017: 444 (or 76 per 100,000 people)
[in-text-ad]

44. Maine
> Share of foreign-born citizens: 3.58% (total of 47,556 people)
> Share of foreign-born non-citizens: 1.58% (total of 20,960 people)
> State’s total population: 1,330,158
> Origin of largest immigrant groups: Canada (21.36%), China (5.83%)
> No. of naturalized citizens in 2017: 1,039
> No. of green cards granted in 2017: 1,594 (or 120 per 100,000 people)
[recirclink id=487873]

43. North Dakota
> Share of foreign-born citizens: 3.58% (total of 26,715 people)
> Share of foreign-born non-citizens: 2.19% (total of 16,295 people)
> State’s total population: 745,475
> Origin of largest immigrant groups: Canada (10.32%), Mexico (9.37%)
> No. of naturalized citizens in 2017: 607
> No. of green cards granted in 2017: 1,471 (or 197 per 100,000 people)

42. Kentucky
> Share of foreign-born citizens: 3.63% (total of 160,702 people)
> Share of foreign-born non-citizens: 2.25% (total of 99,437 people)
> State’s total population: 4,424,376
> Origin of largest immigrant groups: Mexico (20.14%), Caribbean (7.98%)
> No. of naturalized citizens in 2017: 3,445
> No. of green cards granted in 2017: 7,537 (or 170 per 100,000 people)
[in-text-ad-2]

41. Missouri
> Share of foreign-born citizens: 4.00% (total of 242,835 people)
> Share of foreign-born non-citizens: 2.16% (total of 131,041 people)
> State’s total population: 6,075,300
> Origin of largest immigrant groups: Mexico (18.02%), India (7.81%)
> No. of naturalized citizens in 2017: 5,109
> No. of green cards granted in 2017: 7,707 (or 127 per 100,000 people)

40. Louisiana
> Share of foreign-born citizens: 4.15% (total of 193,655 people)
> Share of foreign-born non-citizens: 2.45% (total of 114,487 people)
> State’s total population: 4,663,461
> Origin of largest immigrant groups: Mexico (16.95%), Honduras (14.84%)
> No. of naturalized citizens in 2017: 2,160
> No. of green cards granted in 2017: 4,688 (or 101 per 100,000 people)
[in-text-ad]

39. Ohio
> Share of foreign-born citizens: 4.33% (total of 502,335 people)
> Share of foreign-born non-citizens: 2.14% (total of 247,920 people)
> State’s total population: 11,609,756
> Origin of largest immigrant groups: India (11.15%), Mexico (9.04%)
> No. of naturalized citizens in 2017: 12,427
> No. of green cards granted in 2017: 16,894 (or 146 per 100,000 people)
[recirclink id=559478]

38. Vermont
> Share of foreign-born citizens: 4.52% (total of 28,213 people)
> Share of foreign-born non-citizens: 2.04% (total of 12,712 people)
> State’s total population: 624,636
> Origin of largest immigrant groups: Canada (17.79%), China (6.47%)
> No. of naturalized citizens in 2017: 760
> No. of green cards granted in 2017: 787 (or 126 per 100,000 people)

37. Arkansas
> Share of foreign-born citizens: 4.74% (total of 141,079 people)
> Share of foreign-born non-citizens: 3.24% (total of 96,397 people)
> State’s total population: 2,977,944
> Origin of largest immigrant groups: Mexico (43.48%), El Salvador (8.37%)
> No. of naturalized citizens in 2017: 1,328
> No. of green cards granted in 2017: 3,071 (or 103 per 100,000 people)
[in-text-ad-2]

36. South Carolina
> Share of foreign-born citizens: 4.86% (total of 237,789 people)
> Share of foreign-born non-citizens: 2.90% (total of 141,907 people)
> State’s total population: 4,893,444
> Origin of largest immigrant groups: Mexico (29.33%), India (5.13%)
> No. of naturalized citizens in 2017: 5,033
> No. of green cards granted in 2017: 5,027 (or 103 per 100,000 people)

35. Wisconsin
> Share of foreign-born citizens: 4.88% (total of 281,391 people)
> Share of foreign-born non-citizens: 2.70% (total of 155,747 people)
> State’s total population: 5,763,217
> Origin of largest immigrant groups: Mexico (31.71%), India (7.79%)
> No. of naturalized citizens in 2017: 3,165
> No. of green cards granted in 2017: 6,681 (or 116 per 100,000 people)
[in-text-ad]

34. Tennessee
> Share of foreign-born citizens: 4.96% (total of 326,954 people)
> Share of foreign-born non-citizens: 3.12% (total of 205,694 people)
> State’s total population: 6,597,381
> Origin of largest immigrant groups: Mexico (28.55%), India (6.69%)
> No. of naturalized citizens in 2017: 3,645
> No. of green cards granted in 2017: 9,793 (or 148 per 100,000 people)
[recirclink id=377675]
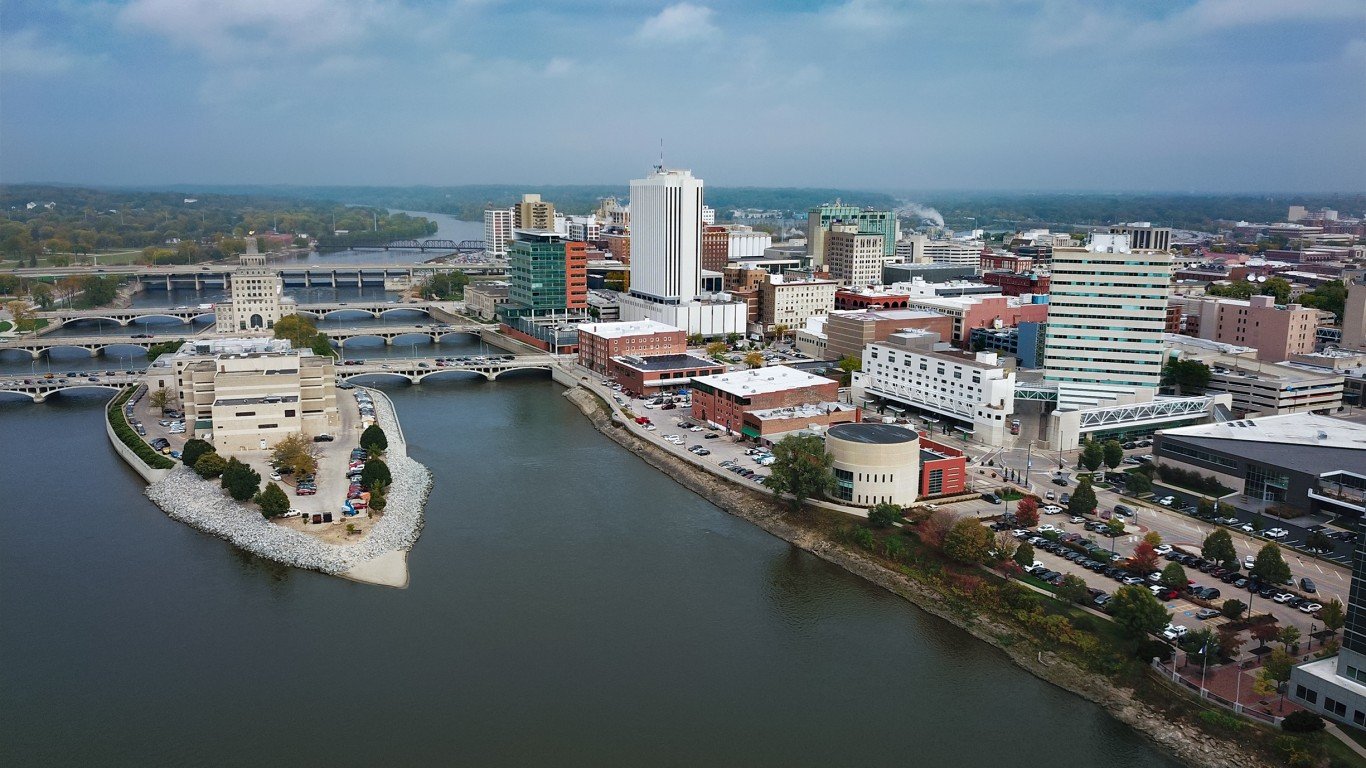
33. Iowa
> Share of foreign-born citizens: 5.02% (total of 156,479 people)
> Share of foreign-born non-citizens: 3.12% (total of 97,268 people)
> State’s total population: 3,118,102
> Origin of largest immigrant groups: Mexico (26.95%), China (6.86%)
> No. of naturalized citizens in 2017: 2,677
> No. of green cards granted in 2017: 5,577 (or 179 per 100,000 people)

32. Indiana
> Share of foreign-born citizens: 5.04% (total of 333,660 people)
> Share of foreign-born non-citizens: 3.13% (total of 206,958 people)
> State’s total population: 6,614,418
> Origin of largest immigrant groups: Mexico (31.47%), India (8.33%)
> No. of naturalized citizens in 2017: 6,420
> No. of green cards granted in 2017: 10,052 (or 152 per 100,000 people)
[in-text-ad-2]

31. Oklahoma
> Share of foreign-born citizens: 5.89% (total of 229,586 people)
> Share of foreign-born non-citizens: 3.86% (total of 150,488 people)
> State’s total population: 3,896,251
> Origin of largest immigrant groups: Mexico (47.28%), Vietnam (6.48%)
> No. of naturalized citizens in 2017: 3,769
> No. of green cards granted in 2017: 5,535 (or 142 per 100,000 people)

30. New Hampshire
> Share of foreign-born citizens: 5.92% (total of 78,869 people)
> Share of foreign-born non-citizens: 2.73% (total of 36,404 people)
> State’s total population: 1,331,848
> Origin of largest immigrant groups: Canada (11.58%), India (9.44%)
> No. of naturalized citizens in 2017: 1,897
> No. of green cards granted in 2017: 2,279 (or 171 per 100,000 people)
[in-text-ad]

29. Idaho
> Share of foreign-born citizens: 5.94% (total of 98,457 people)
> Share of foreign-born non-citizens: 3.66% (total of 60,680 people)
> State’s total population: 1,657,375
> Origin of largest immigrant groups: Mexico (51.65%), Canada (5.11%)
> No. of naturalized citizens in 2017: 1,994
> No. of green cards granted in 2017: 2,709 (or 163 per 100,000 people)
[recirclink id=564685]

28. Pennsylvania
> Share of foreign-born citizens: 6.58% (total of 841,731 people)
> Share of foreign-born non-citizens: 3.15% (total of 403,153 people)
> State’s total population: 12,790,505
> Origin of largest immigrant groups: Caribbean (13.14%), India (9.83%)
> No. of naturalized citizens in 2017: 14,898
> No. of green cards granted in 2017: 27,762 (or 217 per 100,000 people)

27. Michigan
> Share of foreign-born citizens: 6.58% (total of 653,196 people)
> Share of foreign-born non-citizens: 3.19% (total of 316,459 people)
> State’s total population: 9,925,568
> Origin of largest immigrant groups: Mexico (12.21%), India (10.27%)
> No. of naturalized citizens in 2017: 12,725
> No. of green cards granted in 2017: 18,927 (or 191 per 100,000 people)
[in-text-ad-2]

26. Nebraska
> Share of foreign-born citizens: 6.90% (total of 130,660 people)
> Share of foreign-born non-citizens: 4.38% (total of 82,920 people)
> State’s total population: 1,893,921
> Origin of largest immigrant groups: Mexico (37.49%), Guatemala (6.26%)
> No. of naturalized citizens in 2017: 2,422
> No. of green cards granted in 2017: 5,327 (or 281 per 100,000 people)

25. Kansas
> Share of foreign-born citizens: 7.02% (total of 203,780 people)
> Share of foreign-born non-citizens: 4.40% (total of 127,777 people)
> State’s total population: 2,903,820
> Origin of largest immigrant groups: Mexico (42.28%), India (5.93%)
> No. of naturalized citizens in 2017: 3,152
> No. of green cards granted in 2017: 5,703 (or 196 per 100,000 people)
[in-text-ad]

24. Alaska
> Share of foreign-born citizens: 7.59% (total of 56,043 people)
> Share of foreign-born non-citizens: 3.28% (total of 24,207 people)
> State’s total population: 738,565
> Origin of largest immigrant groups: Philippines (31.36%), Mexico (6.85%)
> No. of naturalized citizens in 2017: 1,011
> No. of green cards granted in 2017: 1,547 (or 209 per 100,000 people)
[recirclink id=554425]
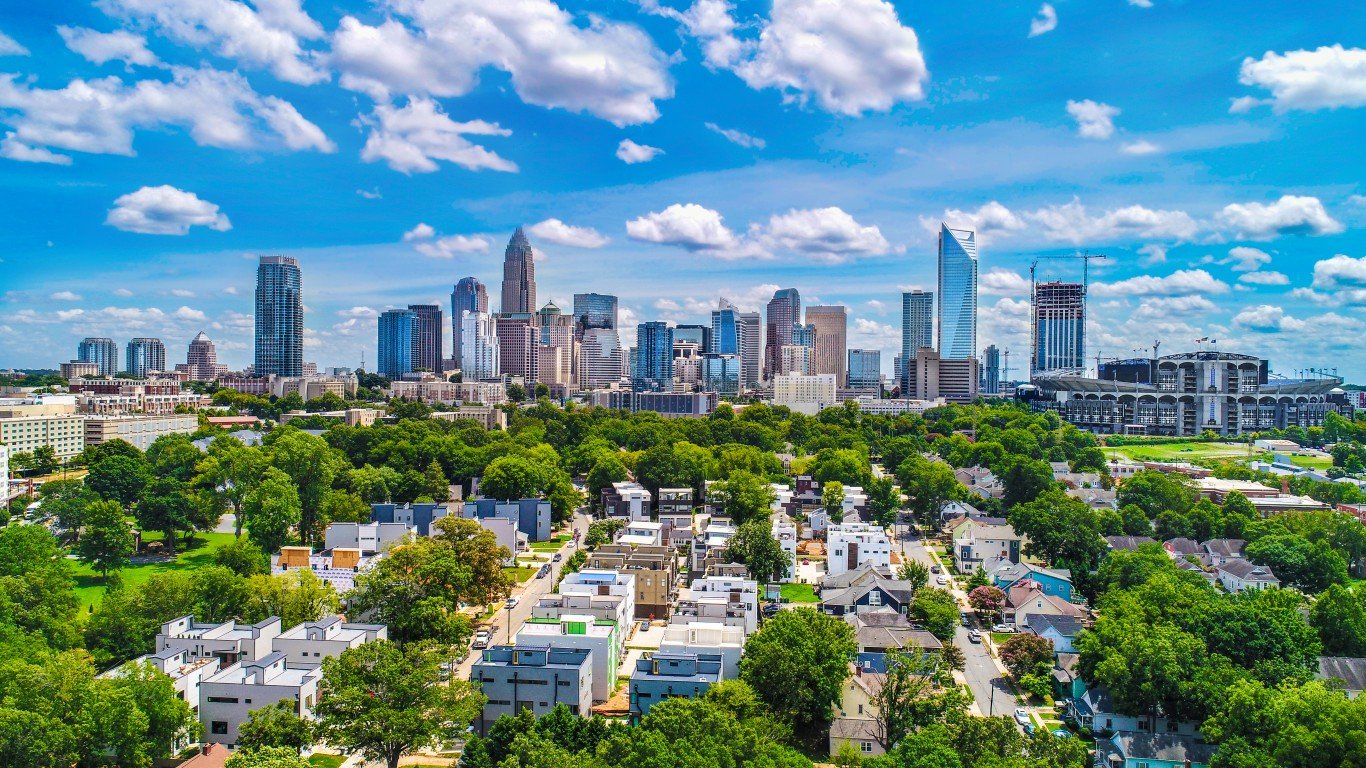
23. North Carolina
> Share of foreign-born citizens: 7.84% (total of 787,971 people)
> Share of foreign-born non-citizens: 4.96% (total of 498,309 people)
> State’s total population: 10,052,564
> Origin of largest immigrant groups: Mexico (30.58%), India (7.63%)
> No. of naturalized citizens in 2017: 13,890
> No. of green cards granted in 2017: 21,184 (or 211 per 100,000 people)

22. Minnesota
> Share of foreign-born citizens: 8.17% (total of 448,397 people)
> Share of foreign-born non-citizens: 4.06% (total of 222,887 people)
> State’s total population: 5,490,726
> Origin of largest immigrant groups: Mexico (14.66%), Somalia (6.85%)
> No. of naturalized citizens in 2017: 7,834
> No. of green cards granted in 2017: 16,009 (or 292 per 100,000 people)
[in-text-ad-2]

21. Utah
> Share of foreign-born citizens: 8.29% (total of 248,158 people)
> Share of foreign-born non-citizens: 5.14% (total of 153,811 people)
> State’s total population: 2,993,941
> Origin of largest immigrant groups: Mexico (41.13%), China (3.79%)
> No. of naturalized citizens in 2017: 3,141
> No. of green cards granted in 2017: 6,390 (or 213 per 100,000 people)

20. Delaware
> Share of foreign-born citizens: 9.12% (total of 86,028 people)
> Share of foreign-born non-citizens: 4.84% (total of 45,639 people)
> State’s total population: 943,732
> Origin of largest immigrant groups: Mexico (18.14%), India (12.86%)
> No. of naturalized citizens in 2017: 1,453
> No. of green cards granted in 2017: 2,244 (or 238 per 100,000 people)
[in-text-ad]

19. New Mexico
> Share of foreign-born citizens: 9.66% (total of 201,298 people)
> Share of foreign-born non-citizens: 6.06% (total of 126,377 people)
> State’s total population: 2,084,828
> Origin of largest immigrant groups: Mexico (70.41%), Germany (2.47%)
> No. of naturalized citizens in 2017: 3,312
> No. of green cards granted in 2017: 4,002 (or 192 per 100,000 people)
[recirclink id=496212]

18. Colorado
> Share of foreign-born citizens: 9.81% (total of 533,576 people)
> Share of foreign-born non-citizens: 5.89% (total of 320,192 people)
> State’s total population: 5,436,519
> Origin of largest immigrant groups: Mexico (43.17%), China (4.00%)
> No. of naturalized citizens in 2017: 6,104
> No. of green cards granted in 2017: 14,520 (or 267 per 100,000 people)

17. Oregon
> Share of foreign-born citizens: 9.90% (total of 398,401 people)
> Share of foreign-born non-citizens: 5.71% (total of 229,637 people)
> State’s total population: 4,025,127
> Origin of largest immigrant groups: Mexico (37.68%), China (6.42%)
> No. of naturalized citizens in 2017: 6,382
> No. of green cards granted in 2017: 9,221 (or 229 per 100,000 people)
[in-text-ad-2]

16. Georgia
> Share of foreign-born citizens: 10.03% (total of 1,023,235 people)
> Share of foreign-born non-citizens: 5.85% (total of 596,894 people)
> State’s total population: 10,201,635
> Origin of largest immigrant groups: Mexico (25.66%), Caribbean (9.33%)
> No. of naturalized citizens in 2017: 16,461
> No. of green cards granted in 2017: 26,242 (or 257 per 100,000 people)

15. Virginia
> Share of foreign-born citizens: 12.13% (total of 1,014,966 people)
> Share of foreign-born non-citizens: 5.94% (total of 496,678 people)
> State’s total population: 8,365,952
> Origin of largest immigrant groups: El Salvador (10.06%), India (8.02%)
> No. of naturalized citizens in 2017: 21,930
> No. of green cards granted in 2017: 29,466 (or 352 per 100,000 people)
[in-text-ad]

14. Arizona
> Share of foreign-born citizens: 13.39% (total of 911,810 people)
> Share of foreign-born non-citizens: 7.88% (total of 536,708 people)
> State’s total population: 6,809,946
> Origin of largest immigrant groups: Mexico (55.99%), Canada (4.74%)
> No. of naturalized citizens in 2017: 12,462
> No. of green cards granted in 2017: 19,344 (or 284 per 100,000 people)
[recirclink id=534370]

13. Rhode Island
> Share of foreign-born citizens: 13.65% (total of 144,210 people)
> Share of foreign-born non-citizens: 6.38% (total of 67,344 people)
> State’s total population: 1,056,138
> Origin of largest immigrant groups: Caribbean (21.43%), Dominican Republic (17.55%)
> No. of naturalized citizens in 2017: 3,415
> No. of green cards granted in 2017: 4,102 (or 388 per 100,000 people)

12. Washington
> Share of foreign-born citizens: 13.76% (total of 986,515 people)
> Share of foreign-born non-citizens: 7.28% (total of 521,887 people)
> State’s total population: 7,169,967
> Origin of largest immigrant groups: Mexico (24.06%), China (8.31%)
> No. of naturalized citizens in 2017: 16,030
> No. of green cards granted in 2017: 27,363 (or 382 per 100,000 people)
[in-text-ad-2]

11. Illinois
> Share of foreign-born citizens: 14.01% (total of 1,800,858 people)
> Share of foreign-born non-citizens: 7.11% (total of 913,882 people)
> State’s total population: 12,854,526
> Origin of largest immigrant groups: Mexico (37.02%), India (8.47%)
> No. of naturalized citizens in 2017: 24,933
> No. of green cards granted in 2017: 40,530 (or 315 per 100,000 people)

10. Connecticut
> Share of foreign-born citizens: 14.24% (total of 511,893 people)
> Share of foreign-born non-citizens: 7.08% (total of 254,388 people)
> State’s total population: 3,594,478
> Origin of largest immigrant groups: Caribbean (16.30%), India (7.53%)
> No. of naturalized citizens in 2017: 7,441
> No. of green cards granted in 2017: 11,938 (or 332 per 100,000 people)
[in-text-ad]
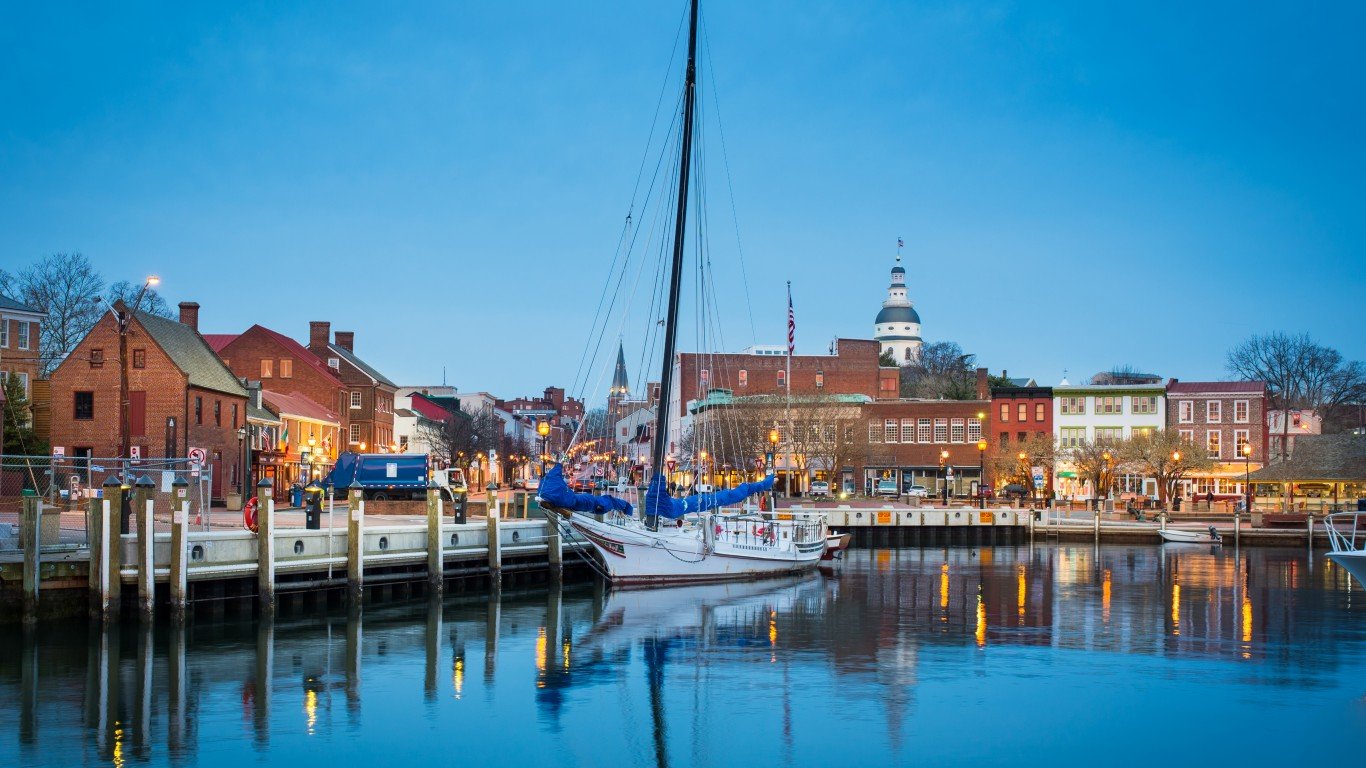
9. Maryland
> Share of foreign-born citizens: 14.92% (total of 894,713 people)
> Share of foreign-born non-citizens: 7.40% (total of 443,489 people)
> State’s total population: 5,996,079
> Origin of largest immigrant groups: El Salvador (11.92%), Caribbean (7.89%)
> No. of naturalized citizens in 2017: 17,729
> No. of green cards granted in 2017: 25,095 (or 419 per 100,000 people)
[recirclink id=561167]

8. Massachusetts
> Share of foreign-born citizens: 16.16% (total of 1,097,229 people)
> Share of foreign-born non-citizens: 7.65% (total of 519,292 people)
> State’s total population: 6,789,319
> Origin of largest immigrant groups: Caribbean (16.11%), China (9.55%)
> No. of naturalized citizens in 2017: 27,739
> No. of green cards granted in 2017: 37,010 (or 545 per 100,000 people)

7. Texas
> Share of foreign-born citizens: 16.86% (total of 4,622,395 people)
> Share of foreign-born non-citizens: 10.78% (total of 2,955,178 people)
> State’s total population: 27,419,612
> Origin of largest immigrant groups: Mexico (54.97%), India (5.04%)
> No. of naturalized citizens in 2017: 50,552
> No. of green cards granted in 2017: 11,0126 (or 402 per 100,000 people)
[in-text-ad-2]

6. Hawaii
> Share of foreign-born citizens: 18.06% (total of 256,711 people)
> Share of foreign-born non-citizens: 7.60% (total of 108,079 people)
> State’s total population: 1,421,658
> Origin of largest immigrant groups: Philippines (45.95%), China (9.97%)
> No. of naturalized citizens in 2017: 3,491
> No. of green cards granted in 2017: 5,396 (or 380 per 100,000 people)

5. Nevada
> Share of foreign-born citizens: 19.45% (total of 561,744 people)
> Share of foreign-born non-citizens: 10.16% (total of 293,386 people)
> State’s total population: 2,887,725
> Origin of largest immigrant groups: Mexico (40.34%), Philippines (15.10%)
> No. of naturalized citizens in 2017: 7,438
> No. of green cards granted in 2017: 12,733 (or 441 per 100,000 people)
[in-text-ad]

4. Florida
> Share of foreign-born citizens: 20.25% (total of 4,106,367 people)
> Share of foreign-born non-citizens: 9.23% (total of 1,871,063 people)
> State’s total population: 20,278,447
> Origin of largest immigrant groups: Caribbean (41.31%), Cuba (23.08%)
> No. of naturalized citizens in 2017: 69,485
> No. of green cards granted in 2017: 127,609 (or 629 per 100,000 people)
[recirclink id=450256]

3. New Jersey
> Share of foreign-born citizens: 22.09% (total of 1,979,156 people)
> Share of foreign-born non-citizens: 10.02% (total of 897,450 people)
> State’s total population: 8,960,161
> Origin of largest immigrant groups: Caribbean (16.22%), India (12.76%)
> No. of naturalized citizens in 2017: 38,611
> No. of green cards granted in 2017: 54,440 (or 608 per 100,000 people)

2. New York
> Share of foreign-born citizens: 22.68% (total of 4,490,656 people)
> Share of foreign-born non-citizens: 10.13% (total of 2,006,012 people)
> State’s total population: 19,798,228
> Origin of largest immigrant groups: Caribbean (24.54%), Dominican Republic (11.01%)
> No. of naturalized citizens in 2017: 86,407
> No. of green cards granted in 2017: 139,409 (or 704 per 100,000 people)
[in-text-ad-2]

1. California
> Share of foreign-born citizens: 26.98% (total of 10,518,488 people)
> Share of foreign-born non-citizens: 13.47% (total of 5,250,604 people)
> State’s total population: 38,982,847
> Origin of largest immigrant groups: Mexico (39.90%), China (8.43%)
> No. of naturalized citizens in 2017: 157,364
> No. of green cards granted in 2017: 214,243 (or 550 per 100,000 people)
Contact [email protected] for any questions or corrections.