[cnxvideo id=”922965″ placement=”ros”]
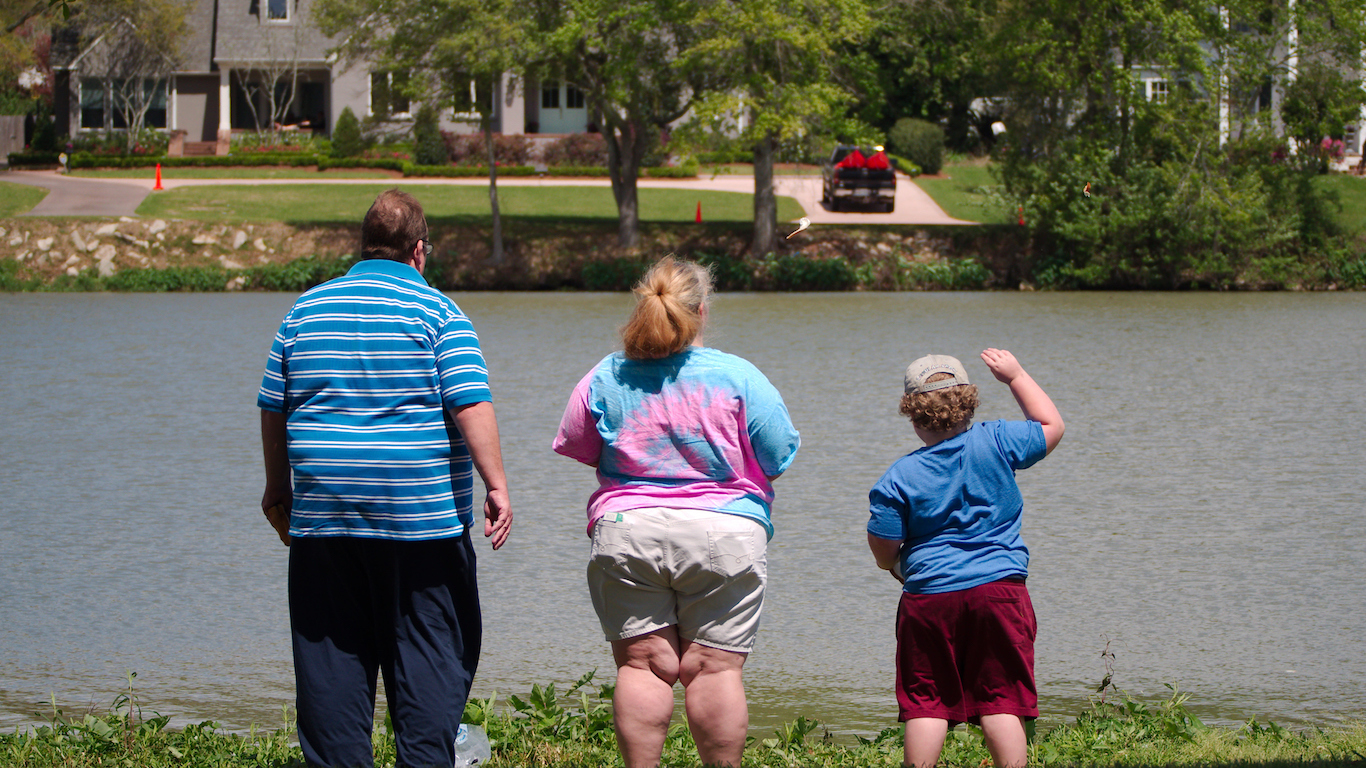
It is old news that obesity is a major problem in this country today. An estimated 160 million Americans are either obese or overweight, or nearly 75% of adult men, more than 60% of adult women, and nearly 30% of those under the age of 20. That is according to calculations made five years ago by Seattle’s Institute for Health Metrics and Evaluation, an independent population health research center at the University of Washington’s UW Medicine.
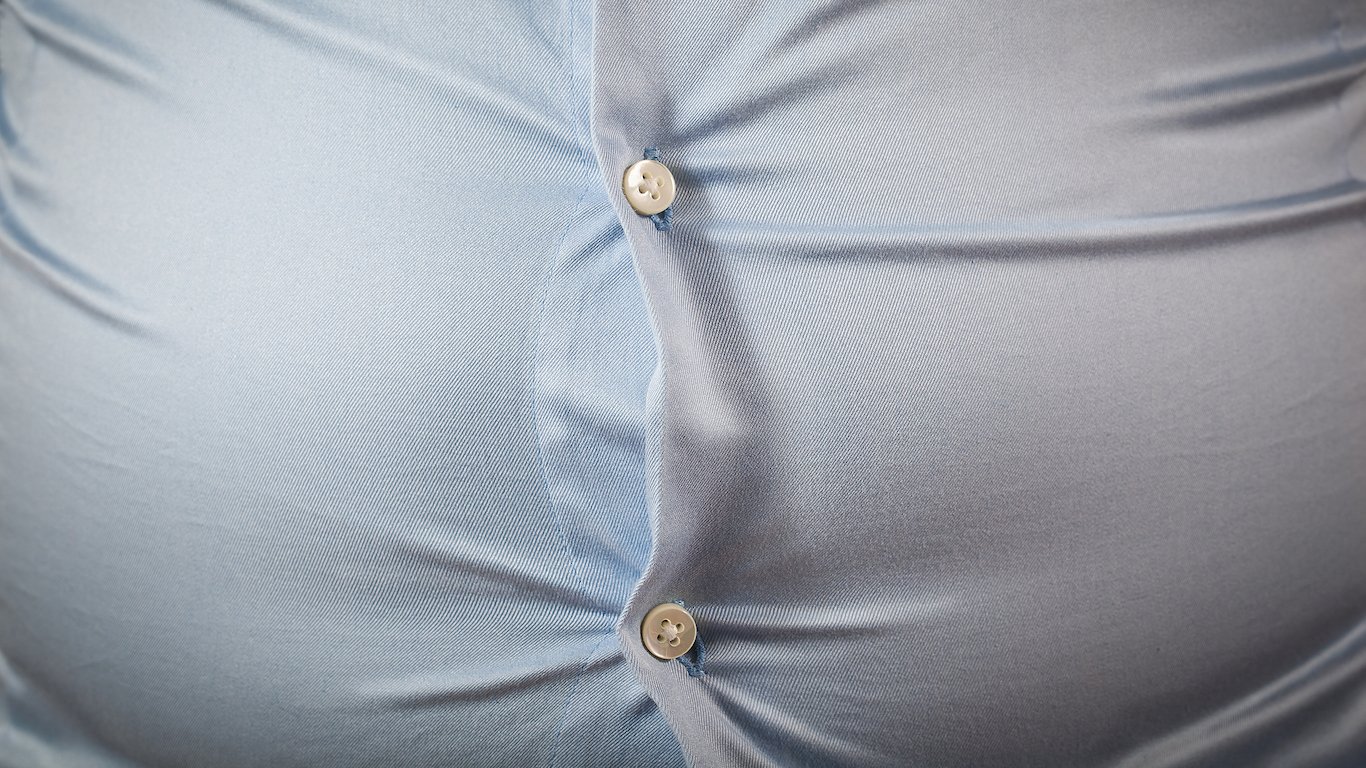
The Centers for Disease Control and Prevention considers anyone with a body mass index (BMI) between 25 and 30 to be overweight, and with a BMI of 30 or higher to be indicating obesity. Class 3 obesity, sometimes called “extreme” or “severe,” is a BMI of 40 or above.
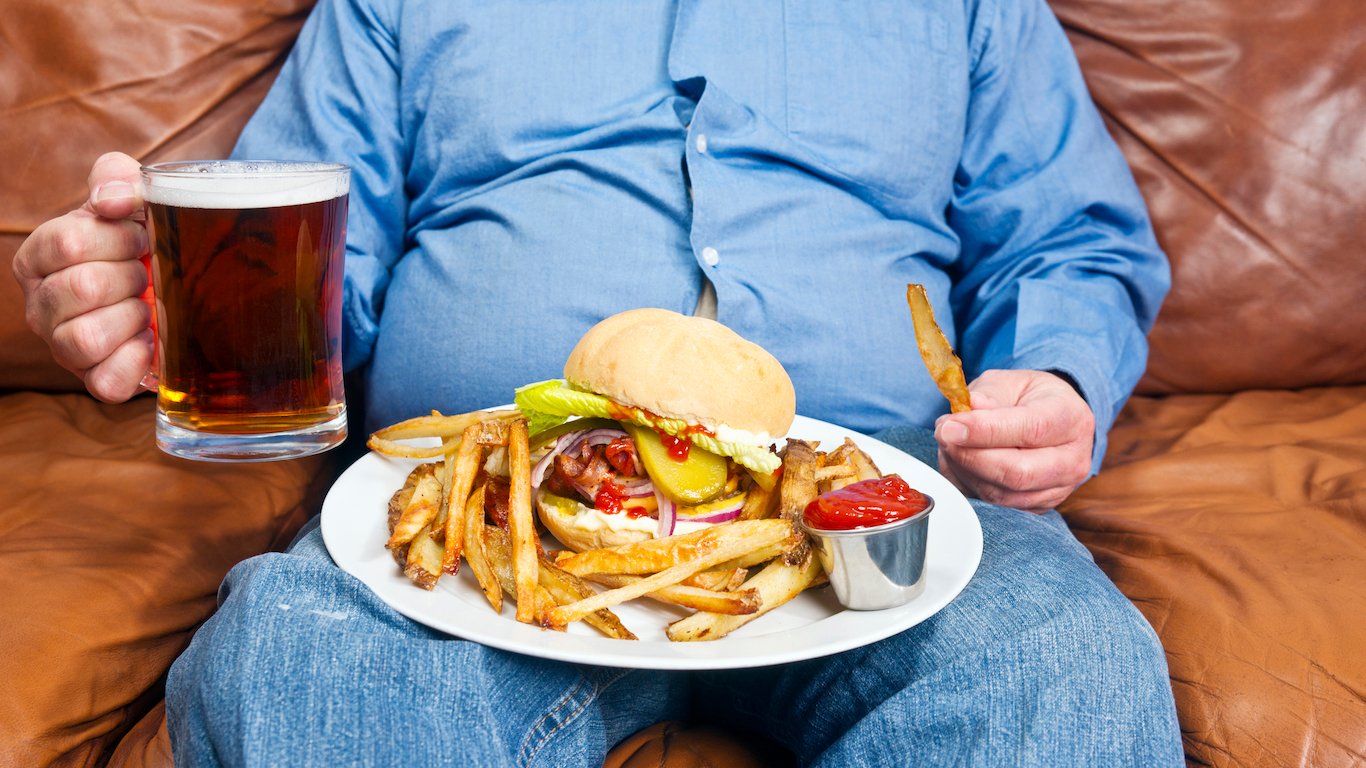
Public health officials and other researchers blame various factors for the problem — among them the prevalence of fast food, the size of portions, the increase in meat consumption, our love for sugary soft drinks, our embrace of low-fat, high-sugar “diet foods,” and our relatively sedentary lifestyle.
Rates of obesity are not evenly distributed around the country. Nine of the 20 cities with the highest adult obesity rates are in the South — 11 if you count the entries in Texas and Maryland. (Because what people eat and drink is not the only cause of obesity — though it may be one of the most important one — the most obese cities are not necessarily the cities with the worst diets.)
Click here for the most obese city in every state
Click here to see our full methodology
What accounts for this geographical bias? Poverty is one factor, implying fewer opportunities for healthy eating and exercise. More than half of the 15 states with the lowest median household income are in the South. Climate can be another influence. In Texas and parts of the South, temperatures are so high in summer and sometimes spring and fall that outdoor exercise becomes unpleasant, if not dangerous.
Then there is the number of fast food restaurants per capita. Half a dozen of the 15 states with the highest concentration of such places are also in the South. And unfortunately, it is all too easy for people in whatever state to choose the unhealthiest item in every fast food chain.
Of course, obesity is not exclusively a Southern issue. Oregon, Pennsylvania, New Jersey, Illinois, Michigan, and Indiana are among the non-Southern states with an obesity rate of over 35%. For reference, the national adult obesity rate is approximately 30%, and out of the 382 metro areas in the country, only two have obesity rates above 40%. Even in the states whose cities have the lowest rates — Vermont and Hawaii — nearly a quarter of the population is obese.
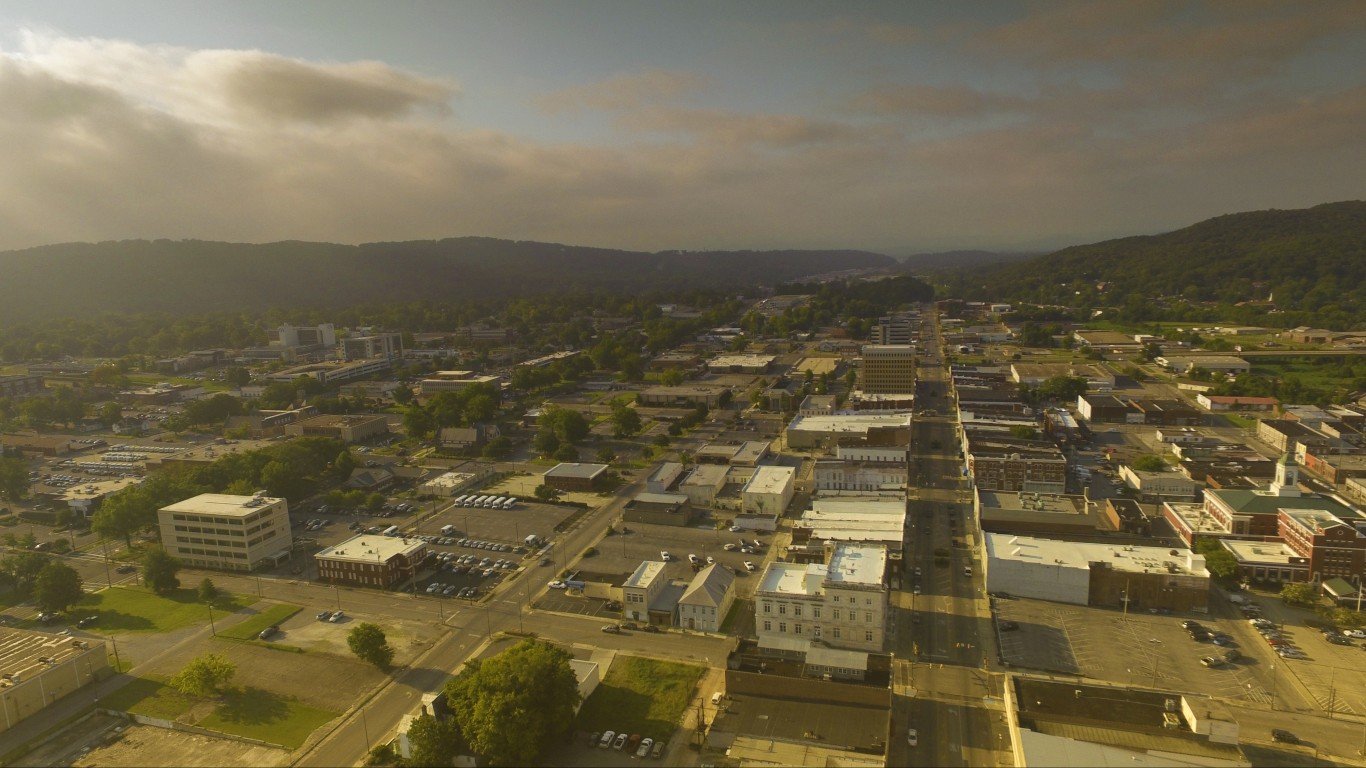
Alabama: Anniston-Oxford-Jacksonville
> Obesity rate: 37.1% (city) 35.1% (state)
> Adults who do not exercise: 30.2% (city) 28.2% (state)
> Population with access to exercise venues: 44.7% (city) 61.6% (state)
> Adults with diabetes: 16.2% (city) 13.9% (state)
> Adults who report fair or poor health: 19.6% (city) 21.4% (state)
> Poverty rate: 17.7% (city) 16.9% (state)
[in-text-ad]
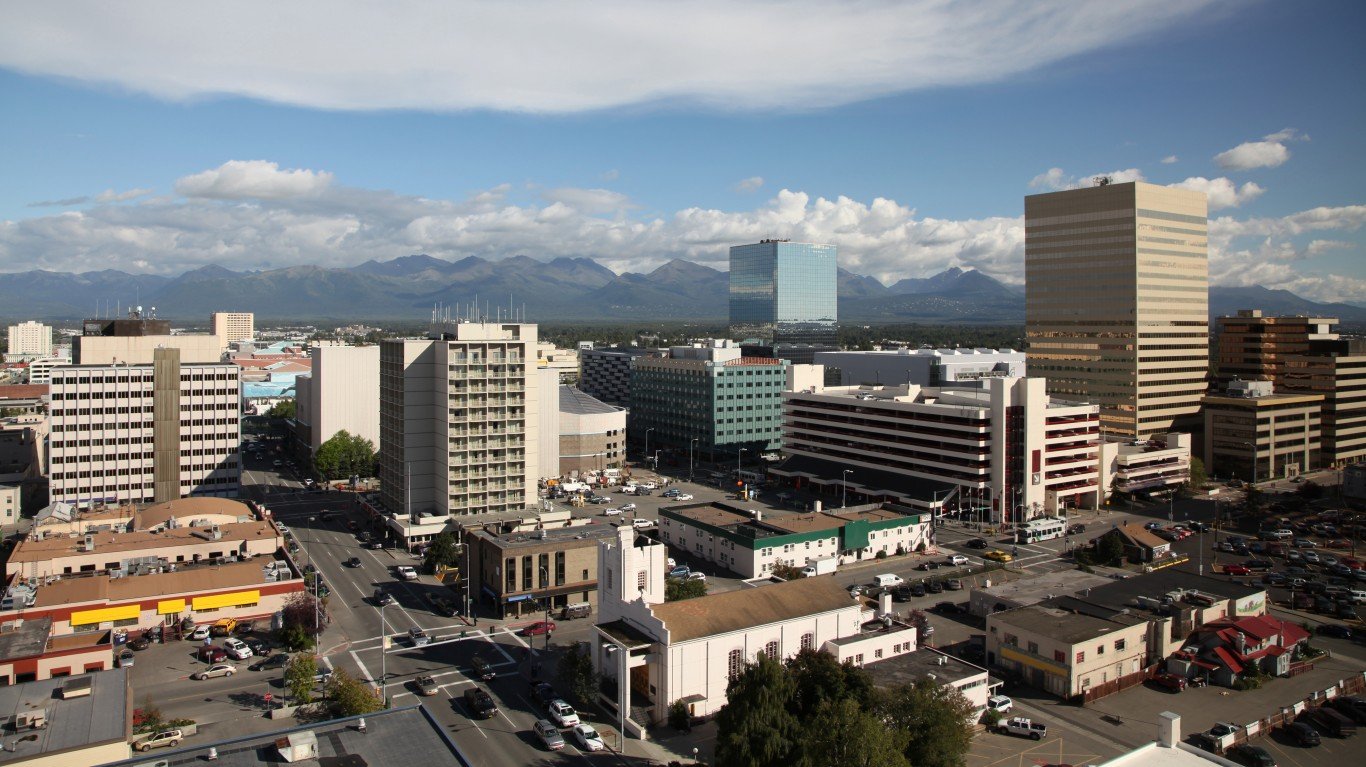
Alaska: Anchorage
> Obesity rate: 29.7% (city) 30.4% (state)
> Adults who do not exercise: 18.3% (city) 18.8% (state)
> Population with access to exercise venues: 83.6% (city) 82.2% (state)
> Adults with diabetes: 7.8% (city) 7.6% (state)
> Adults who report fair or poor health: 13.4% (city) 13.4% (state)
> Poverty rate: 10.4% (city) 11.1% (state)
[recirclink id=542323]
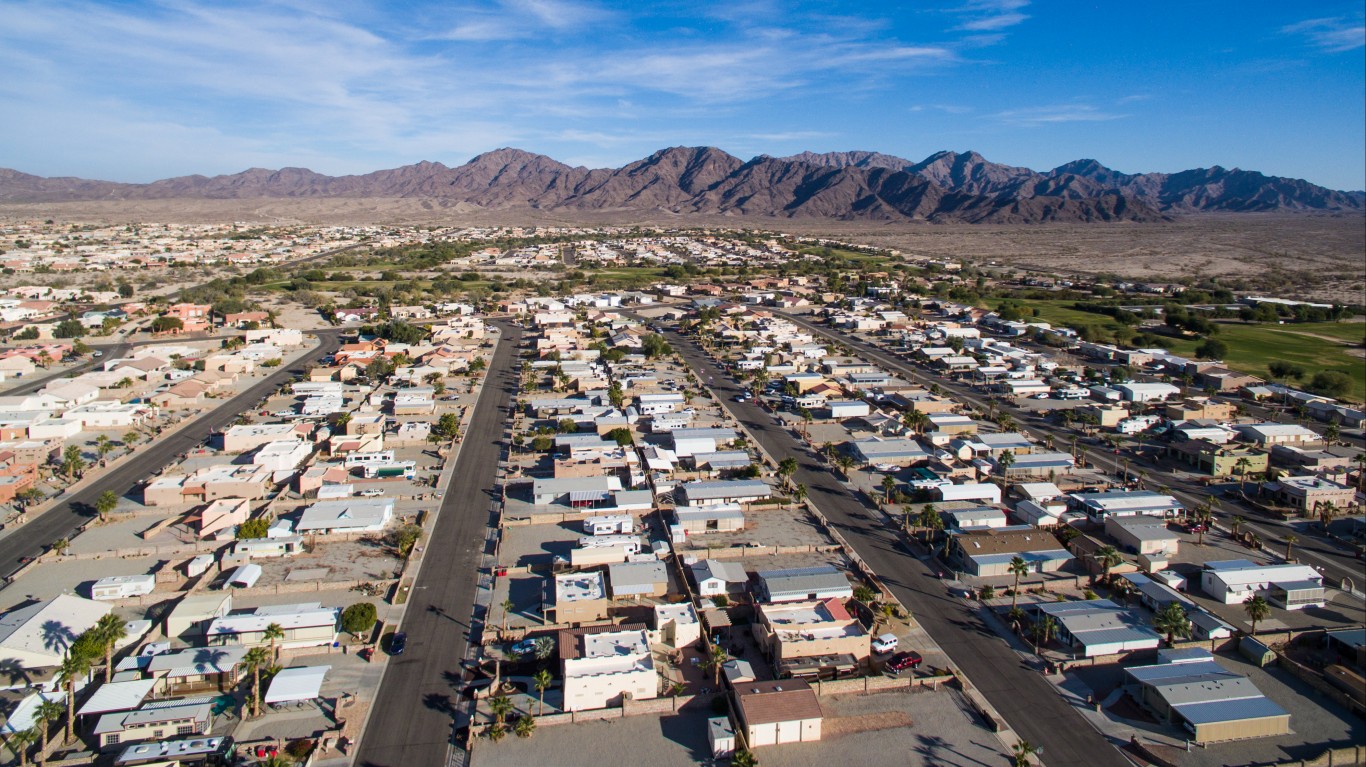
Arizona: Yuma
> Obesity rate: 33.1% (city) 27.2% (state)
> Adults who do not exercise: 25.8% (city) 20.2% (state)
> Population with access to exercise venues: 83.6% (city) 85.8% (state)
> Adults with diabetes: 13.7% (city) 9.8% (state)
> Adults who report fair or poor health: 25.9% (city) 17.8% (state)
> Poverty rate: 18.3% (city) 14.9% (state)
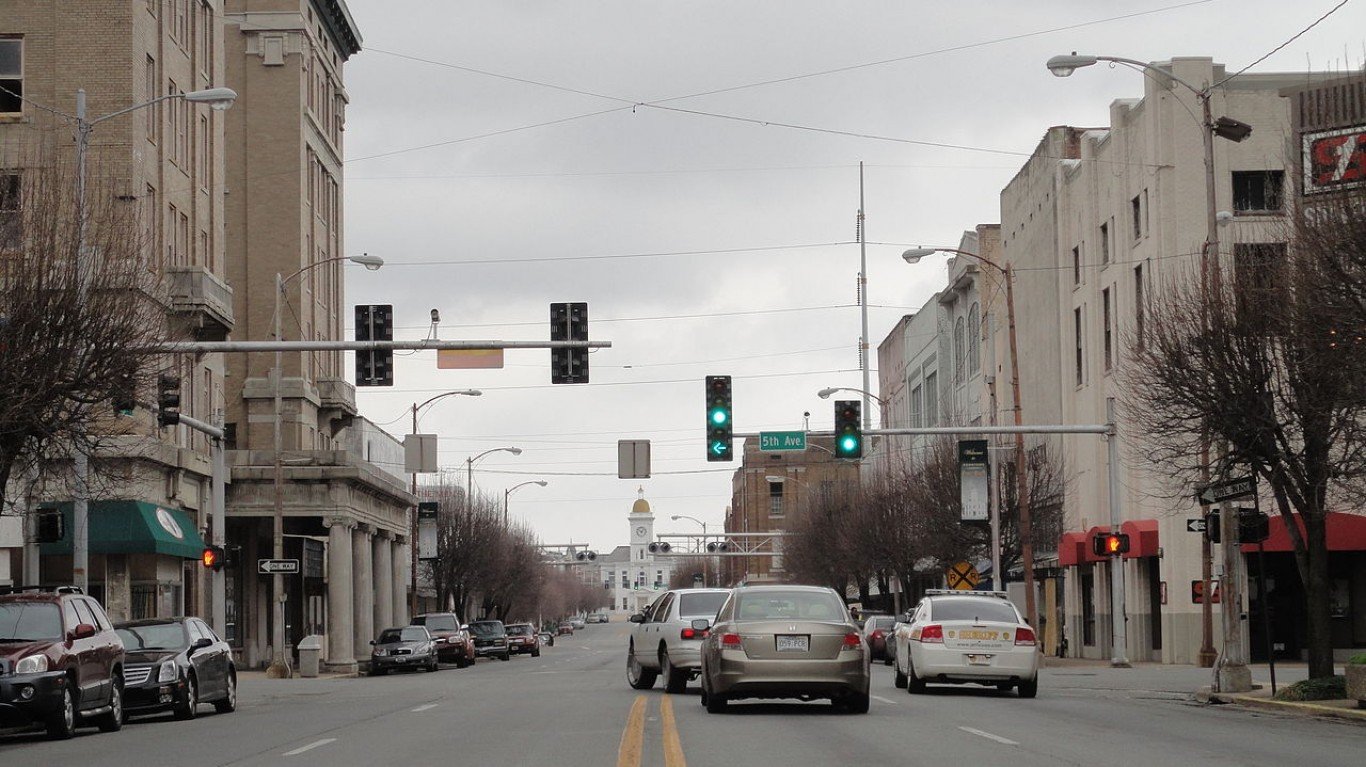
Arkansas: Pine Bluff
> Obesity rate: 40.1 (city) 35.2% (state)
> Adults who do not exercise: 33.9% (city) 31.2% (state)
> Population with access to exercise venues: 47.2% (city) 64.6% (state)
> Adults with diabetes: 17.1% (city) 13.3% (state)
> Adults who report fair or poor health: 25.7% (city) 24.5% (state)
> Poverty rate: 19.8% (city) 16.4% (state)
[in-text-ad-2]
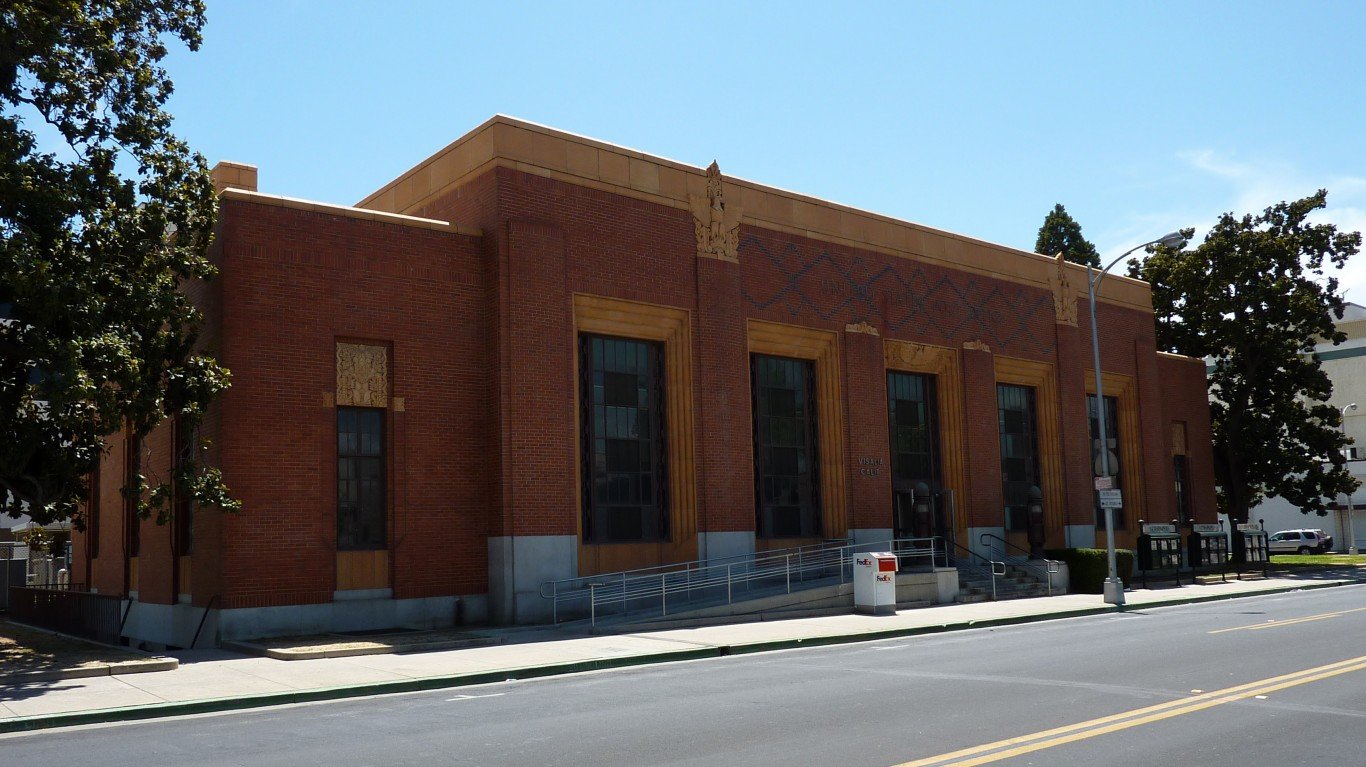
California: Visalia-Porterville
> Obesity rate: 33.5 (city) 22.7% (state)
> Adults who do not exercise: 24.2% (city) 17.4% (state)
> Population with access to exercise venues: 60.5% (city) 92.9% (state)
> Adults with diabetes: 8.5% (city) 8.5% (state)
> Adults who report fair or poor health: 26.6% (city) 17.5% (state)
> Poverty rate: 24.6% (city) 13.3% (state)
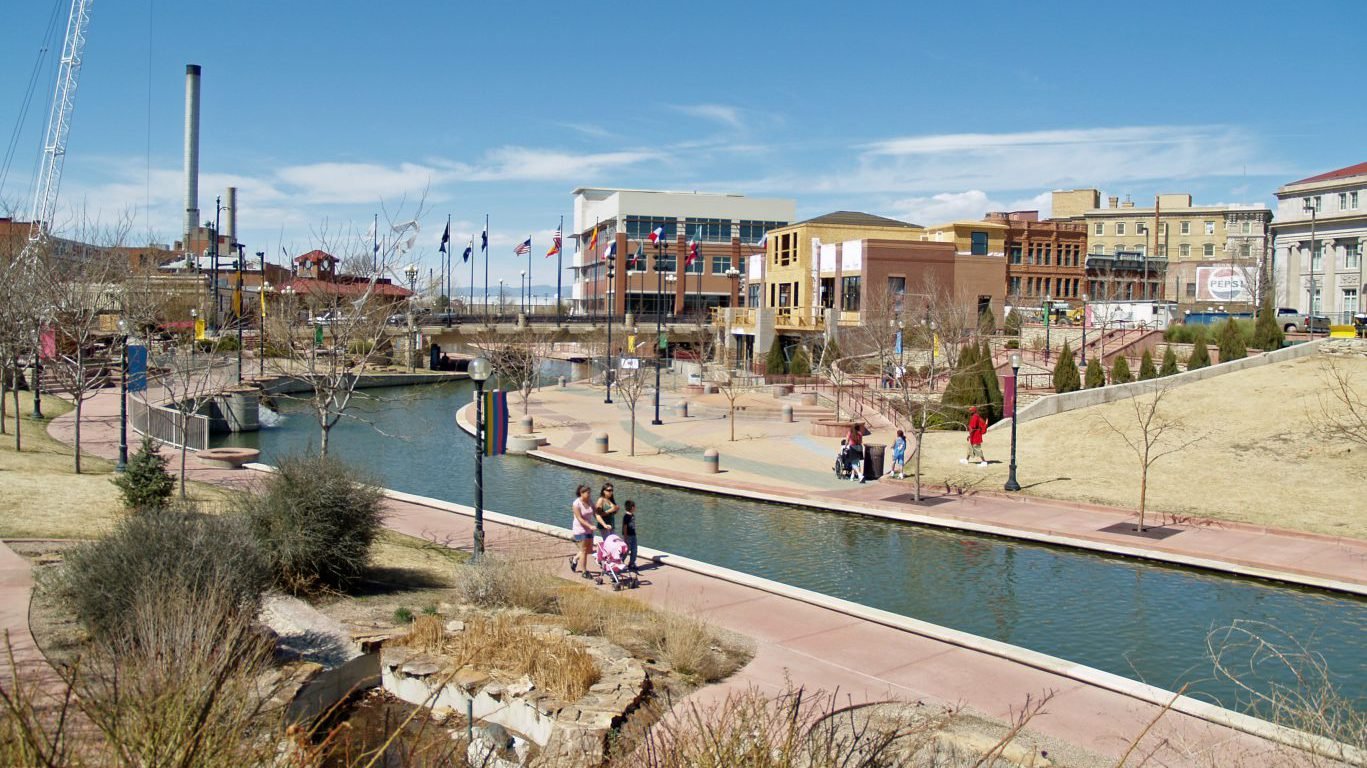
Colorado: Pueblo
> Obesity rate: 28.0 (city) 21.0% (state)
> Adults who do not exercise: 19.8% (city) 14.0% (state)
> Population with access to exercise venues: 68.1% (city) 90.6% (state)
> Adults with diabetes: 8.4% (city) 6.2% (state)
> Adults who report fair or poor health: 22.1% (city) 14.3% (state)
> Poverty rate: 18.1% (city) 10.3% (state)
[in-text-ad]
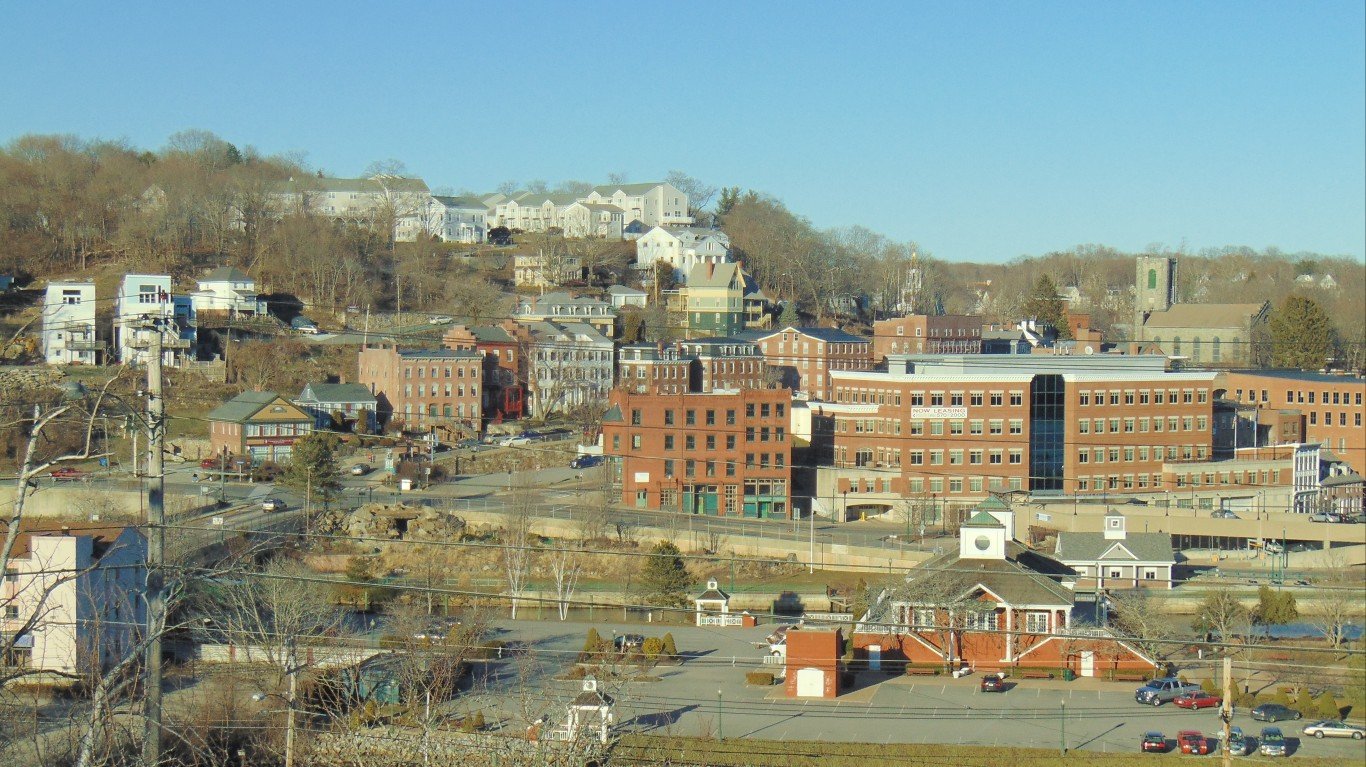
Connecticut: Norwich-New London
> Obesity rate: 29.6 (city) 25.5% (state)
> Adults who do not exercise: 20.0% (city) 19.3% (state)
> Population with access to exercise venues: 92.9% (city) 93.6% (state)
> Adults with diabetes: 9.1% (city) 8.7% (state)
> Adults who report fair or poor health: 12.1% (city) 13.8% (state)
> Poverty rate: 8.2% (city) 9.6% (state)
[recirclink id=565841]

Delaware: Dover
> Obesity rate: 33.8 (city) 30.6% (state)
> Adults who do not exercise: 29.5% (city) 25.4% (state)
> Population with access to exercise venues: 60.0% (city) 84.7% (state)
> Adults with diabetes: 13.0% (city) 11.5% (state)
> Adults who report fair or poor health: 16.9% (city) 15.8% (state)
> Poverty rate: 13.8% (city) 13.6% (state)

Florida: Lakeland-Winter Haven
> Obesity rate: 35.3 (city) 26.5% (state)
> Adults who do not exercise: 27.2% (city) 24.7% (state)
> Population with access to exercise venues: 82.2% (city) 87.9% (state)
> Adults with diabetes: 14.1% (city) 10.9% (state)
> Adults who report fair or poor health: 20.3% (city) 18.5% (state)
> Poverty rate: 16.0% (city) 14.0% (state)
[in-text-ad-2]

Georgia: Hinesville
> Obesity rate: 35.8 (city) 30.3% (state)
> Adults who do not exercise: 26.9% (city) 24.3% (state)
> Population with access to exercise venues: 60.1% (city) 76.0% (state)
> Adults with diabetes: 11.3% (city) 11.6% (state)
> Adults who report fair or poor health: 20.0% (city) 18.8% (state)
> Poverty rate: 19.1% (city) 14.9% (state)
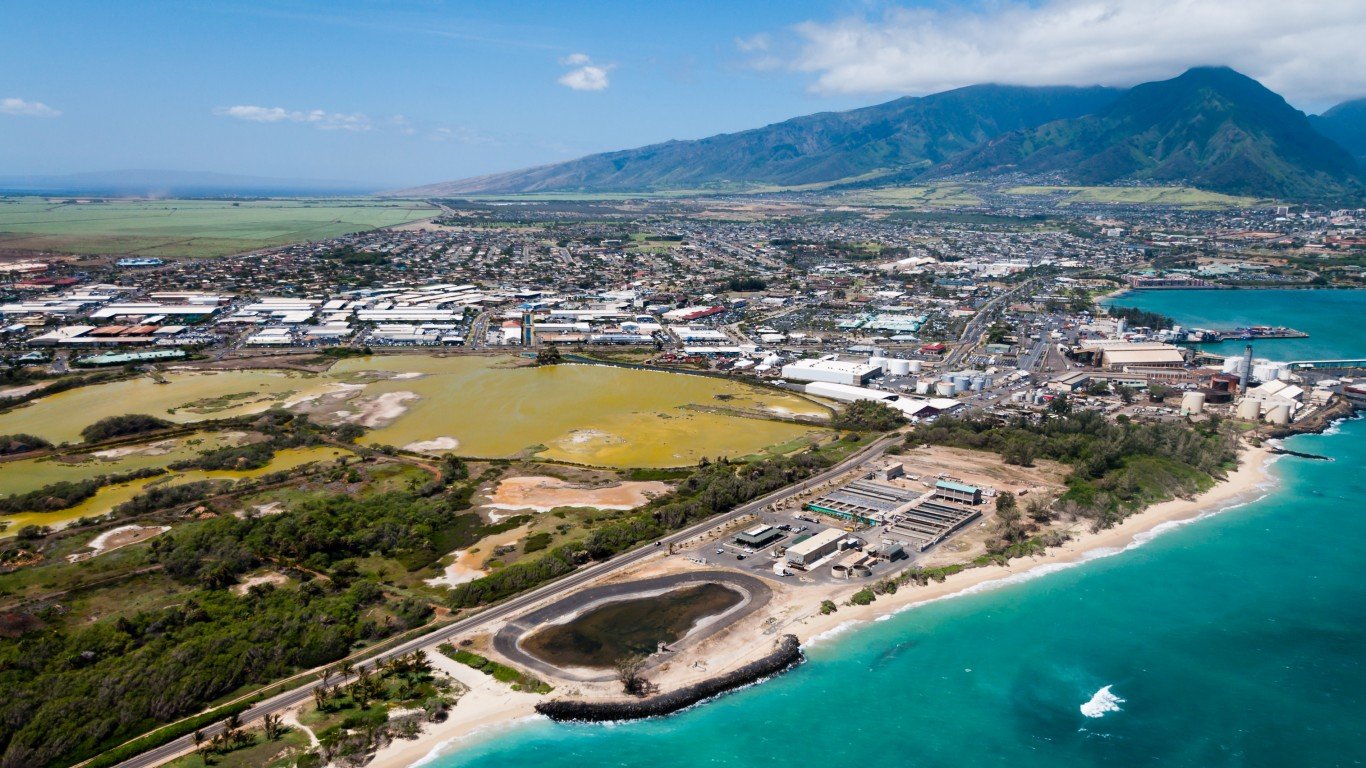
Hawaii: Kahului-Wailuku-Lahaina
> Obesity rate: 23.2 (city) 23.1% (state)
> Adults who do not exercise: 18.8% (city) 19.8% (state)
> Population with access to exercise venues: 87.2% (city) 91.5% (state)
> Adults with diabetes: 9.3% (city) 9.8% (state)
> Adults who report fair or poor health: 12.8% (city) 14.0% (state)
> Poverty rate: 9.7% (city) 9.5% (state)
[in-text-ad]
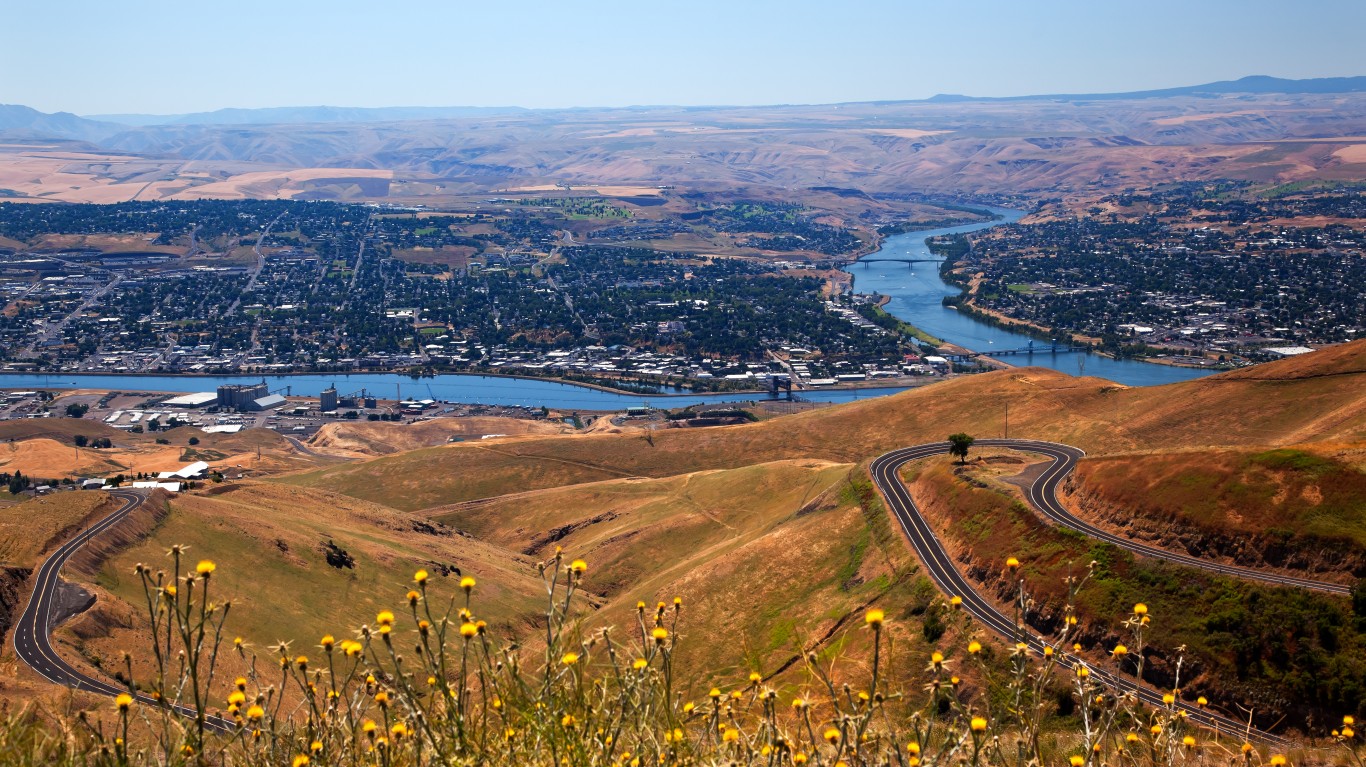
Idaho: Lewiston, ID-WA
> Obesity rate: 31.9 (city) 28.3% (state)
> Adults who do not exercise: 21.7% (city) 19.0% (state)
> Population with access to exercise venues: 73.9% (city) 78.2% (state)
> Adults with diabetes: 10.7% (city) 8.5% (state)
> Adults who report fair or poor health: 14.7% (city) 15.3% (state)
> Poverty rate: 10.1% (city) 12.8% (state)
[recirclink id=555791]

Illinois: Danville
> Obesity rate: 35.3 (city) 28.7% (state)
> Adults who do not exercise: 27.9% (city) 21.5% (state)
> Population with access to exercise venues: 75.2% (city) 90.8% (state)
> Adults with diabetes: 11.2% (city) 9.3% (state)
> Adults who report fair or poor health: 18.9% (city) 17.2% (state)
> Poverty rate: 19.9% (city) 12.6% (state)

Indiana: Michigan City-La Porte
> Obesity rate: 36.6 (city) 32.8% (state)
> Adults who do not exercise: 25.2% (city) 25.1% (state)
> Population with access to exercise venues: 75.3% (city) 75.3% (state)
> Adults with diabetes: 12.0% (city) 11.5% (state)
> Adults who report fair or poor health: 17.2% (city) 17.7% (state)
> Poverty rate: 14.3% (city) 13.5% (state)
[in-text-ad-2]

Iowa: Sioux City, IA-NE-SD
> Obesity rate: 35.7 (city) 32.2% (state)
> Adults who do not exercise: 26.6% (city) 23.0% (state)
> Population with access to exercise venues: 88.5% (city) 82.8% (state)
> Adults with diabetes: 10.0% (city) 9.6% (state)
> Adults who report fair or poor health: 15.5% (city) 13.1% (state)
> Poverty rate: 12.2% (city) 10.7% (state)
Kansas: Topeka
> Obesity rate: 35.7 (city) 33.2% (state)
> Adults who do not exercise: 24.3% (city) 23.5% (state)
> Population with access to exercise venues: 82.2% (city) 80.4% (state)
> Adults with diabetes: 11.2% (city) 9.8% (state)
> Adults who report fair or poor health: 14.4% (city) 15.0% (state)
> Poverty rate: 10.9% (city) 11.9% (state)
[in-text-ad]
Kentucky: Elizabethtown-Fort Knox
> Obesity rate: 35.8 (city) 34.2% (state)
> Adults who do not exercise: 27.2% (city) 27.4% (state)
> Population with access to exercise venues: 53.9% (city) 71.0% (state)
> Adults with diabetes: 12.8% (city) 13.1% (state)
> Adults who report fair or poor health: 19.5% (city) 21.3% (state)
> Poverty rate: 12.2% (city) 17.2% (state)
[recirclink id=548352]

Louisiana: Houma-Thibodaux
> Obesity rate: 40.4 (city) 35.3% (state)
> Adults who do not exercise: 30.9% (city) 28.5% (state)
> Population with access to exercise venues: 70.4% (city) 74.7% (state)
> Adults with diabetes: 11.9% (city) 12.1% (state)
> Adults who report fair or poor health: 19.6% (city) 21.1% (state)
> Poverty rate: 18.0% (city) 19.7% (state)
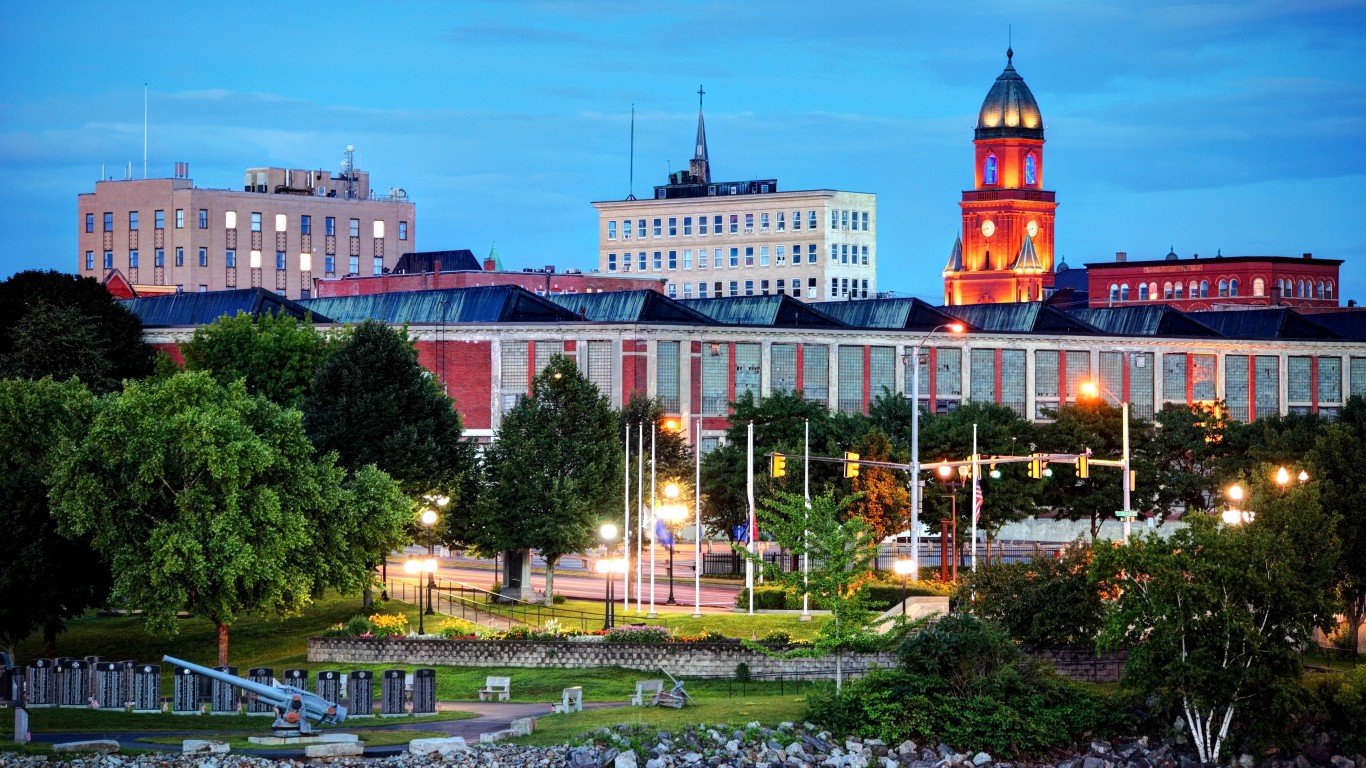
Maine: Lewiston-Auburn
> Obesity rate: 33.4 (city) 29.4% (state)
> Adults who do not exercise: 22.4% (city) 20.2% (state)
> Population with access to exercise venues: 85.0% (city) 70.0% (state)
> Adults with diabetes: 11.2% (city) 10.0% (state)
> Adults who report fair or poor health: 14.4% (city) 15.4% (state)
> Poverty rate: 11.7% (city) 11.1% (state)
[in-text-ad-2]
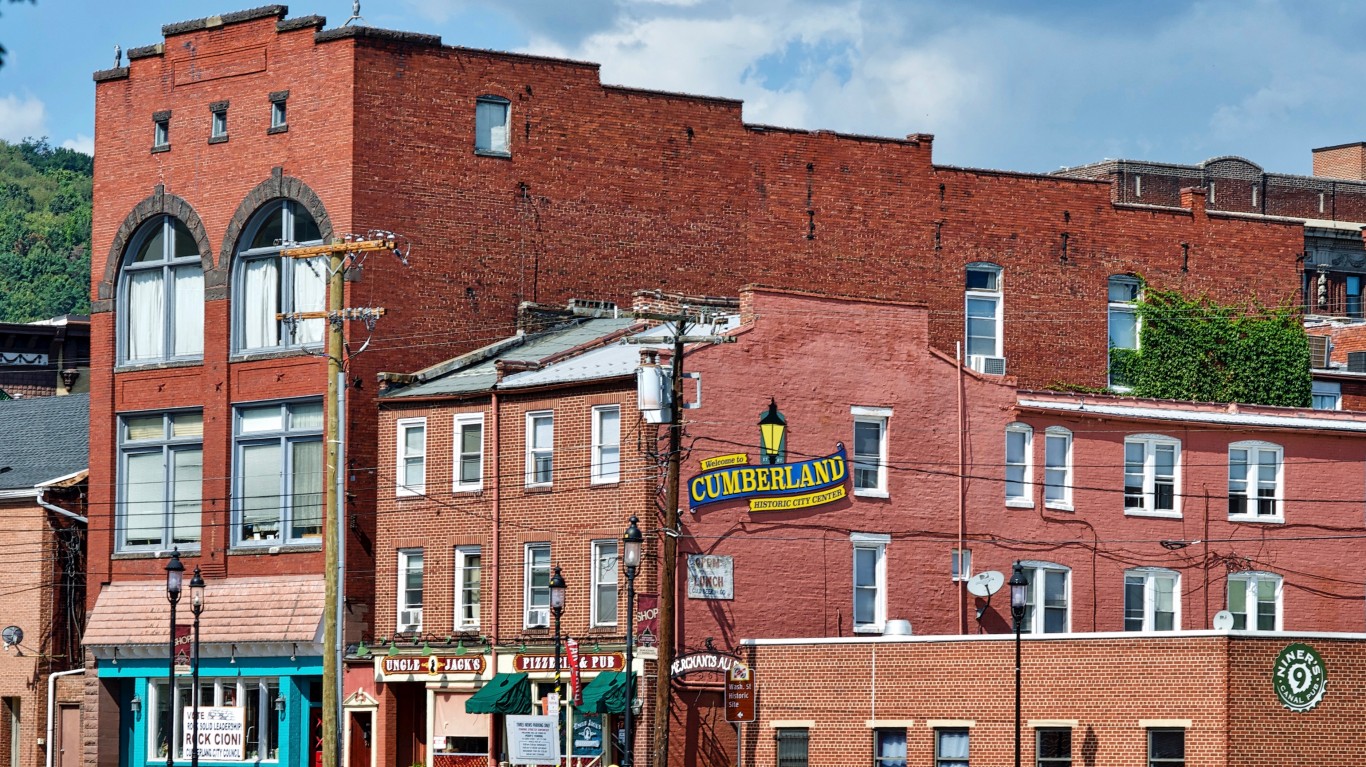
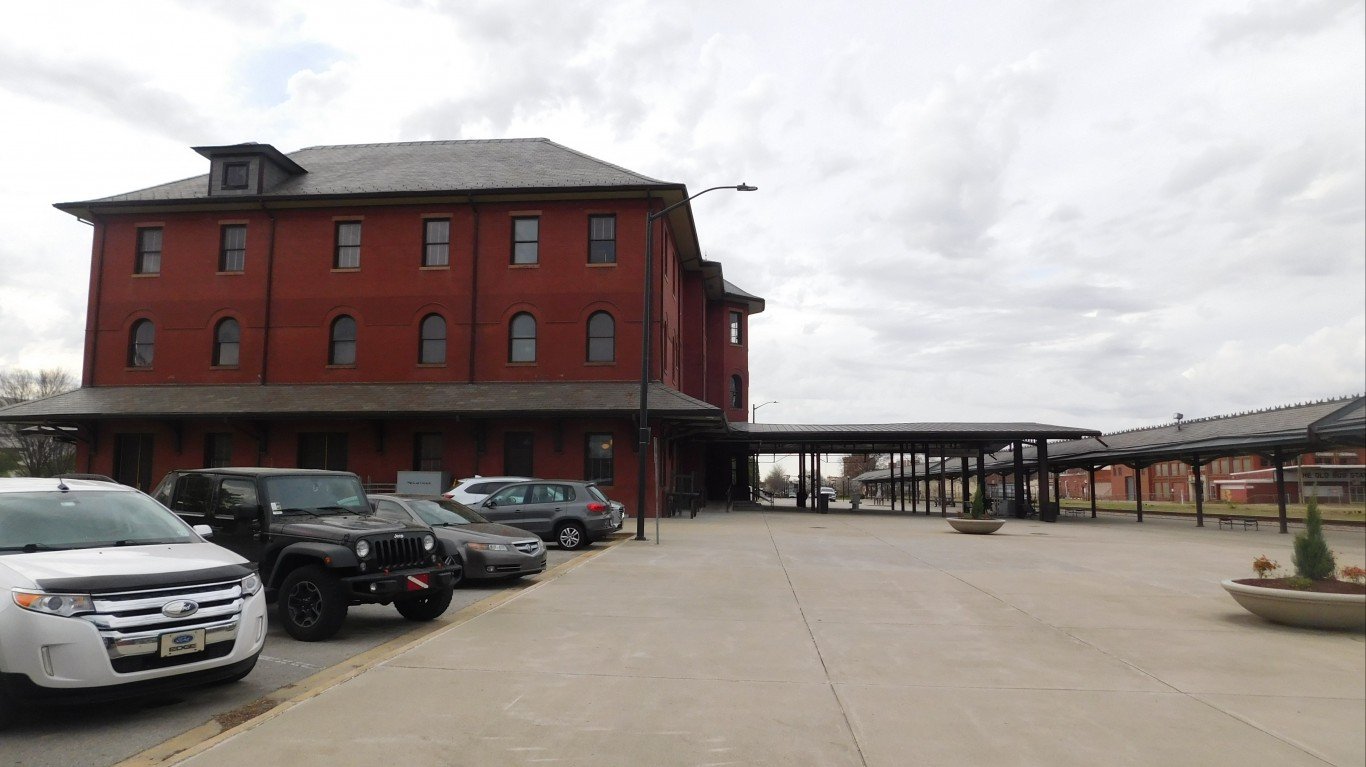
Maryland: Cumberland, MD-WV
> Obesity rate: 37.1 (city) 30.3% (state)
> Adults who do not exercise: 26.6% (city) 21.0% (state)
> Population with access to exercise venues: 76.6% (city) 92.4% (state)
> Adults with diabetes: 14.7% (city) 10.8% (state)
> Adults who report fair or poor health: 18.8% (city) 13.9% (state)
> Poverty rate: 14.3% (city) 9.3% (state)

Massachusetts: Worcester, MA-CT
> Obesity rate: 27.3 (city) 24.4% (state)
> Adults who do not exercise: 21.0% (city) 19.9% (state)
> Population with access to exercise venues: 91.4% (city) 94.0% (state)
> Adults with diabetes: 9.7% (city) 9.3% (state)
> Adults who report fair or poor health: 13.9% (city) 13.8% (state)
> Poverty rate: 10.6% (city) 10.5% (state)
[in-text-ad]
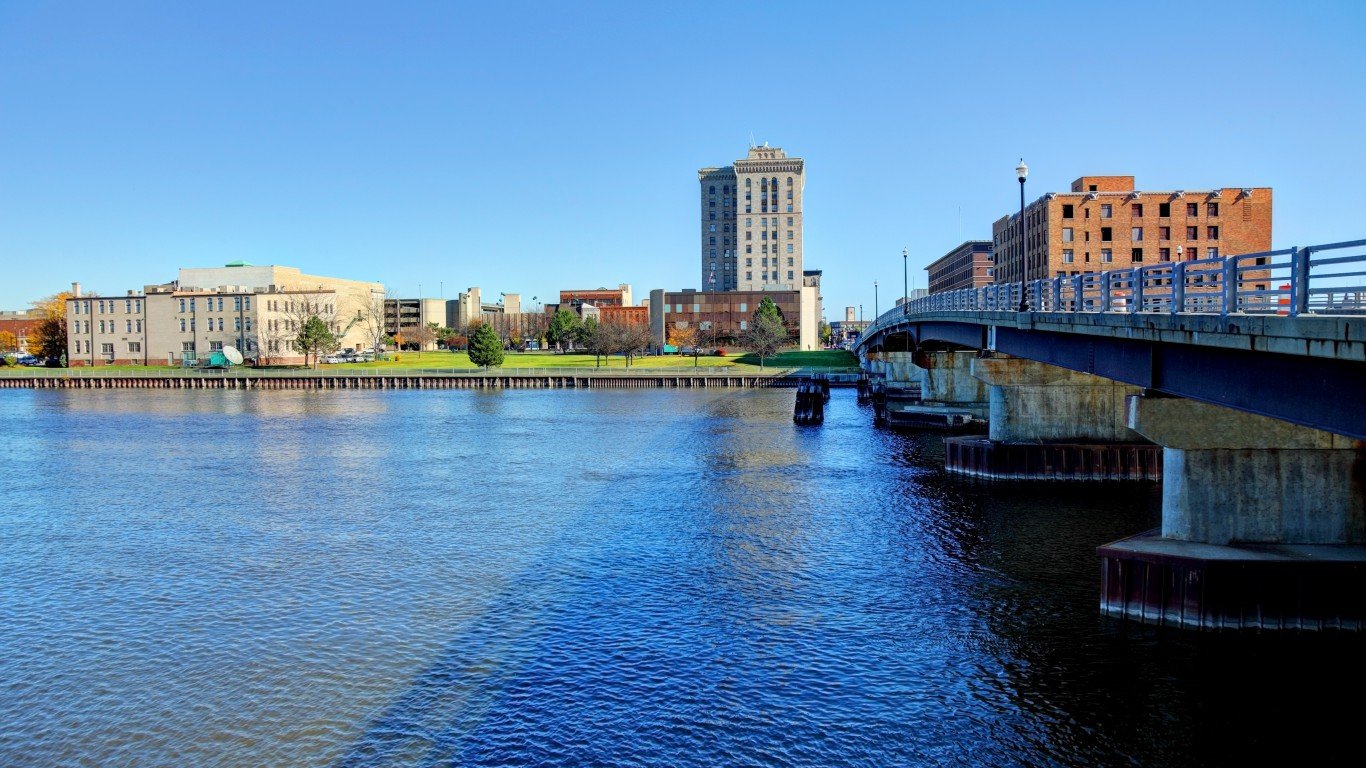
Michigan: Saginaw
> Obesity rate: 38.7 (city) 31.7% (state)
> Adults who do not exercise: 22.3% (city) 22.3% (state)
> Population with access to exercise venues: 72.6% (city) 85.4% (state)
> Adults with diabetes: 11.4% (city) 10.6% (state)
> Adults who report fair or poor health: 18.0% (city) 17.4% (state)
> Poverty rate: 17.4% (city) 14.2% (state)
[recirclink id=544481]
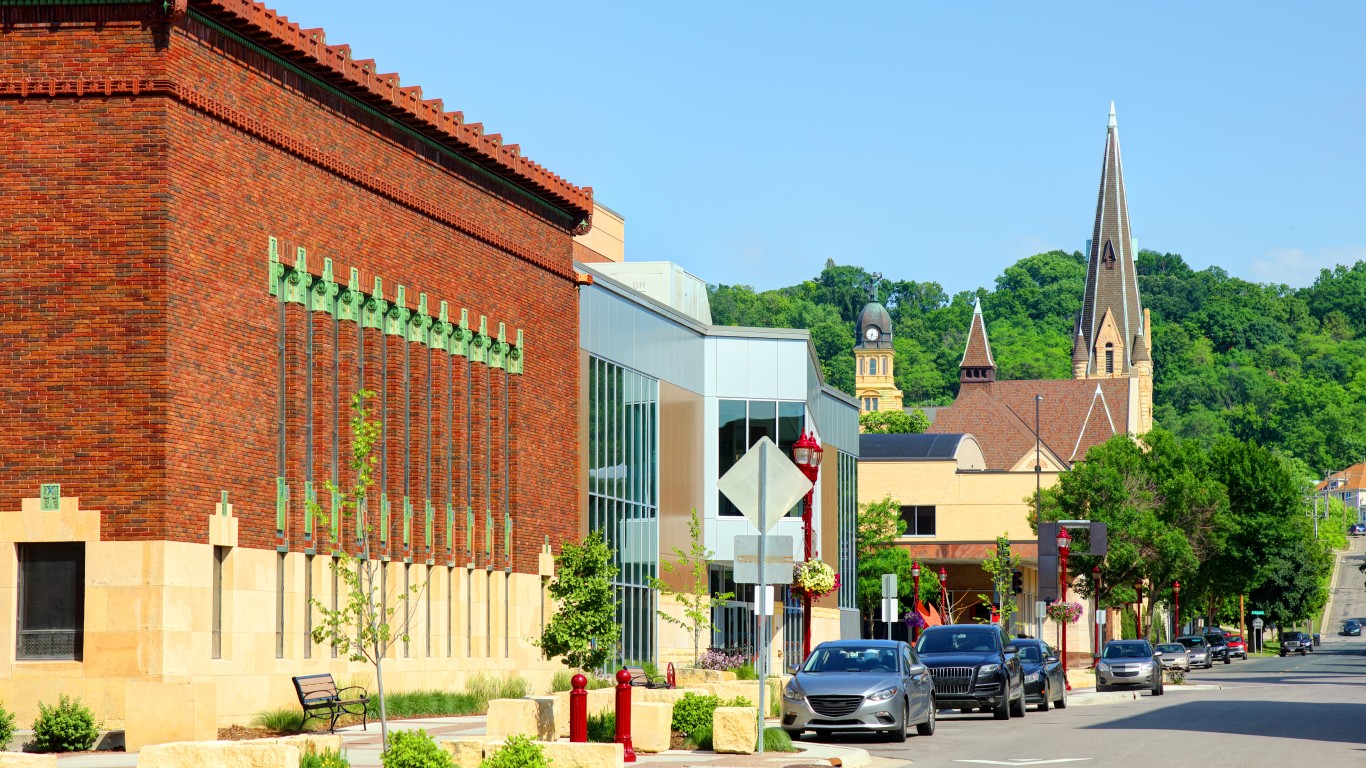
Minnesota: Mankato-North Mankato
> Obesity rate: 31.7 (city) 27.6% (state)
> Adults who do not exercise: 18.1% (city) 18.5% (state)
> Population with access to exercise venues: 83.2% (city) 87.2% (state)
> Adults with diabetes: 7.3% (city) 8.2% (state)
> Adults who report fair or poor health: 12.7% (city) 12.0% (state)
> Poverty rate: 15.0% (city) 9.5% (state)
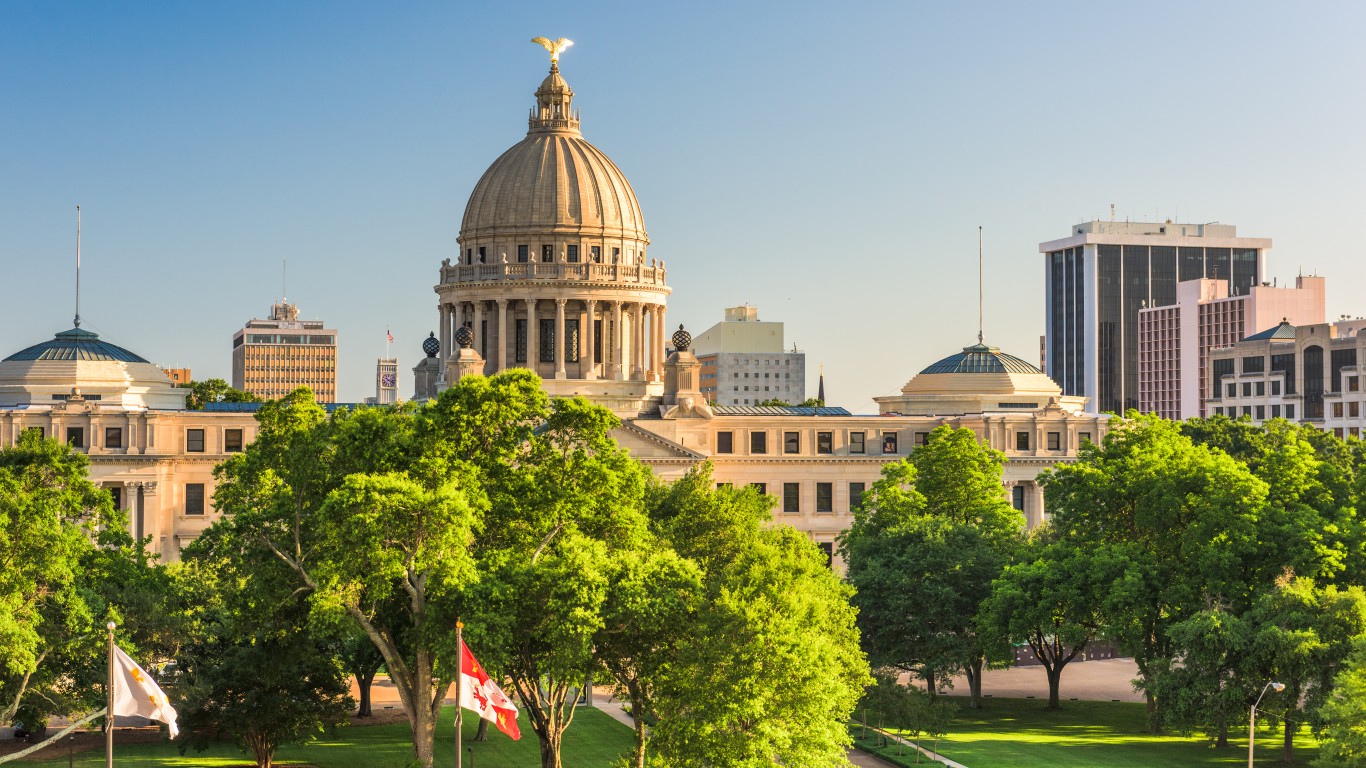
Mississippi: Jackson
> Obesity rate: 36.1 (city) 36.5% (state)
> Adults who do not exercise: 29.8% (city) 31.3% (state)
> Population with access to exercise venues: 66.9% (city) 55.5% (state)
> Adults with diabetes: 13.2% (city) 14.1% (state)
> Adults who report fair or poor health: 19.5% (city) 22.2% (state)
> Poverty rate: 15.4% (city) 19.8% (state)
[in-text-ad-2]

Missouri: St. Joseph, MO-KS
> Obesity rate: 35.7 (city) 32.2% (state)
> Adults who do not exercise: 29.5% (city) 25.0% (state)
> Population with access to exercise venues: 72.4% (city) 76.3% (state)
> Adults with diabetes: 11.8% (city) 11.8% (state)
> Adults who report fair or poor health: 20.5% (city) 18.5% (state)
> Poverty rate: 14.0% (city) 13.4% (state)
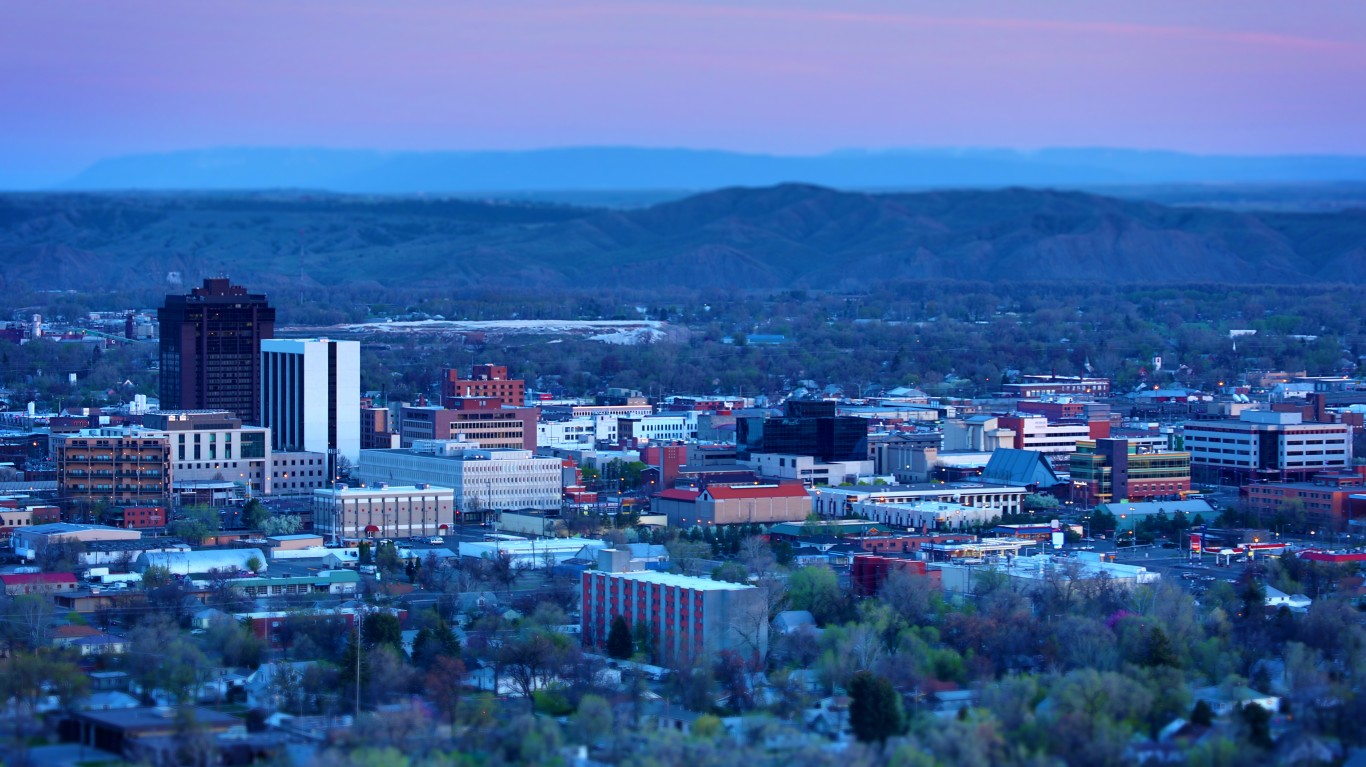
Montana: Billings
> Obesity rate: 27.1 (city) 25.4% (state)
> Adults who do not exercise: 20.7% (city) 19.6% (state)
> Population with access to exercise venues: 80.7% (city) 74.6% (state)
> Adults with diabetes: 8.6% (city) 8.3% (state)
> Adults who report fair or poor health: 13.8% (city) 13.9% (state)
> Poverty rate: 9.7% (city) 12.5% (state)
[in-text-ad]
Nebraska: Grand Island
> Obesity rate: 33.2 (city) 31.2% (state)
> Adults who do not exercise: 26.1% (city) 22.0% (state)
> Population with access to exercise venues: 79.0% (city) 83.5% (state)
> Adults with diabetes: 9.8% (city) 9.0% (state)
> Adults who report fair or poor health: 14.4% (city) 14.2% (state)
> Poverty rate: 10.3% (city) 10.8% (state)
[recirclink id=542323]
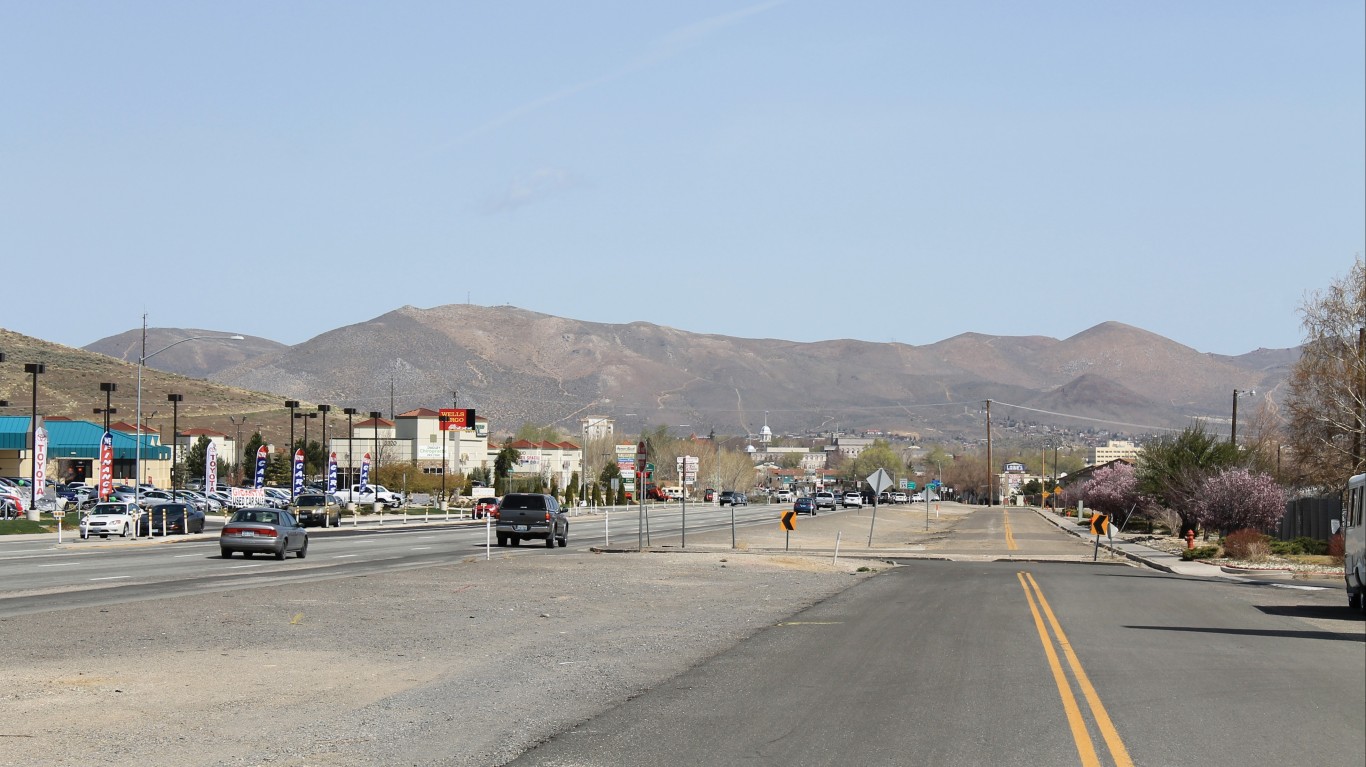
Nevada: Carson City
> Obesity rate: 27.5 (city) 26.5% (state)
> Adults who do not exercise: 21.0% (city) 21.7% (state)
> Population with access to exercise venues: 90.7% (city) 73.4% (state)
> Adults with diabetes: 10.6% (city) 10.0% (state)
> Adults who report fair or poor health: 18.8% (city) 20.5% (state)
> Poverty rate: 7.5% (city) 13.0% (state)

New Hampshire: Manchester-Nashua
> Obesity rate: 28.2 (city) 28.0% (state)
> Adults who do not exercise: 20.2% (city) 20.0% (state)
> Population with access to exercise venues: 90.3% (city) 87.5% (state)
> Adults with diabetes: 9.2% (city) 9.3% (state)
> Adults who report fair or poor health: 12.6% (city) 13.6% (state)
> Poverty rate: 8.2% (city) 7.7% (state)
[in-text-ad-2]
New Jersey: Vineland-Bridgeton
> Obesity rate: 35.1 (city) 26.2% (state)
> Adults who do not exercise: 30.2% (city) 23.6% (state)
> Population with access to exercise venues: 83.6% (city) 94.5% (state)
> Adults with diabetes: 11.4% (city) 9.1% (state)
> Adults who report fair or poor health: 23.2% (city) 16.5% (state)
> Poverty rate: 19.2% (city) 10.0% (state)
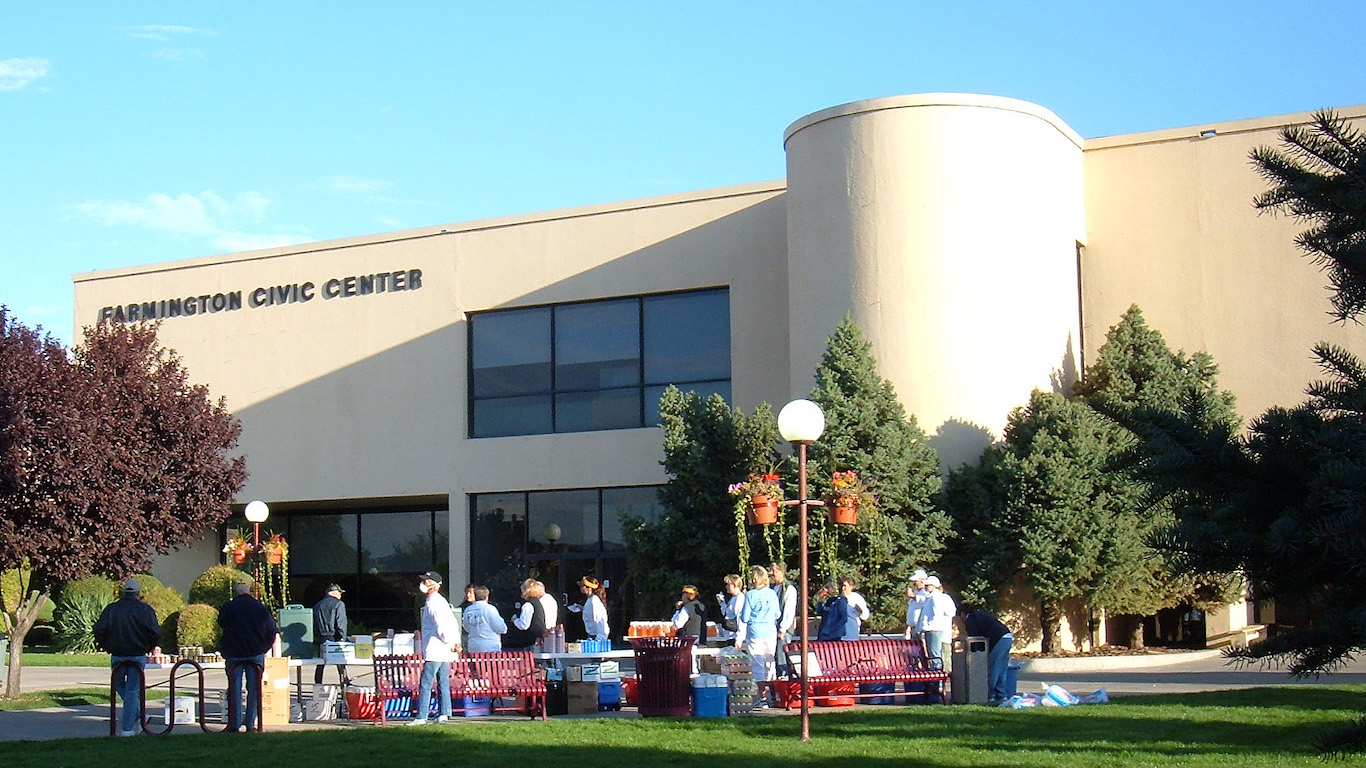
New Mexico: Farmington
> Obesity rate: 32.8 (city) 25.6% (state)
> Adults who do not exercise: 22.5% (city) 18.2% (state)
> Population with access to exercise venues: 55.0% (city) 76.9% (state)
> Adults with diabetes: 11.7% (city) 8.8% (state)
> Adults who report fair or poor health: 19.3% (city) 20.8% (state)
> Poverty rate: 24.8% (city) 19.7% (state)
[in-text-ad]
New York: Elmira
> Obesity rate: 34.6 (city) 25.7% (state)
> Adults who do not exercise: 27.4% (city) 24.5% (state)
> Population with access to exercise venues: 82.0% (city) 92.9% (state)
> Adults with diabetes: 11.3% (city) 9.8% (state)
> Adults who report fair or poor health: 16.1% (city) 16.1% (state)
> Poverty rate: 14.9% (city) 14.1% (state)
[recirclink id=565841]
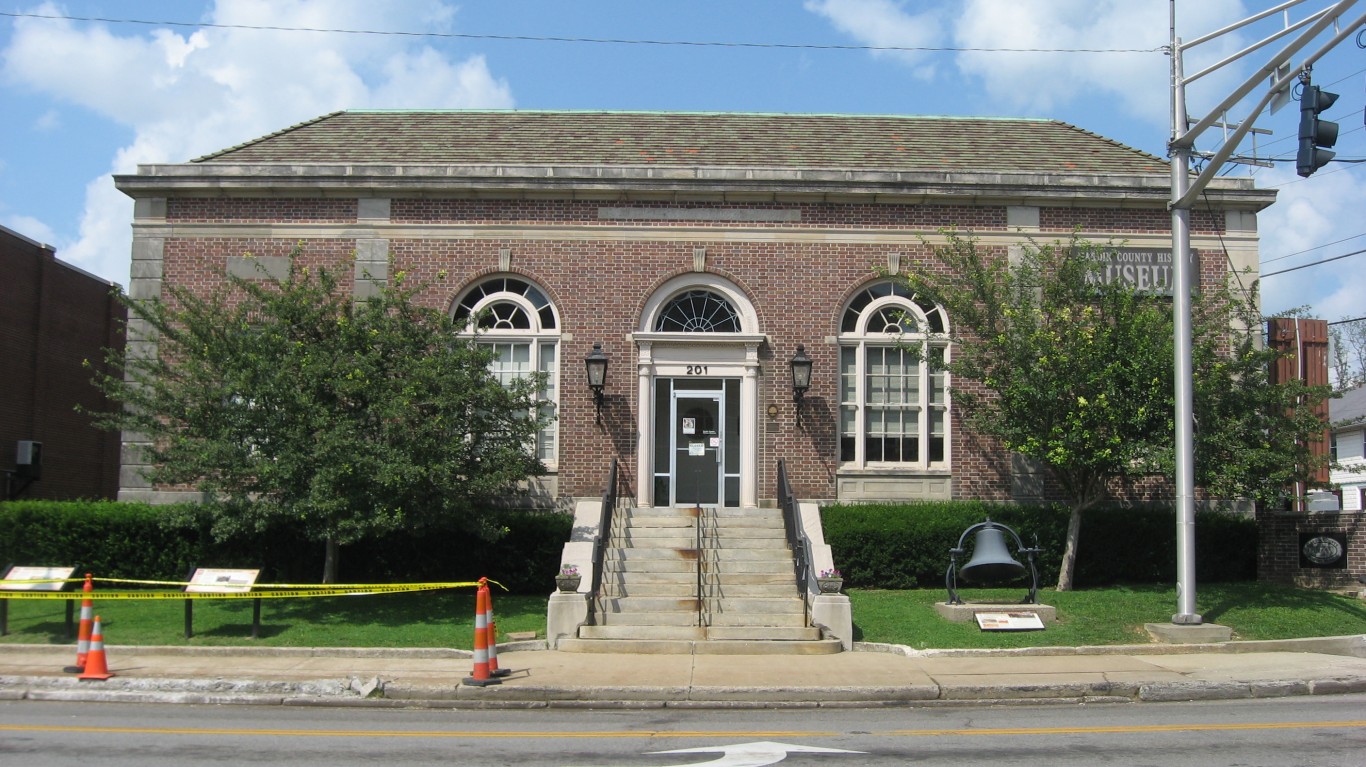
North Carolina: Rocky Mount
> Obesity rate: 36.7 (city) 30.2% (state)
> Adults who do not exercise: 26.2% (city) 23.0% (state)
> Population with access to exercise venues: 51.7% (city) 73.4% (state)
> Adults with diabetes: 14.9% (city) 11.0% (state)
> Adults who report fair or poor health: 21.4% (city) 17.6% (state)
> Poverty rate: 18.6% (city) 14.7% (state)
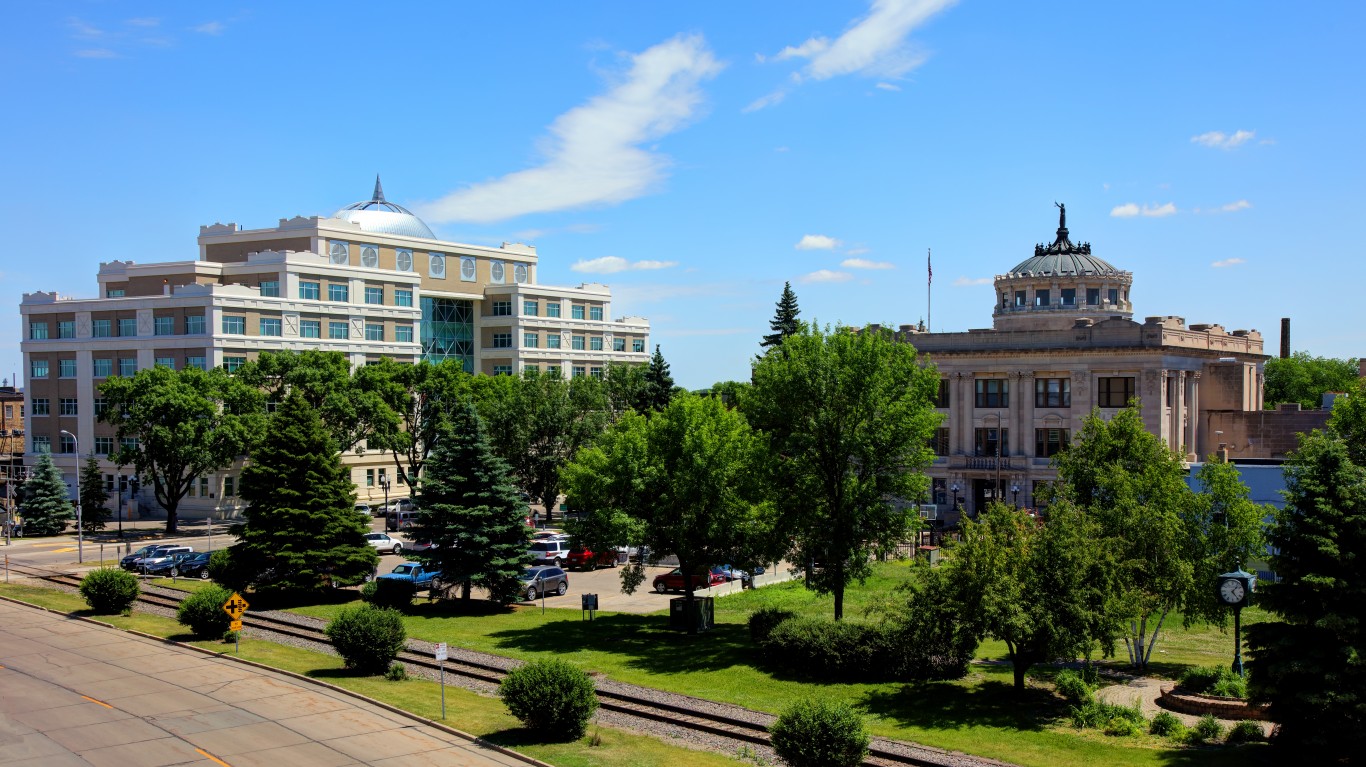
North Dakota: Grand Forks, ND-MN
> Obesity rate: 32.8% (city) 32.2% (state)
> Adults who do not exercise: 22.5% (city) 21.6% (state)
> Population with access to exercise venues: 78.1% (city) 74.2% (state)
> Adults with diabetes: 8.7% (city) 8.5% (state)
> Adults who report fair or poor health: 14.1% (city) 14.3% (state)
> Poverty rate: 15.5% (city) 10.3% (state)
[in-text-ad-2]

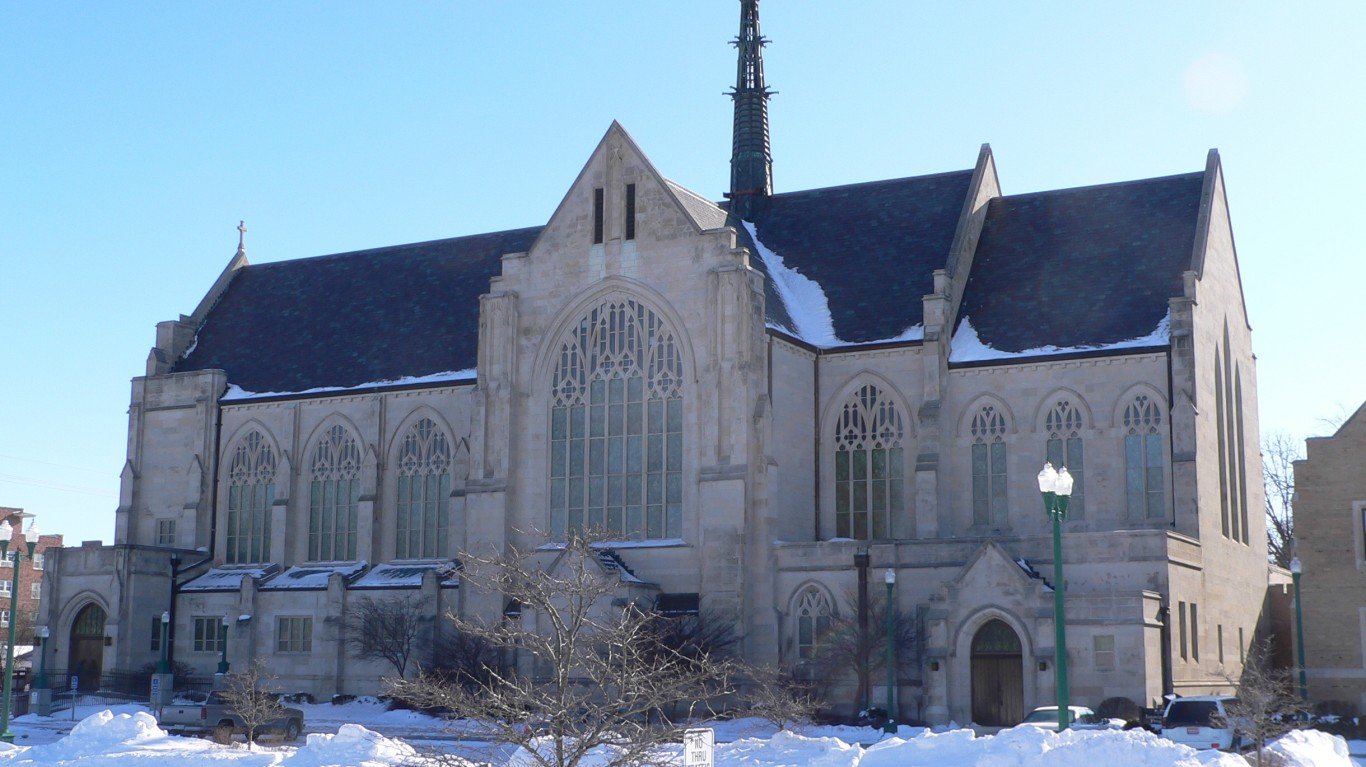
Ohio: Springfield
> Obesity rate: 35.7% (city) 31.8% (state)
> Adults who do not exercise: 27.9% (city) 24.6% (state)
> Population with access to exercise venues: 86.1% (city) 84.1% (state)
> Adults with diabetes: 14.2% (city) 11.7% (state)
> Adults who report fair or poor health: 16.9% (city) 17.0% (state)
> Poverty rate: 15.3% (city) 14.0% (state)

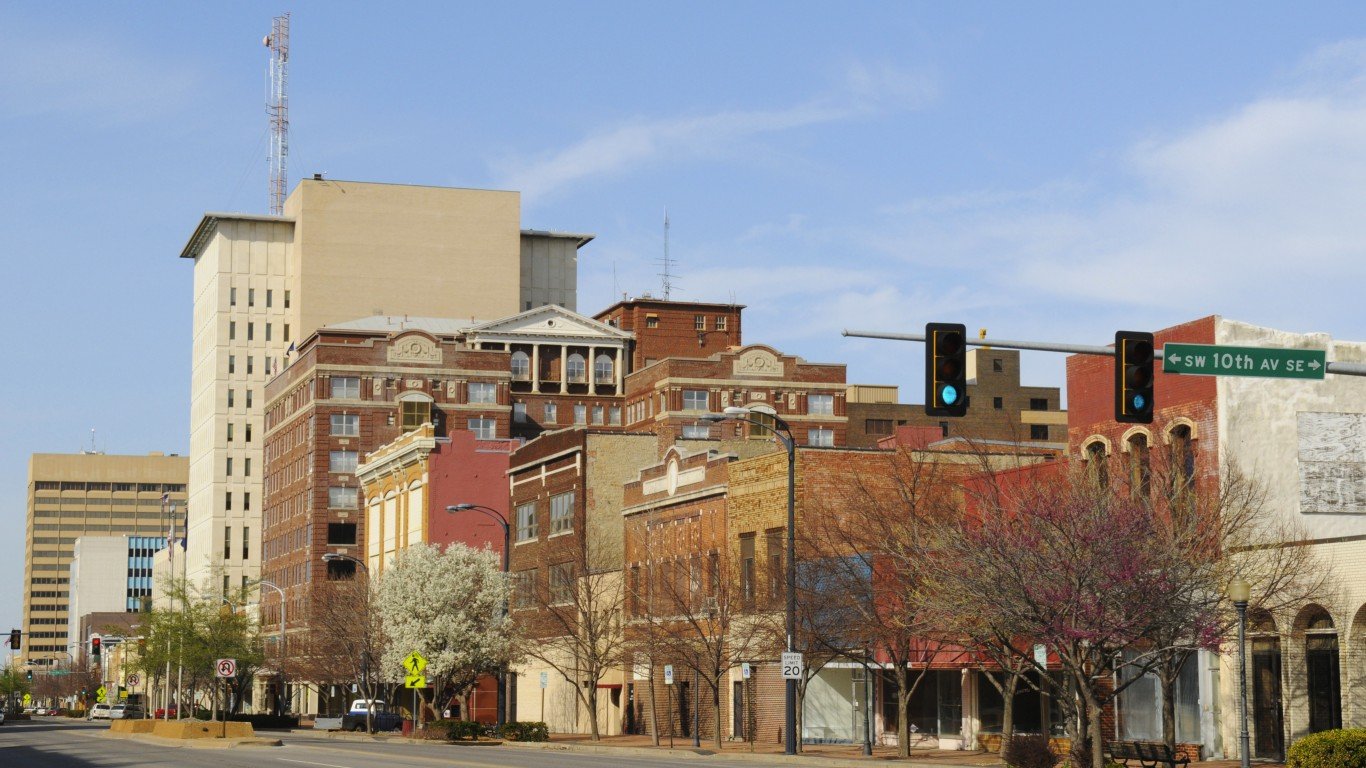
Oklahoma: Enid
> Obesity rate: 37.1% (city) 33.3% (state)
> Adults who do not exercise: 27.7% (city) 28.4% (state)
> Population with access to exercise venues: 61.3% (city) 71.6% (state)
> Adults with diabetes: 10.5% (city) 11.9% (state)
> Adults who report fair or poor health: 19.2% (city) 19.6% (state)
> Poverty rate: 12.1% (city) 15.8% (state)
[in-text-ad]

Oregon: Albany
> Obesity rate: 35.4% (city) 28.3% (state)
> Adults who do not exercise: 20.0% (city) 15.2% (state)
> Population with access to exercise venues: 76.6% (city) 88.3% (state)
> Adults with diabetes: 12.0% (city) 9.3% (state)
> Adults who report fair or poor health: 15.3% (city) 15.8% (state)
> Poverty rate: 14.6% (city) 13.2% (state)
[recirclink id=555791]

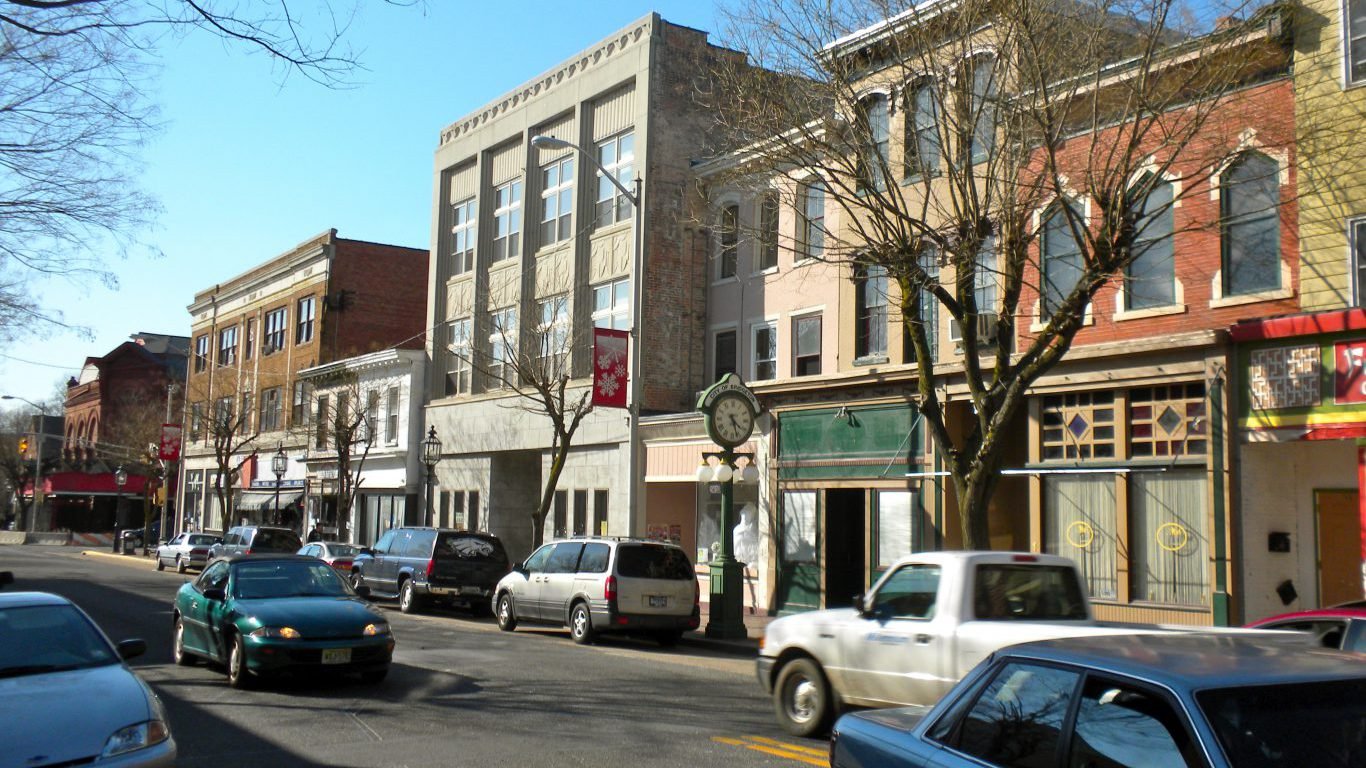
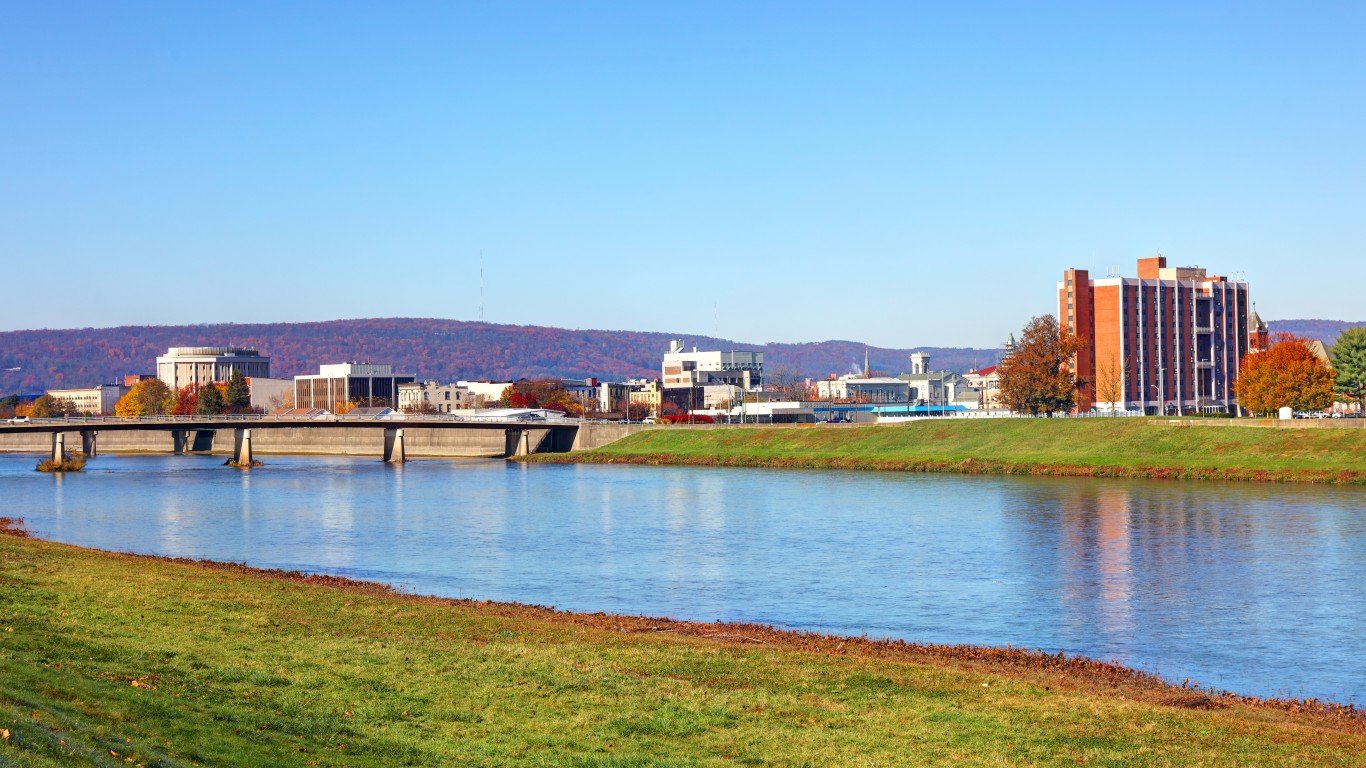
Pennsylvania: Williamsport
> Obesity rate: 37.0% (city) 29.9% (state)
> Adults who do not exercise: 26.8% (city) 22.4% (state)
> Population with access to exercise venues: 54.0% (city) 84.3% (state)
> Adults with diabetes: 11.8% (city) 10.9% (state)
> Adults who report fair or poor health: 15.6% (city) 15.1% (state)
> Poverty rate: 12.2% (city) 12.5% (state)

Rhode Island: Providence-Warwick, RI-MA
> Obesity rate: 27.6% (city) 27.0% (state)
> Adults who do not exercise: 23.6% (city) 23.4% (state)
> Population with access to exercise venues: 93.7% (city) 94.9% (state)
> Adults with diabetes: 10.2% (city) 9.6% (state)
> Adults who report fair or poor health: 14.5% (city) 14.8% (state)
> Poverty rate: 11.4% (city) 11.6% (state)
[in-text-ad-2]
South Carolina: Florence
> Obesity rate: 36.6% (city) 32.4% (state)
> Adults who do not exercise: 29.8% (city) 24.7% (state)
> Population with access to exercise venues: 59.9% (city) 68.7% (state)
> Adults with diabetes: 14.6% (city) 12.6% (state)
> Adults who report fair or poor health: 21.6% (city) 19.1% (state)
> Poverty rate: 19.3% (city) 15.4% (state)

South Dakota: Sioux Falls
> Obesity rate: 31.3% (city) 31.1% (state)
> Adults who do not exercise: 19.1% (city) 19.9% (state)
> Population with access to exercise venues: 83.5% (city) 71.8% (state)
> Adults with diabetes: 8.1% (city) 9.1% (state)
> Adults who report fair or poor health: 10.0% (city) 11.8% (state)
> Poverty rate: 6.8% (city) 13.0% (state)
[in-text-ad]
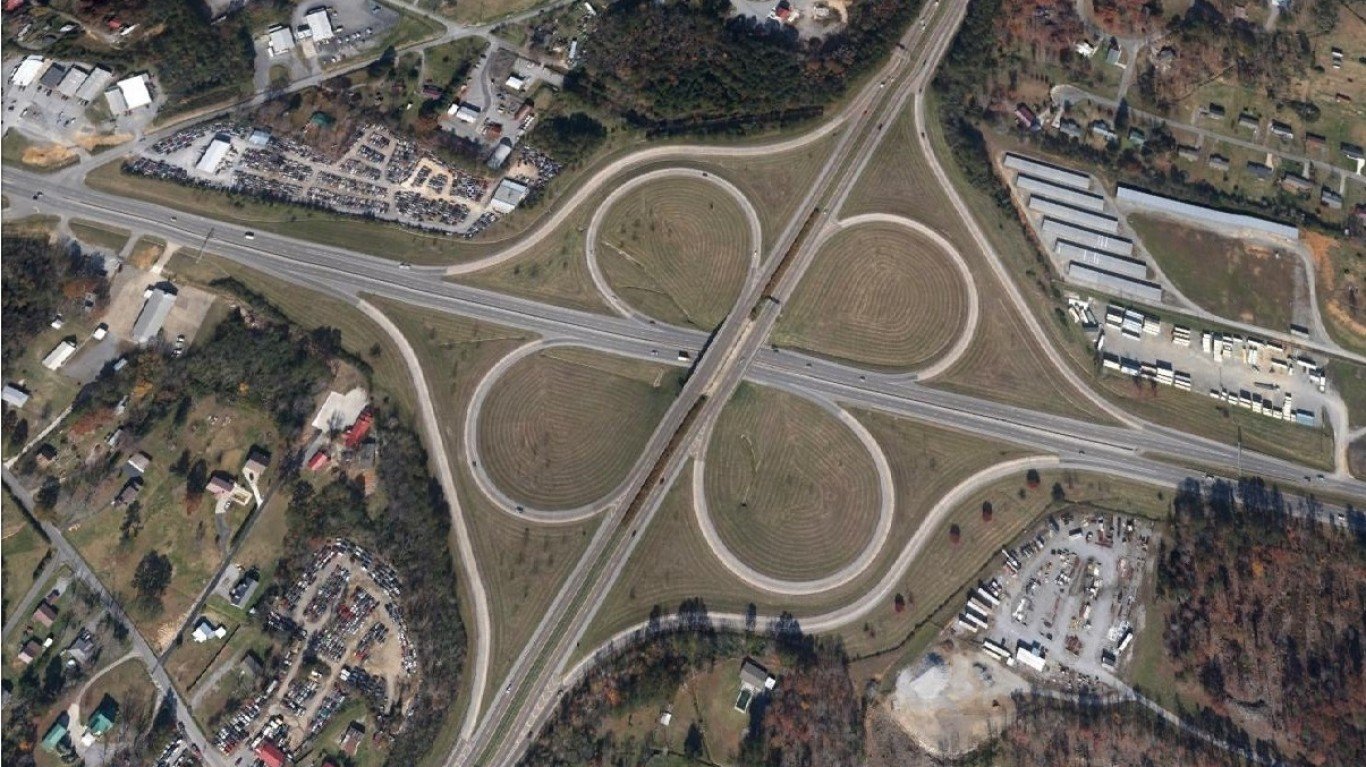
Tennessee: Cleveland
> Obesity rate: 37.4% (city) 33.0% (state)
> Adults who do not exercise: 32.2% (city) 26.7% (state)
> Population with access to exercise venues: 75.5% (city) 70.6% (state)
> Adults with diabetes: 14.9% (city) 12.9% (state)
> Adults who report fair or poor health: 20.8% (city) 19.1% (state)
> Poverty rate: 17.9% (city) 15.0% (state)
[recirclink id=548352]

Texas: Texarkana, TX-AR
> Obesity rate: 37.4% (city) 29.0% (state)
> Adults who do not exercise: 33.0% (city) 22.8% (state)
> Population with access to exercise venues: 51.9% (city) 80.3% (state)
> Adults with diabetes: 12.6% (city) 9.7% (state)
> Adults who report fair or poor health: 20.0% (city) 18.2% (state)
> Poverty rate: 14.9% (city) 14.7% (state)
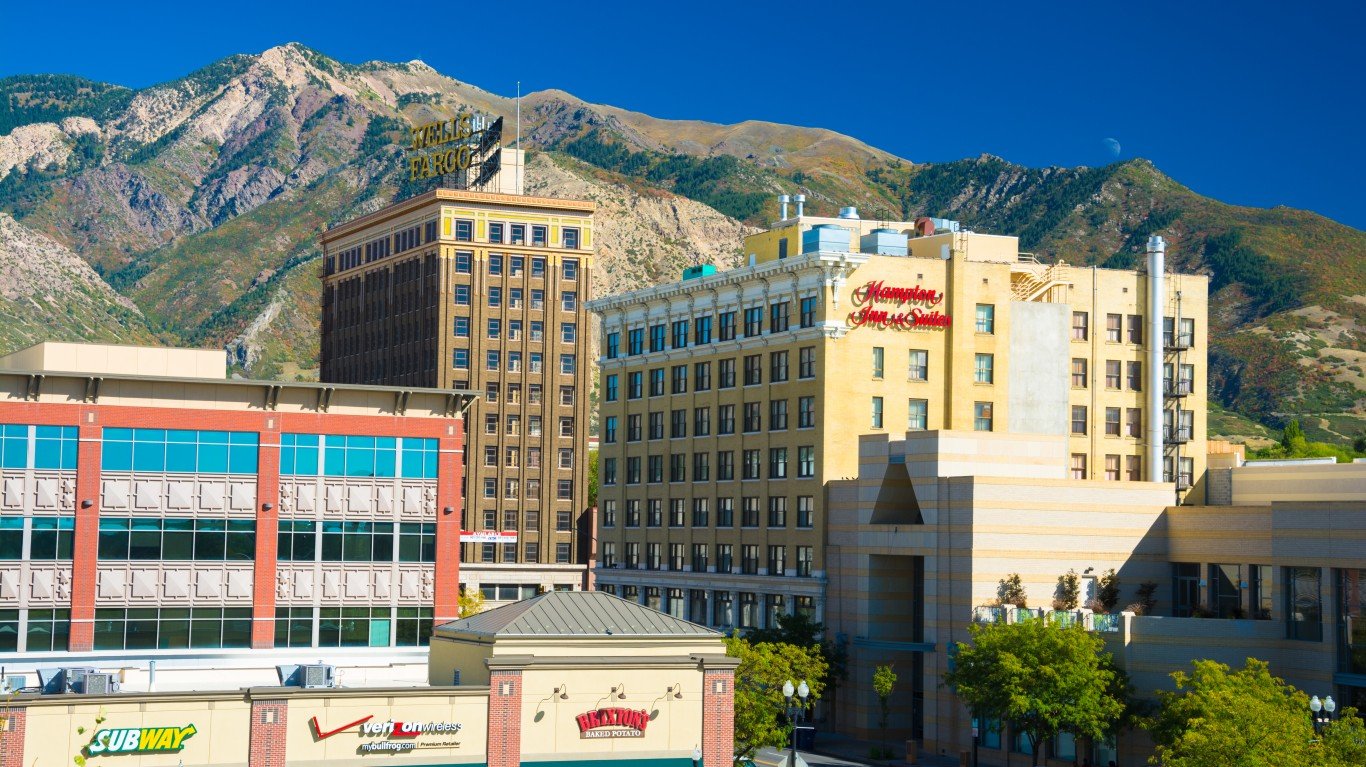
Utah: Ogden-Clearfield
> Obesity rate: 28.2% (city) 25.9% (state)
> Adults who do not exercise: 17.3% (city) 16.1% (state)
> Population with access to exercise venues: 88.3% (city) 85.2% (state)
> Adults with diabetes: 7.7% (city) 7.2% (state)
> Adults who report fair or poor health: 11.9% (city) 12.1% (state)
> Poverty rate: 7.4% (city) 9.7% (state)
[in-text-ad-2]

Vermont: Burlington-South Burlington
> Obesity rate: 22.6% (city) 25.5% (state)
> Adults who do not exercise: 16.4% (city) 18.6% (state)
> Population with access to exercise venues: 78.1% (city) 75.1% (state)
> Adults with diabetes: 6.9% (city) 8.2% (state)
> Adults who report fair or poor health: 10.5% (city) 12.5% (state)
> Poverty rate: 11.3% (city) 11.3% (state)

Virginia: Staunton-Waynesboro
> Obesity rate: 32.5% (city) 28.8% (state)
> Adults who do not exercise: 25.4% (city) 21.6% (state)
> Population with access to exercise venues: 67.0% (city) 82.3% (state)
> Adults with diabetes: 11.8% (city) 10.0% (state)
> Adults who report fair or poor health: 14.8% (city) 15.9% (state)
> Poverty rate: 11.9% (city) 10.6% (state)
[in-text-ad]
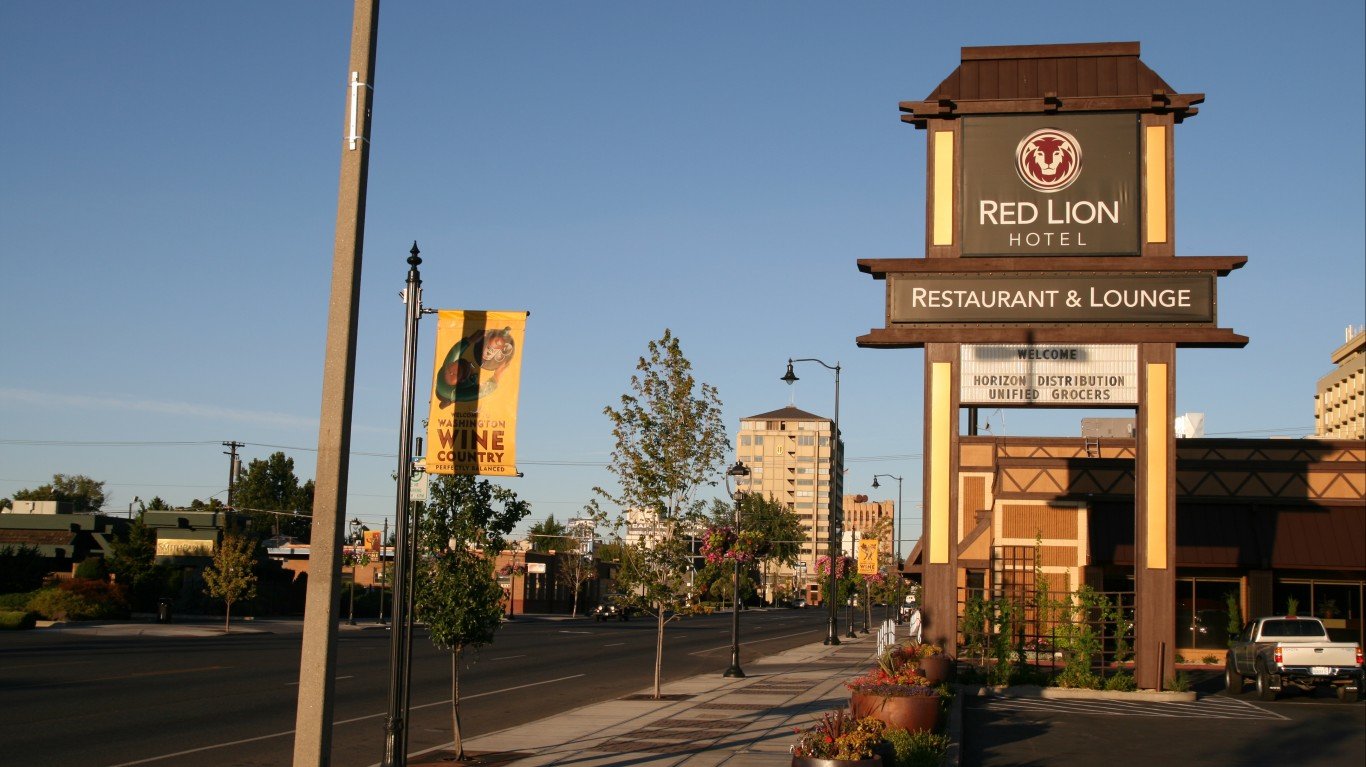
Washington: Yakima
> Obesity rate: 32.1% (city) 27.6% (state)
> Adults who do not exercise: 22.0% (city) 16.4% (state)
> Population with access to exercise venues: 75.3% (city) 86.8% (state)
> Adults with diabetes: 10.3% (city) 8.7% (state)
> Adults who report fair or poor health: 21.2% (city) 13.9% (state)
> Poverty rate: 18.1% (city) 11.0% (state)
[recirclink id=390415]

West Virginia: Beckley
> Obesity rate: 39.3% (city) 36.3% (state)
> Adults who do not exercise: 30.3% (city) 27.8% (state)
> Population with access to exercise venues: 61.9% (city) 60.4% (state)
> Adults with diabetes: 15.6% (city) 14.4% (state)
> Adults who report fair or poor health: 25.2% (city) 24.1% (state)
> Poverty rate: 20.0% (city) 19.1% (state)
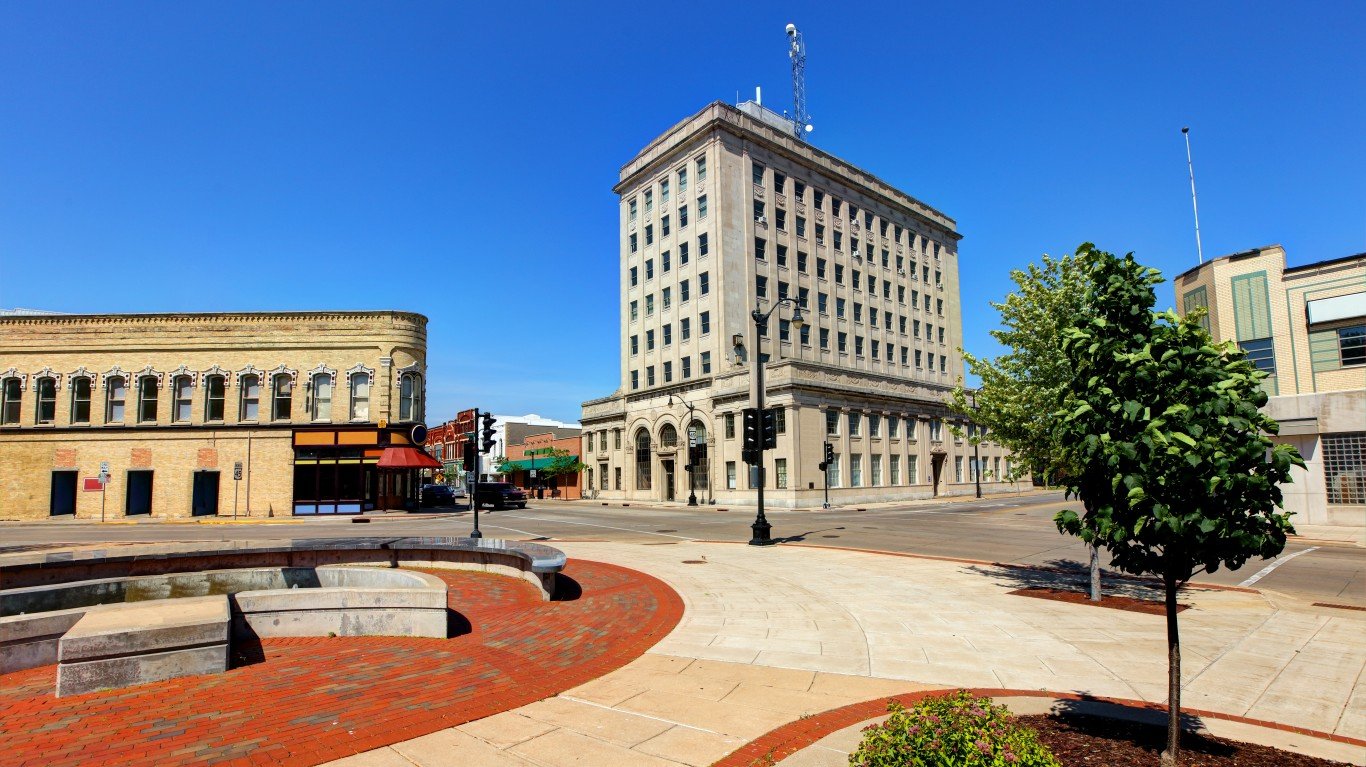
Wisconsin: Oshkosh-Neenah
> Obesity rate: 37.0% (city) 31.1% (state)
> Adults who do not exercise: 17.8% (city) 19.5% (state)
> Population with access to exercise venues: 91.8% (city) 85.6% (state)
> Adults with diabetes: 9.2% (city) 9.2% (state)
> Adults who report fair or poor health: 12.0% (city) 15.4% (state)
> Poverty rate: 12.1% (city) 11.3% (state)
[in-text-ad-2]
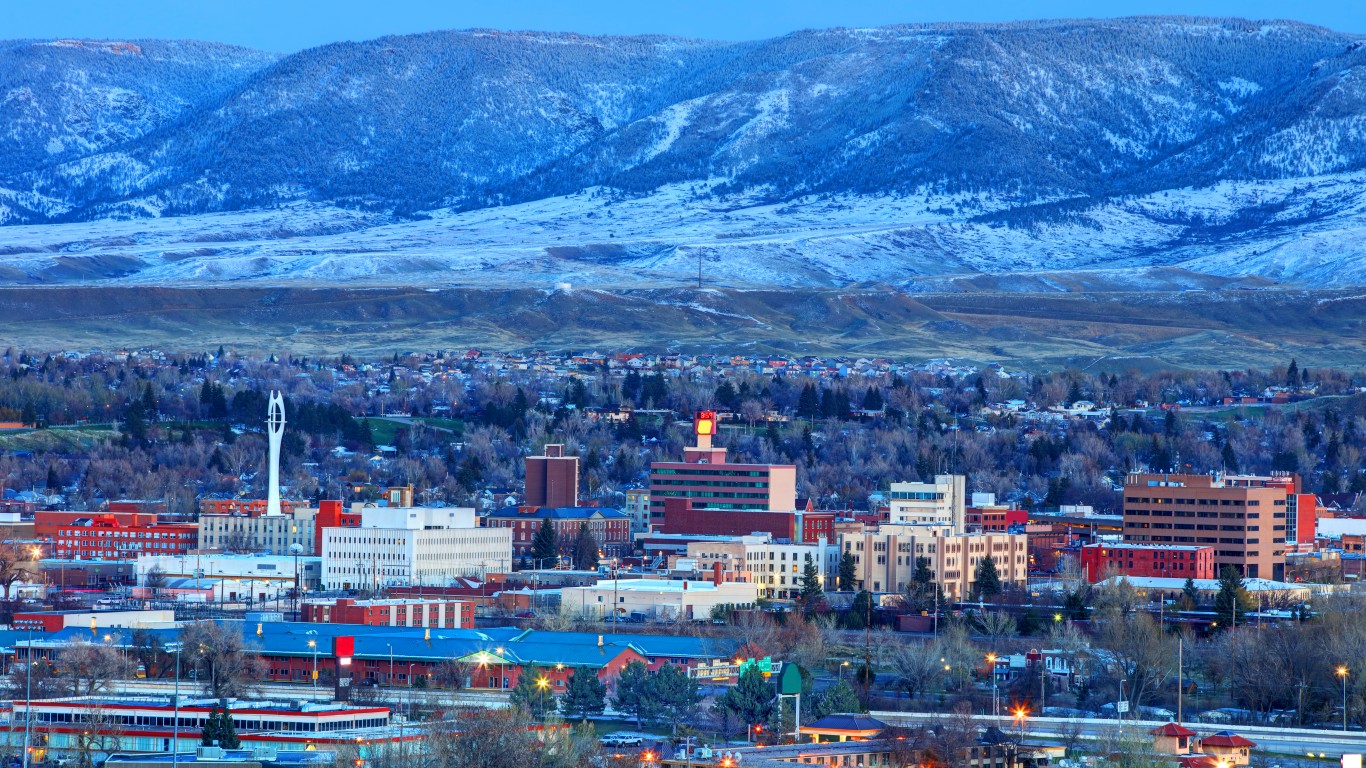
Wyoming: Casper
> Obesity rate: 31.5% (city) 28.5% (state)
> Adults who do not exercise: 24.5% (city) 23.1% (state)
> Population with access to exercise venues: 86.8% (city) 76.1% (state)
> Adults with diabetes: 8.2% (city) 8.5% (state)
> Adults who report fair or poor health: 14.9% (city) 15.1% (state)
> Poverty rate: 10.9% (city) 11.3% (state)
Methodology
To determine the most obese city in every state, 24/7 Wall St. analyzed county-level data from the Robert Wood Johnson Foundation and the University of Wisconsin Population Health Institute joint program’s 2019 County Health Rankings & Roadmaps report (CHR). We aggregated county-level statistics to metropolitan statistical areas (MSA). Adult obesity is identified in the CDC’s Behavioral Risk Factor Surveillance System (BRFSS) as having a Body Mass Index (BMI) of 30kg/m2 or greater for adults 20 years and over.
The percentage of the adult population that does not have access to exercise venues, the percentage of BRFSS respondents who report fair or poor health, and the percentage of the adult population (20 years and over) diagnosed with diabetes also came from the CHR aggregation. Access to exercise venues is defined as has access to local, state, and national parks, as well as public or private facilities equipped to meet demands for a wide variety of physical exercise, such as pools, gyms, and rehearsal space. All CHR data is for the most recent year available.
The poverty rate and median household income listed for metro areas and states came from the U.S. Census Bureau’s 2017 American Community Survey and are one-year estimates.
The obesity rates in the cities identified for Vermont, Mississippi, and Alaska are lower than the state-wide rate. This is possible in states with relatively few metro areas, and where obesity is relatively common in counties outside a state’s metro areas.
Contact [email protected] for any questions or corrections.