
[cnxvideo id=”899991″ placement=”ros”]
Since the end of the Great Recession in 2009, the U.S. economy has entered an era of unprecedented growth. Overall employment has climbed for a record 109 consecutive months through October 2019, and the national unemployment rate hit 3.5% in September 2019, the lowest level since the 1960s.
For the majority of communities across the United States, an improving job market has been the dominant narrative for some time now. Here is a list of the 50 cities adding the most jobs in each state.
Still, in some U.S. cities, such growth and prosperity has been elusive. In these cities, job growth has been sluggish or non-existent in recent years, and unemployment is far more common than it is nationwide.
There are 128 U.S. metropolitan areas where overall employment has climbed at half the pace or slower of the comparable national job growth rate of 14.4% between 2010 in 2018. In 26 of these metro areas, the unemployment rate is 5% or higher. 24/7 Wall St. reviewed sector-level employment change with data from the Bureau of Labor Statistics to determine why it has gotten harder to find a job in these cities.
It is important to note that the cities on this list are not necessarily those with the highest unemployment rates. Nationwide, there are 10 cities with unemployment rates higher than those on this list. However, they have also reported employment growth close to or higher than the national rate. The cities with the highest jobless rates also tend to be heavily dependent on the agricultural sector, which can skew unemployment measurements because work is often seasonal.
In contrast, the cities on this list have both high unemployment and weak job growth. In fact, the majority of cities on this list have reported a decline in overall employment since the end of the recession. Some have even reported near nation-leading employment declines in recent years. Here is a look at the 25 American cities losing the most jobs.
Click here to see why it’s so hard to find a job in these cities
Click here to read our methodology

26. Flint, MI
> Sept. 2019 unemployment: 5.0%
> 2010-2018 total employment change: +7,800 (+5.9%)
> Industry with the largest 8-yr. job decline: Government (-3,800 jobs)
> Poverty rate: 18.8%
Most cities on this list have reported a decline in overall employment since 2010 — around the end of the Great Recession. With about 7,800 more people working in the city today than nine years ago, Flint is an exception. Still, the metro area’s 5.9% overall job growth is well behind the national 14.4% job growth over the same period. Since 2010, the government, financial activities, and other services sectors each shed hundreds or thousands of jobs in Flint.
As of September, Flint’s unemployment rate was 5.0%, well above the 3.5% national jobless rate. As is often the case in cities with weak job markets, there is a large poor population in Flint. The metro area’s poverty rate of 18.8% is well above the 13.1% national rate.
[in-text-ad]

25. East Stroudsburg, PA
> Sept. 2019 unemployment: 5.0%
> 2010-2018 total employment change: +400 (+0.7%)
> Industry with the largest 8-yr. job decline: Government (-2,600 jobs)
> Poverty rate: 12.3%
Since 2010, overall employment in the East Stroudsburg metropolitan area climbed by just 0.7%, compared to the national employment growth rate of 14.4% over the same period. Substantial employment declines in the government and manufacturing sectors — which today account for 19.1% and 8.3% of total employment, respectively — have presented a considerable drag on overall employment growth in the metro area.
Despite the weak job market, the median household income in East Stroudsburg of $64,170 is slightly higher than the national median of $61,937. Still, many metro area residents are struggling, and likely due in part to the area’s higher than average unemployment rate of 5.0%, are more likely to rely on government assistance to afford food. Some 13.7% of the metro area population relies on SNAP benefits, formerly known as food stamps, a higher recipiency rate than the 11.3% national rate.
[recirclink id=573145]

24. Vineland-Bridgeton, NJ
> Sept. 2019 unemployment: 5.0%
> 2010-2018 total employment change: +100 (+0.2%)
> Industry with the largest 8-yr. job decline: Government (-3,400 jobs)
> Poverty rate: 14.6%
Vineland-Bridgeton is one of two New Jersey metro areas to rank on this list. As of September, 5.0% of the metro area workforce was out of job, well above the national unemployment rate of 3.5% that month. The area’s high unemployment is due in part to weak jobs growth in recent years. The number of people working in the city has remained effectively unchanged since the end of the Great Recession. For context, overall employment climbed by 14.4% nationwide over the same period.
The government and financial activities sectors have been the biggest drags on the metro area job market, shedding 3,400 and 500 jobs, respectively, between 2010 and 2018.

23. Huntington-Ashland, WV-KY-OH
> Sept. 2019 unemployment: 5.0%
> 2010-2018 total employment change: -2,300 (-1.7%)
> Industry with the largest 8-yr. job decline: Trade, transportation, and utilities (-2,200 jobs)
> Poverty rate: 18.2%
The number of people living in the Huntington-Ashland metro area climbed by 22.7% since 2010. Job growth, however, has not been commensurate with population growth in the area. There are now 2,300 fewer people working in Huntington-Ashland than there were in 2010, a 1.7% decline in overall employment. The sectors losing the most jobs over that period were the trade, transportation, and utilities sector as well as the mining, logging and construction sector, which shed 7.6% and 21% of their workforces, respectively.
The Huntington-Ashland economy is heavily dependent on coal mining, which has been on the decline in the area in recent years. The weak job market may partially explain why the metro area’s high poverty rate – at 18.2% — is well above the nationwide poverty rate of 13.1%.
[in-text-ad-2]

22. Parkersburg-Vienna, WV
> Sept. 2019 unemployment: 5.0%
> 2010-2018 total employment change: -2,400 (-5.9%)
> Industry with the largest 8-yr. job decline: Education and health services (-1,200 jobs)
> Poverty rate: 15.2%
There were 2,400 fewer people working in the Parkersburg-Vienna metro area in 2018 than there were in 2010. Job losses were largest in the education and health services and manufacturing sectors — which shed 15.4% and 20.6% of their workforces over that period, respectively.
Employment changes in education and health services tend to track population changes, and between 2010 and 2018, the number of people living in the metro area fell by a staggering 43.2%. As of September, 5.0% of the labor force in Parkersburg-Vienna was unemployed, well above the 3.5% national unemployment rate.
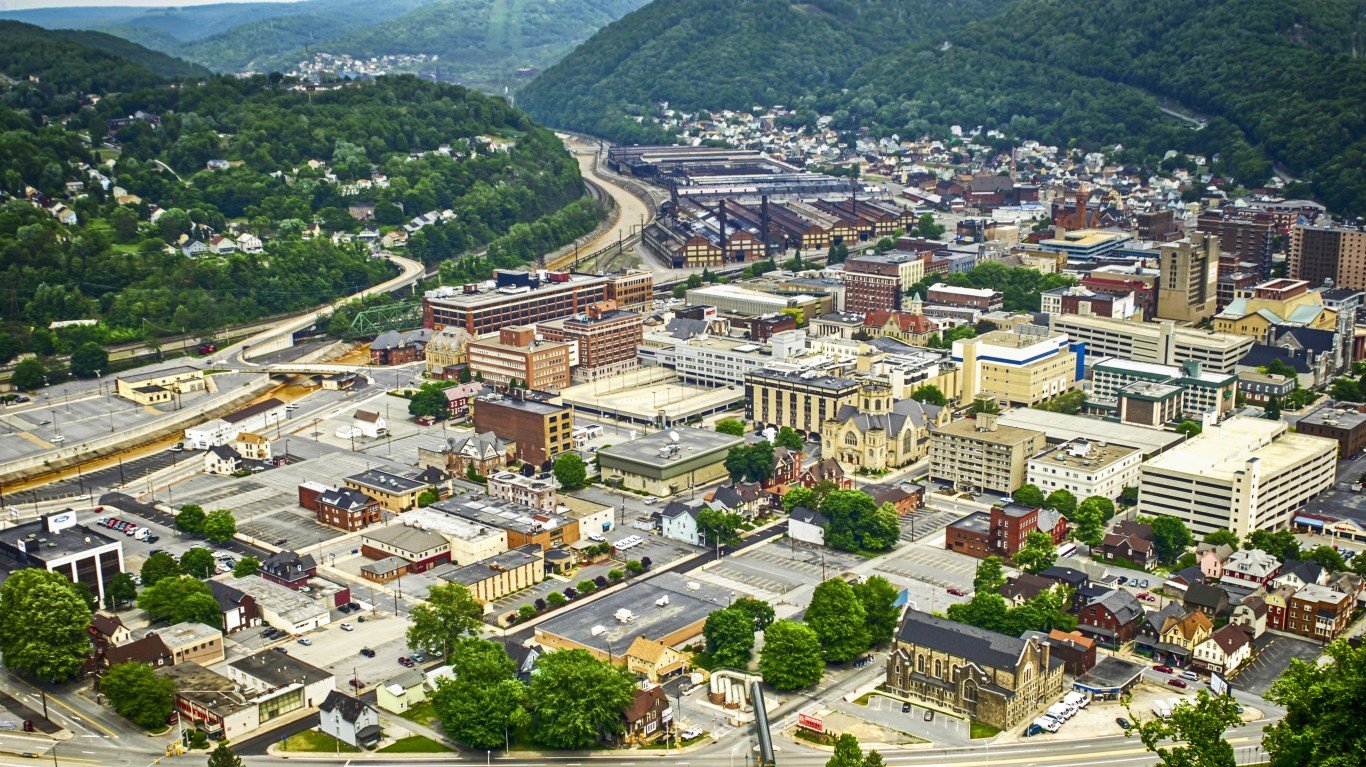
21. Johnstown, PA
> Sept. 2019 unemployment: 5.0%
> 2010-2018 total employment change: -5,200 (-8.7%)
> Industry with the largest 8-yr. job decline: Government (-1,800 jobs)
> Poverty rate: 14.8%
Both of the metro areas on this list that are located entirely in Pennsylvania have unemployment rates of 5.0%. Johnstown, however, has shed 5,200 jobs in the last eight years, while East Straudsburg, the other Pennsylvania metro area, added 400 jobs. There were 1,800 fewer people working in the government sector in Johnstown in 2018 compared to 2010, 1,000 fewer people working in the professional and business services sector, and 900 fewer working in education and health services.
The area’s weak job market has contributed to greater financial hardship among residents and budget shortfalls for municipal governments. The metro area has a higher than average 14.8% poverty rate, and the city of Johnstown has been considered “distressed” by the state government since 1992 and has a pension shortfall of about $22 million and over $10 million in general debt.
[in-text-ad]

20. Hammond, LA
> Sept. 2019 unemployment: 5.1%
> 2010-2018 total employment change: +2,700 (+6.3%)
> Industry with the largest 8-yr. job decline: N/A
> Poverty rate: 16.3%
Unlike most metro areas on this list, there were more people working in Hammond, Louisiana, in 2018 than in 2010. Still, the metro area’s 6.3% employment growth over that period is well under half the national employment growth of 14.4% over the same period. Additionally, the metro area’s 5.1% September jobless rate is far higher than the comparable national unemployment rate of 3.5%.
According to projections compiled by an economist and researcher at Louisiana State University, the metro area’s job market conditions are not likely to improve anytime soon. Hammond is projected to add just 100 jobs annually in each of the next two years.
[recirclink id=509981]

19. Decatur, IL
> Sept. 2019 unemployment: 5.1%
> 2010-2018 total employment change: -500 (-1.0%)
> Industry with the largest 8-yr. job decline: Professional and business services (-900 jobs)
> Poverty rate: 18.0%
Decatur is one of three Illinois metro areas on this list. Driven largely by employment declines in the professional and business services and government sectors, there are about 500 fewer jobs in the metro area today than there were in 2010. The metro area’s September unemployment rate of 5.1% is higher than the comparable 3.5% national rate.
Like many other cities with high unemployment and sluggish job growth, Decatur has reported near nation-leading population decline in recent years. The number of people living in the metro area declined by 5.4% between 2010 and 2018. Over the same period, the U.S. population climbed by 5.8%.

18. Danville, IL
> Sept. 2019 unemployment: 5.1%
> 2010-2018 total employment change: -1,400 (-4.8%)
> Industry with the largest 8-yr. job decline: Education and health services (-600 jobs)
> Poverty rate: 19.8%
There were 1,400 fewer people working in Danville in 2018 than there were in 2010. Like many other metro areas on this list, Danville is one of the poorest places in the country. About one in every five metro area residents live below the poverty line, a far larger share than the 13.1% national poverty rate.
Employment changes in the government and education and health services sectors tend to track closely with population changes. In Danville, education and health services and government shed more jobs than any other sector, at 600 and 300, respectively. The metro area’s mining, logging and construction sector also shed 200 jobs between 2010 and 2018.
[in-text-ad-2]

17. Pine Bluff, AR
> Sept. 2019 unemployment: 5.1%
> 2010-2018 total employment change: -3,900 (-10.5%)
> Industry with the largest 8-yr. job decline: Government (-1,700 jobs)
> Poverty rate: 21.1%
Pine Bluff is the only metro area in Arkansas on this list. The metro area shed 3,900 jobs between 2010 and 2018, or 10.5% of its total workforce. The government sector was the biggest drag on the metro area job market, with 1,700 fewer employed workers in 2018 than in 2010. As of September, 5.1% of the labor force in Pine Bluff were unemployed, well above the 3.5% national unemployment rate.
As is often the case in areas with high unemployment, Pine Bluff is a relatively poor city. Of the 90,300 people who call Pine Bluff home, 21.1% live below the poverty line. For reference, the national poverty rate is 13.1%.
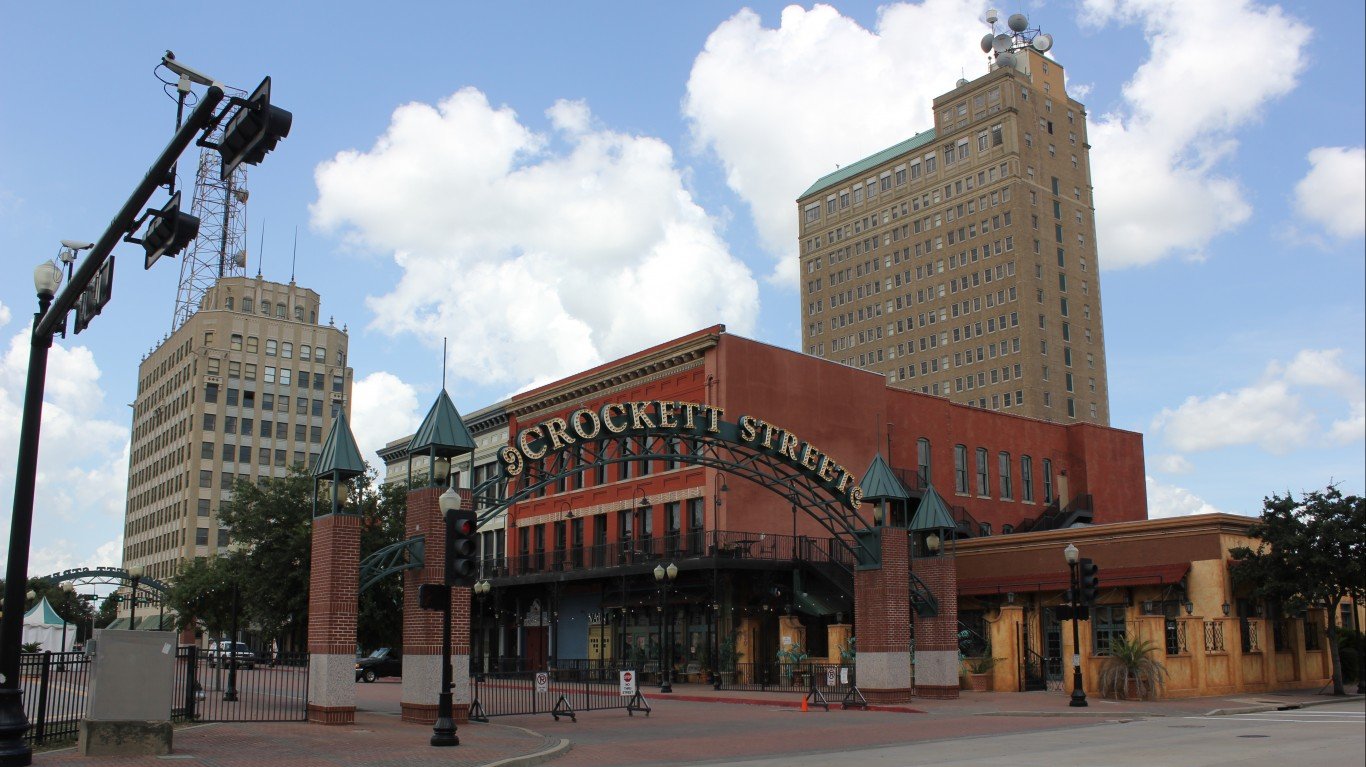
16. Beaumont-Port Arthur, TX
> Sept. 2019 unemployment: 5.3%
> 2010-2018 total employment change: +5,100 (+3.2%)
> Industry with the largest 8-yr. job decline: Government (-2,600 jobs)
> Poverty rate: 16.5%
Since the end of the Great Recession, the number of people living in the Beaumont-Port Arthur metro area climbed by 5.4%. Job growth did not keep pace. Over the same period, total employment in the Texas metro area climbed by just 3.2%. Currently, the metro area’s 5.3% unemployment rate is well above the 3.5% national average.
Between 2010 and 2018, the largest drags on the Beaumont-Port Arthur job market have been the government, education and health services, and information sectors — which shed 2,600, 1,800, and 500 jobs, respectively.
[in-text-ad]
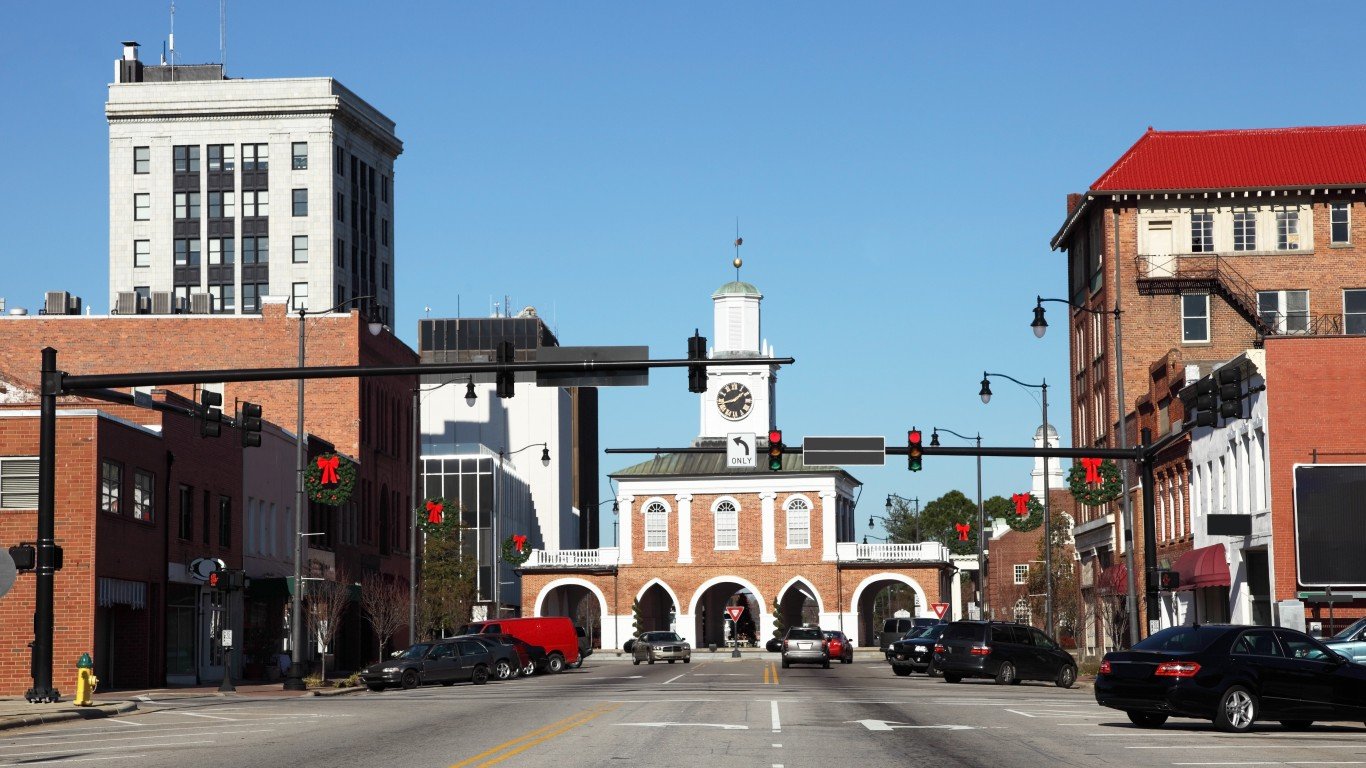
15. Fayetteville, NC
> Sept. 2019 unemployment: 5.3%
> 2010-2018 total employment change: +2,400 (+1.9%)
> Industry with the largest 8-yr. job decline: Professional and business services (-1,800 jobs)
> Poverty rate: 17.4%
Fayetteville is one of two North Carolina metro areas to rank on this list. Since 2010, the number of people living in Fayetteville climbed by 5.3%. Job growth did not keep pace. Over the same period, total employment in the Texas metro area climbed by just 1.9%. For reference, total employment has increased by 14.4% nationwide since 2010.
The metro area’s job market was held back by the professional and business services, manufacturing, and financial activities sectors, each of which shed a substantial number of jobs. Currently, Fayetteville’s 5.3% unemployment rate is well above the 3.5% national average.
[recirclink id=569954]

14. Gulfport-Biloxi-Pascagoula, MS
> Sept. 2019 unemployment: 5.4%
> 2010-2018 total employment change: -600 (-0.4%)
> Industry with the largest 8-yr. job decline: Manufacturing (-3,200 jobs)
> Poverty rate: 19.7%
Thanks largely to a major contraction in employment in the manufacturing sector, there are about 600 fewer people working in the Gulfport-Biloxi-Pascagoula, Mississippi, metro area than there were in 2010. The metro area’s professional and business services sector and its mining, logging, and construction sector also shed thousands of jobs since the end of the Great Recession.
A healthier job market would likely go a long way to alleviate financial hardship for many metro area residents. The metro area’s poverty rate of 19.7% is well above the 13.1% national rate and among the highest in the country.
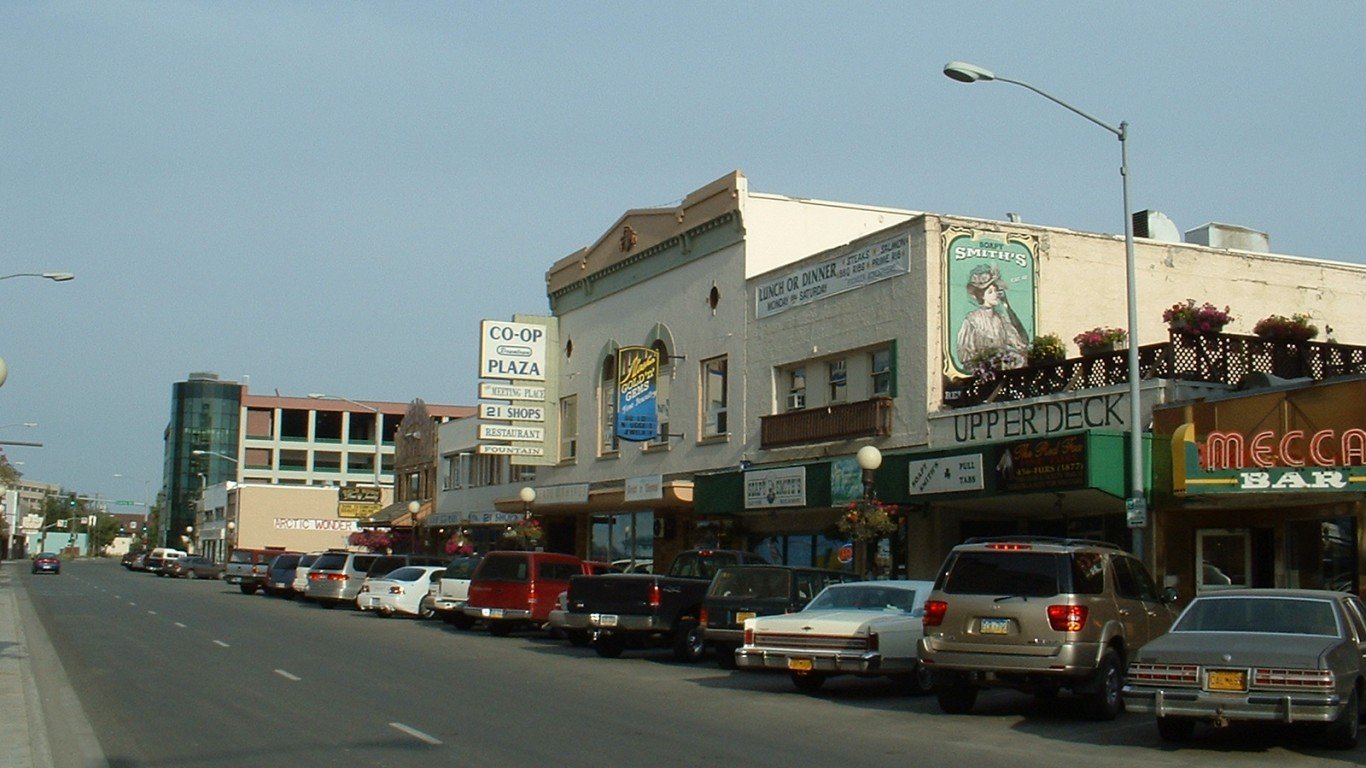
13. Fairbanks, AK
> Sept. 2019 unemployment: 5.4%
> 2010-2018 total employment change: -1,300 (-3.4%)
> Industry with the largest 8-yr. job decline: Government (-1,800 jobs)
> Poverty rate: 8.1%
The number of people living in Fairbanks, Alaska, climbed slightly — by 0.7% — between 2010 and 2018. Despite the marginal population growth, overall employment actually fell in the metro area over the same period, by 3.4%. Employment declines were heaviest in the government sector, mining, logging, and construction sector, and financial activities sector. As of September, 5.4% of the labor force in the metro area was unemployed, compared to the national unemployment rate of 3.5%.
Despite the weak job market, relatively few Fairbanks residents are facing serious financial hardship. The metro area’s poverty rate of 8.1% is among the lowest in the country and well below the 13.1% national poverty rate.
[in-text-ad-2]
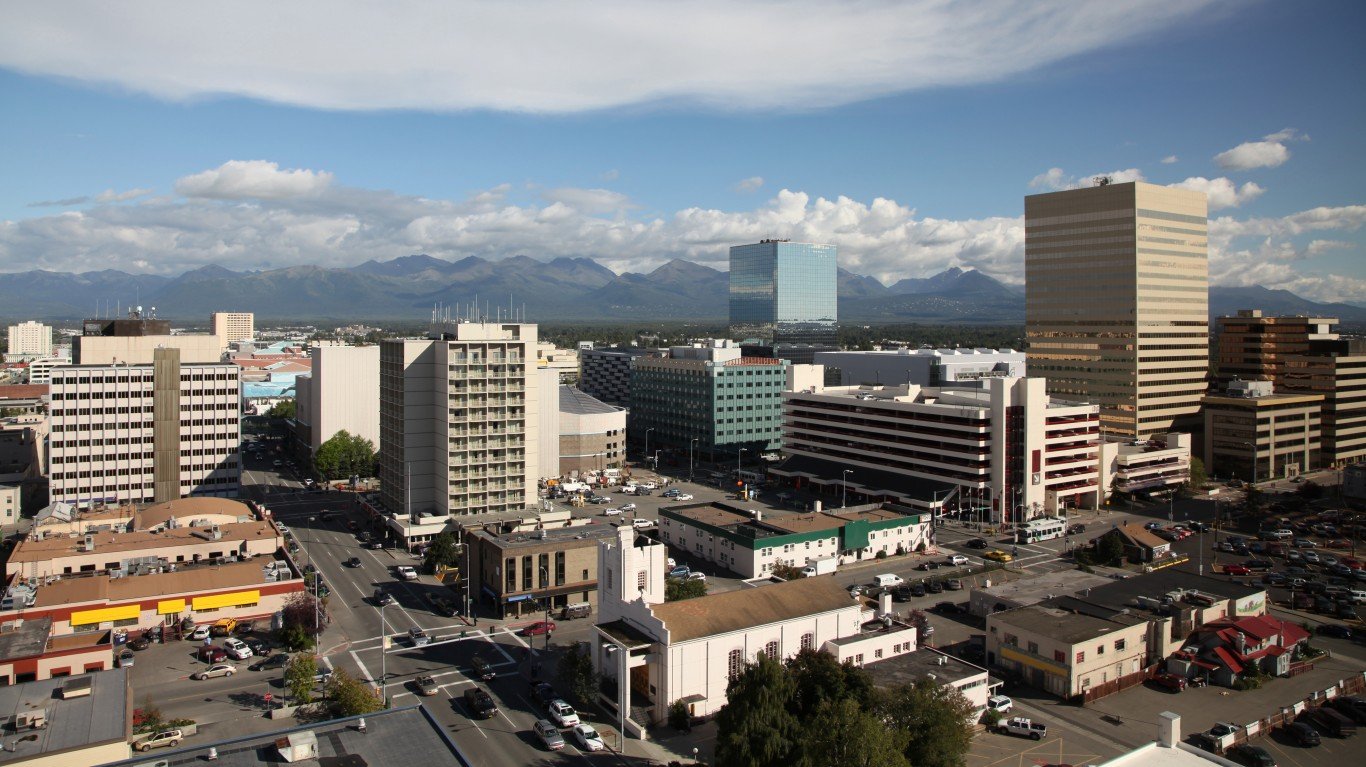
12. Anchorage, AK
> Sept. 2019 unemployment: 5.5%
> 2010-2018 total employment change: +3,900 (+2.3%)
> Industry with the largest 8-yr. job decline: Government (-2,200 jobs)
> Poverty rate: 9.6%
Unemployment in Anchorage stands at 5.5%, slightly higher than the 5.4% unemployment rate in Fairbanks, the other Alaskan metro area on this list. Unlike Fairbanks, however, Anchorage added jobs between 2010 and 2018. There are now 3,900 more people working in the metro area than there were in 2010. Still, the 2.3% employment increase was below the metro area’s 4.2% population growth over the same period, and well below the increase in employment of 14.4% nationwide. Lackluster job growth may also partially explain why the metro area’s 5.5% unemployment rate is so far above the national rate of 3.5%.
The sluggish job growth was partially the result of several industries shedding jobs, including government and professional and business services, each of which reported total employment declines of over 1,000.

11. Walla Walla, WA
> Sept. 2019 unemployment: 5.5%
> 2010-2018 total employment change: +1,500 (+5.7%)
> Industry with the largest 8-yr. job decline: Information (-100 jobs)
> Poverty rate: 12.5%
Walla Walla is the only city in Washington on this list. Unlike most other metro areas on this list, there are more people working in Walla Walla today than there were in 2018. However, the 5.7% employment growth in the city between 2010 and 2018 is well below the 14.4% national employment growth rate.
Stronger job growth would likely reduce Walla Walla’s unemployment rate. As of September, 5.5% of workers in the state were out of a job, far more than the 3.5% national unemployment rate. Lackluster employment growth is partially attributable to weak performance in the information and financial activities sectors, each of which reported a contraction in overall employment between 2010 and 2018.
[in-text-ad]

10. Farmington, NM
> Sept. 2019 unemployment: 5.5%
> 2010-2018 total employment change: -400 (-0.8%)
> Industry with the largest 8-yr. job decline: Government (-200 jobs)
> Poverty rate: 24.4%
The number of people working in Farmington, New Mexico, declined slightly between 2010 and 2018. Additionally, the metro area’s monthly unemployment rate of 5.5% is far higher than the comparable 3.5% national rate.
Partially due to a weak job market, Farmington is one of the poorest metro areas in the United States. Nearly one in every four Farmington residents live below the poverty line, nearly the highest poverty rate among U.S. metro areas and well above the 13.1% national rate.
[recirclink id=525681]

9. Watertown-Fort Drum, NY
> Sept. 2019 unemployment: 5.5%
> 2010-2018 total employment change: -900 (-2.1%)
> Industry with the largest 8-yr. job decline: Trade, transportation, and utilities (-1,100 jobs)
> Poverty rate: 11.8%
Watertown-Fort Drum, located in northern New York state along the eastern shore of Lake Ontario, is one of fewer than 40 U.S. metro areas to report a decline in overall employment since the end of the Great Recession. There were about 900 fewer people working in the metro area in 2018 than there were in 2010. The metro area’s mining, logging, and construction and government sectors each shed hundreds of jobs, and employment in the trade, transportation, and utilities sector contracted by over 1,000 jobs.
The long-term reduction in jobs in these sectors may partially explain why unemployment is high in Watertown-Fort Drum. As of September, 5.5% of the metro area labor force was out of a job, well above the comparable 3.5% national unemployment rate.

8. Rocky Mount, NC
> Sept. 2019 unemployment: 5.5%
> 2010-2018 total employment change: -3,000 (-5.1%)
> Industry with the largest 8-yr. job decline: Professional and business services (-700 jobs)
> Poverty rate: 14.5%
The number of people working in the Rocky Mount, North Carolin,a metro area declined by 3,000 between 2010 and 2018. The metro area’s professional and business services sector shed 700 jobs over that period, as did the education and health services sector. The government sector also shed hundreds of jobs.
Employment changes in government and education and health services tend to track closely with population changes, and the employment decline in those industries may be due in part due to population decline. There were about 146,000 people living in the metro area in 2018, down from about 152,500 in 2010.
[in-text-ad-2]
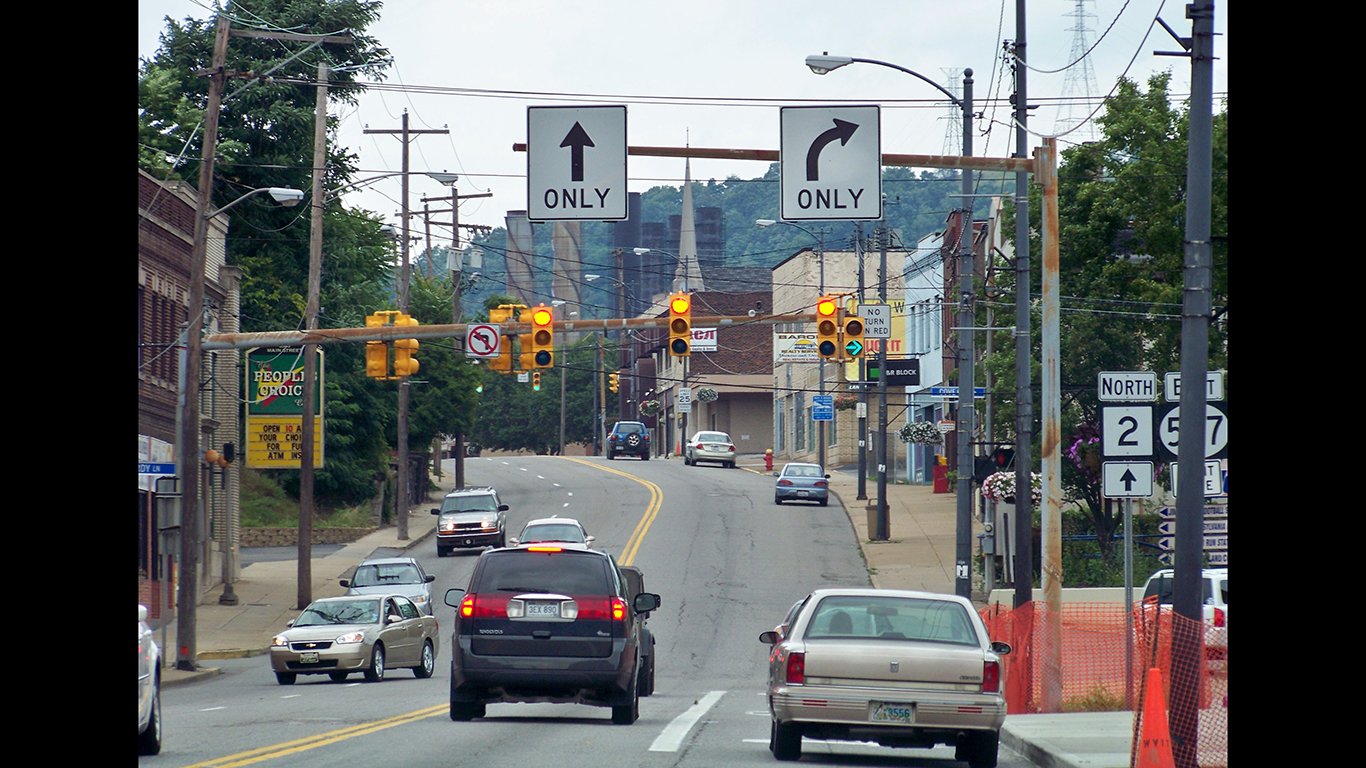
7. Weirton-Steubenville, WV-OH
> Sept. 2019 unemployment: 5.5%
> 2010-2018 total employment change: -3,800 (-8.6%)
> Industry with the largest 8-yr. job decline: Manufacturing (-1,000 jobs)
> Poverty rate: 17.2%
Unemployment in the Weirton-Steubenville metro area was 5.5% as of September 2018, one of the higher jobless rates among metro areas and well above the 3.5% national rate. The metro area is one of many in the region to report substantial declines in the manufacturing sector. Since 2010, overall employment in manufacturing in the metro area fell by 15.6% — or about 1,000 jobs. The trade, transportation, and utilities sector, as well as the leisure and hospitality sector also each shed hundreds of jobs between 2010 and 2018.
As is often the case in areas with employment declines and high jobless rates, Weirton-Steubenville is a low-income area. The poverty rate in the metro area of 17.2% is well above the 13.1% national poverty rate.
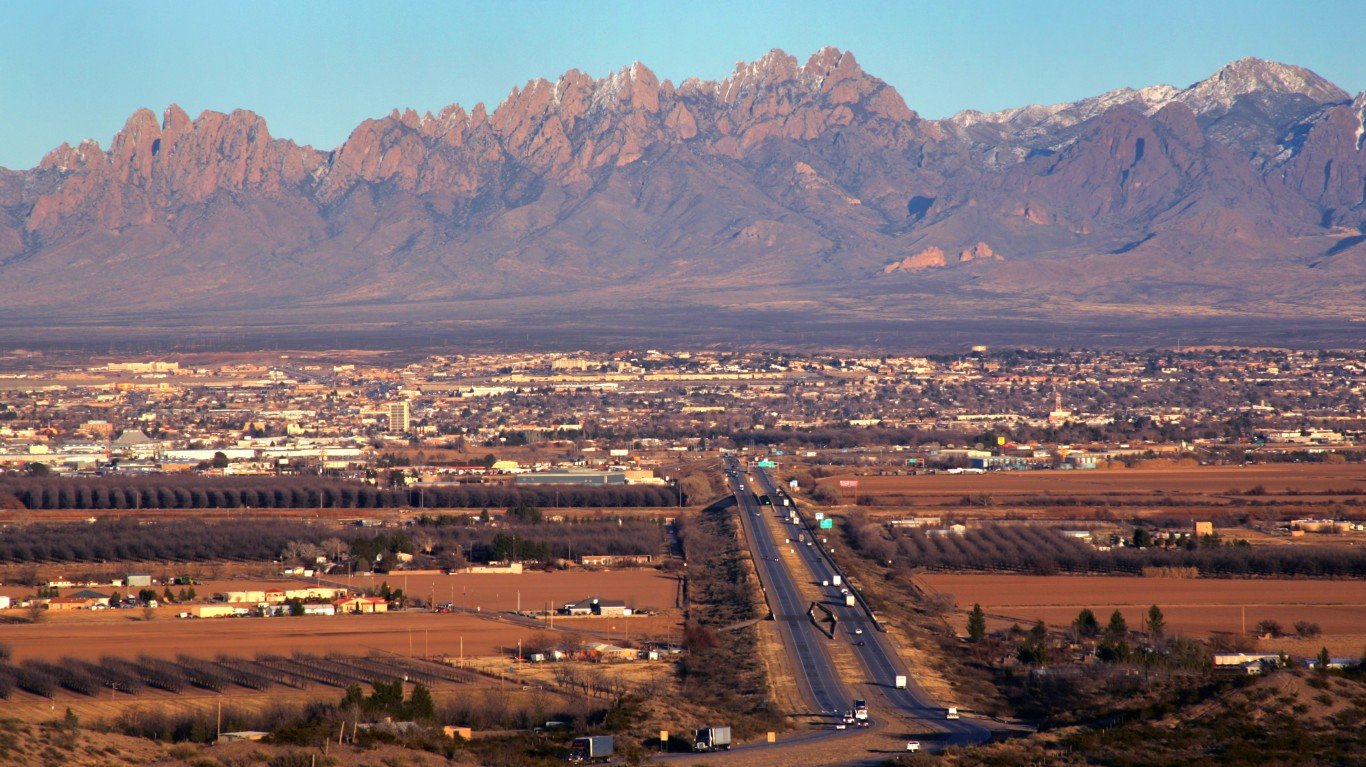
6. Las Cruces, NM
> Sept. 2019 unemployment: 5.6%
> 2010-2018 total employment change: +3,800 (+5.5%)
> Industry with the largest 8-yr. job decline: Government (-2,200 jobs)
> Poverty rate: 25.9%
Unlike most metro areas on this list, Las Cruces, New Mexico, reported a net employment increase between 2010 and 2018. There are 3,800 more people working in the metro area now than there were around the time of the end of the Great Recession. The 5.5% uptick in overall employment outpaced the metro area’s 3.3% population growth over the same period.
Still, job growth was far slower than average. Nationwide, employment climbed by 14.4% between 2010 and 2018. Several sectors in the metro area, including manufacturing and information, each shed hundreds of jobs between 2010 and 2018. In the government sector, employment fell by about 2,200 jobs.
[in-text-ad]

5. Cumberland, MD-WV
> Sept. 2019 unemployment: 5.6%
> 2010-2018 total employment change: -700 (-1.8%)
> Industry with the largest 8-yr. job decline: Government (-900 jobs)
> Poverty rate: 16.2%
Like most metro areas on this list, Cumberland reported a declining population between 2010 and 2018 — the number of people living in the metro area fell by 5.2%. Over the same period, due in large part to a contraction in the government sector, overall employment fell by 1.8%. Monthly unemployment in the metro area stands at 5.6% — far higher than the 3.5% national unemployment rate.
[recirclink id=510068]

4. Youngstown-Warren-Boardman, OH-PA
> Sept. 2019 unemployment: 5.7%
> 2010-2018 total employment change: -300 (-0.1%)
> Industry with the largest 8-yr. job decline: Financial activities (-1,400 jobs)
> Poverty rate: 16.9%
Youngstown is one of several metro areas in Ohio to rank on this list. Between 2010 and 2018, employment in the metro area declined by 0.1%, and as of September, 5.7% of the metro area’s workforce was unemployed, well above the 3.5% national unemployment rate.
A Rust Belt city, Youngstown’s weak job market has been impacted by the decline of American manufacturing. The metro area’s manufacturing sector shed 1,000 jobs since the end of the Great Recession. The government and financial activities sectors each contracted by over 1,000 jobs as well.

3. Rockford, IL
> Sept. 2019 unemployment: 5.8%
> 2010-2018 total employment change: +9,400 (+6.5%)
> Industry with the largest 8-yr. job decline: Government (-1,300 jobs)
> Poverty rate: 15.8%
Unlike most metro areas on this list, employment in Rockford, Illinois, increased between 2010 and 2018. Still, the metro area’s 6.5% employment growth lagged well behind the 14.4% national employment expansion nationwide. Additionally, the metro area’s job market remains relatively weak. As of September, 5.8% of Rockford’s labor force was unemployed, compared to the 3.5% national unemployment rate. Not metro area in Illinois has higher unemployment than Rockford.
[in-text-ad-2]

2. Sierra Vista-Douglas, AZ
> Sept. 2019 unemployment: 6.0%
> 2010-2018 total employment change: -3,900 (-10.4%)
> Industry with the largest 8-yr. job decline: Professional and business services (-1,900 jobs)
> Poverty rate: 13.4%
There were about 3,900 fewer people working in the Sierra Vista-Douglas metro area in 2018 than there were in 2010. The staggering 10.4% decline in overall employment was nearly the largest among U.S. metro areas.
The area’s falling employment is largely the result of substantial declines in a handful of industries. The leisure and hospitality sector shed 400 jobs, and the government sector contracted by 1,700 jobs between 2010 and 2018. The professional and business services sector contracted the most, with 1,900 fewer workers in 2018 than in 2010.

1. Ocean City, NJ
> Sept. 2019 unemployment: 6.6%
> 2010-2018 total employment change: +2,000 (+4.8%)
> Industry with the largest 8-yr. job decline: Government (-900 jobs)
> Poverty rate: 9.4%
Ocean City, one of two New Jersey metro areas on this list, has one of the weakest job markets in the United States. The metro area’s 6.6% September unemployment rate is well above the 3.5% national rate and ranks as the highest among any metro area in the eastern United States. Though there are about 2,000 more people working in the metro area in 2018 than there were in 2010, the 4.8% employment growth rate was sluggish compared to the 14.4% national rate over the same period.
Since 2010, the Ocean City population declined by 4.8%. Employment changes in government and education and health services often tracks closely with population change, and it is perhaps no coincidence that those sectors each shed hundreds of jobs in the metro area between 2010 and 2018.
Methodology
To determine the sources of joblessness in the cities with the highest unemployment, 24/7 Wall St. reviewed overall employment change between 2010 and 2018 in 383 U.S. metro areas. We only considered metro areas in which total employment growth was less than half the 14.4% national employment growth rate. We then ranked those cities based on the non-seasonally adjusted September 2019 unemployment rate. The metro areas on this list have unemployment rates of at least 5.0%.
Unemployment rates came from the Bureau of Labor Statistics’ Local Area Unemployment Statistics program. Data on industry employment also came from the BLS. Poverty and median household income came from the U.S. Census Bureau’s 2018 American Community Survey. Population and population change also came from the ACS.
Contact [email protected] for any questions or corrections.