Incomes are on the rise in the United States. The typical U.S. household earned $65,712 in 2019 — up by nearly $3,000 from the previous year, according to recently released data from the U.S. Census Bureau. The increase is the continuation of nearly a decade-long trend of year-over-year income growth.
Though median household income in the U.S. stands at an all time high, in much of the country, incomes far exceed the national benchmark. In dozens of major metropolitan areas — including several that serve as economic engines for not only their respective states, but the country as a whole — most households earn far more than what is typical nationwide.
Using median household income data from the Census Bureau’s 2019 American Community Survey for all 384 metropolitan areas, 24/7 Wall St. identified America’s richest cities. In each of the metro areas on this list, the median household income is above $75,000.
Supplemental data on median home value, the percentage of adults age 25 and older with at least a bachelor’s degree, and median household income in 2018 also came from the ACS. Data on 2019 unemployment came from the Bureau of Labor Statistics. For context, we noted when metro areas fell within the highest and lowest 10% and 25% of all U.S. metro areas for each supplemental measure. If no context is provided for a given measure, the metro area falls in the middle two quartiles.
Though there are some Southern and Midwestern cities that rank among the wealthiest in the country, most of the metro areas on this list are either in Northeastern or Western states. Incomes tend to rise with educational attainment, and these cities and their surrounding areas also tend to have relatively large college-educated populations. Only eight cities on this list have a bachelor’s degree attainment rate below the 33.1% national average. And in five of the 50 cities on the list, over half of all adults have a bachelor’s degree or higher. Here is a look at the most educated city in every state.
Real estate values often reflect incomes in a given city or town. And with high incomes, homes in the metro areas on this list are often relatively expensive. In 15 of the richest U.S. metro areas, most homes are worth more than $500,000. With a median home value of $226,700, Rochester, Minnesota, is the only metro area on this list where the typical home is worth less than the national median home value of $240,500. Here is a look at the most expensive place to live by state.
It is important to note that in nearly every metro area on this list, the COVID-19 recession has pushed the unemployment rate higher than the 2019 average. The impact that the climbing unemployment will have on incomes in these cities remains to be seen.
Click here to see America’s richest cities

50. Chicago-Naperville-Elgin, IL-IN-WI
> Median household income: $75,379
> Median income change 2018 to 2019: +$3,551 (+4.9%)
> Median home value: $253,800
> Adults with a bachelor’s degree: 39.2% (highest 25% of US metros)
> 2019 unemployment: 3.8%
[in-text-ad]

49. Madison, WI
> Median household income: $75,545
> Median income change 2018 to 2019: +$4,068 (+5.7%)
> Median home value: $276,600 (highest 25% of US metros)
> Adults with a bachelor’s degree: 48.6% (highest 10% of US metros)
> 2019 unemployment: 2.5% (lowest 10% of US metros)
[recirclink id=745909]
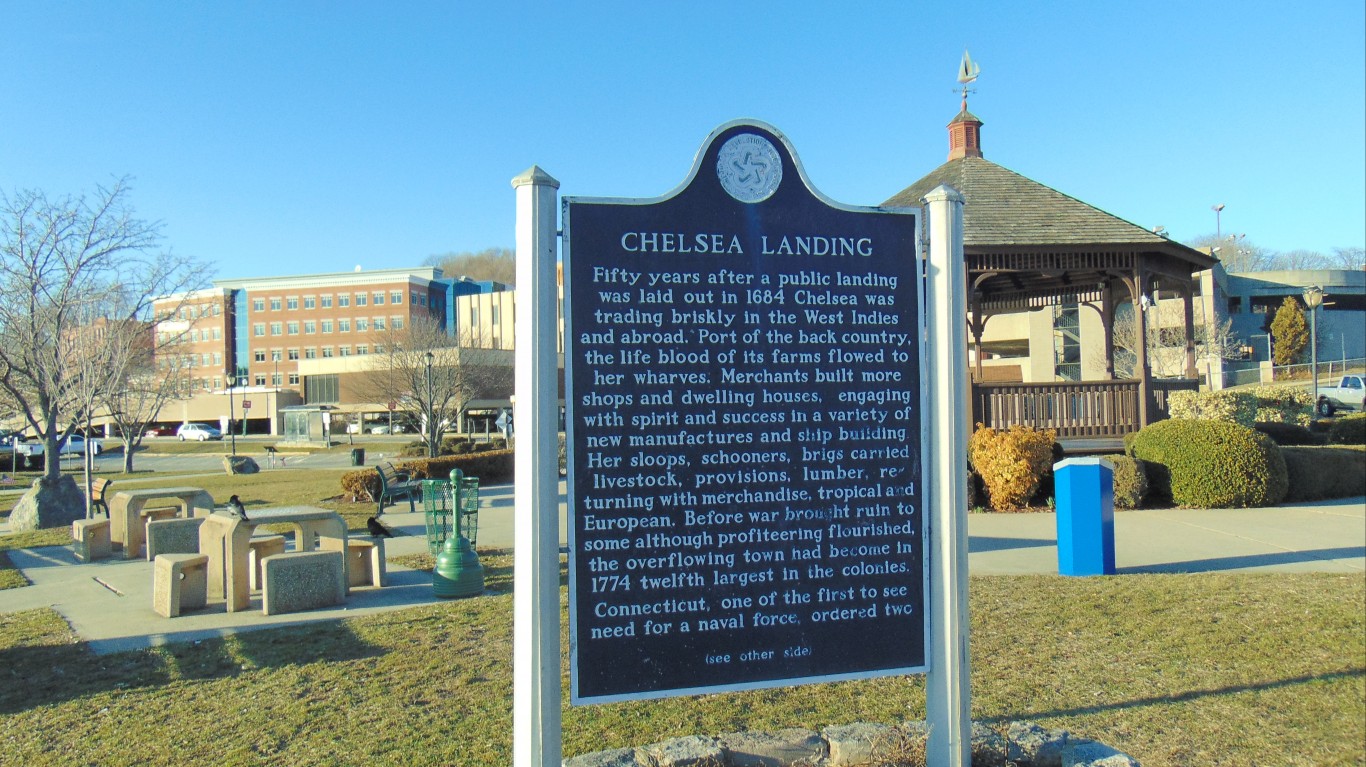
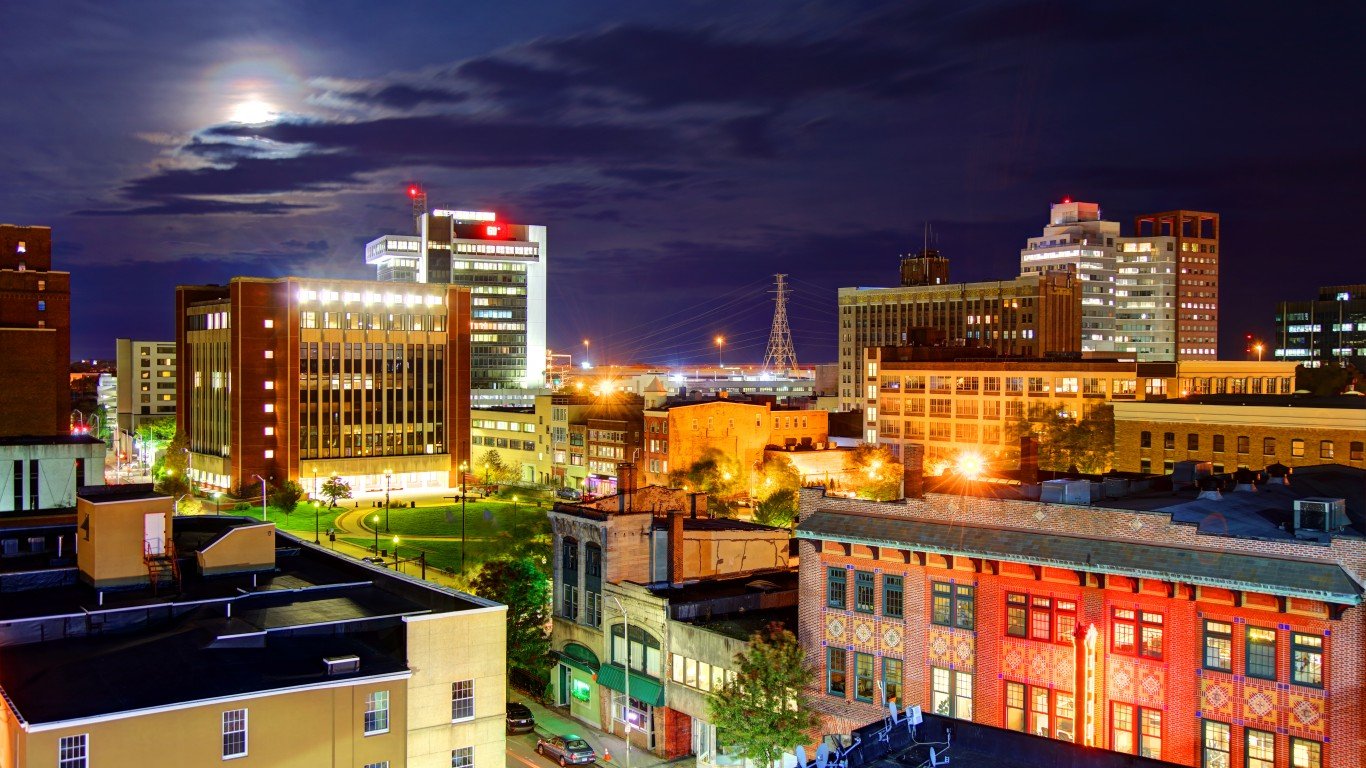
48. Norwich-New London, CT
> Median household income: $75,633
> Median income change 2018 to 2019: +$6,680 (+9.7%)
> Median home value: $255,400
> Adults with a bachelor’s degree: 33.3%
> 2019 unemployment: 3.6%

47. Santa Maria-Santa Barbara, CA
> Median household income: $75,653
> Median income change 2018 to 2019: -$3,109 (-3.9%)
> Median home value: $593,800 (highest 10% of US metros)
> Adults with a bachelor’s degree: 34.5%
> 2019 unemployment: 3.7%
[in-text-ad-2]
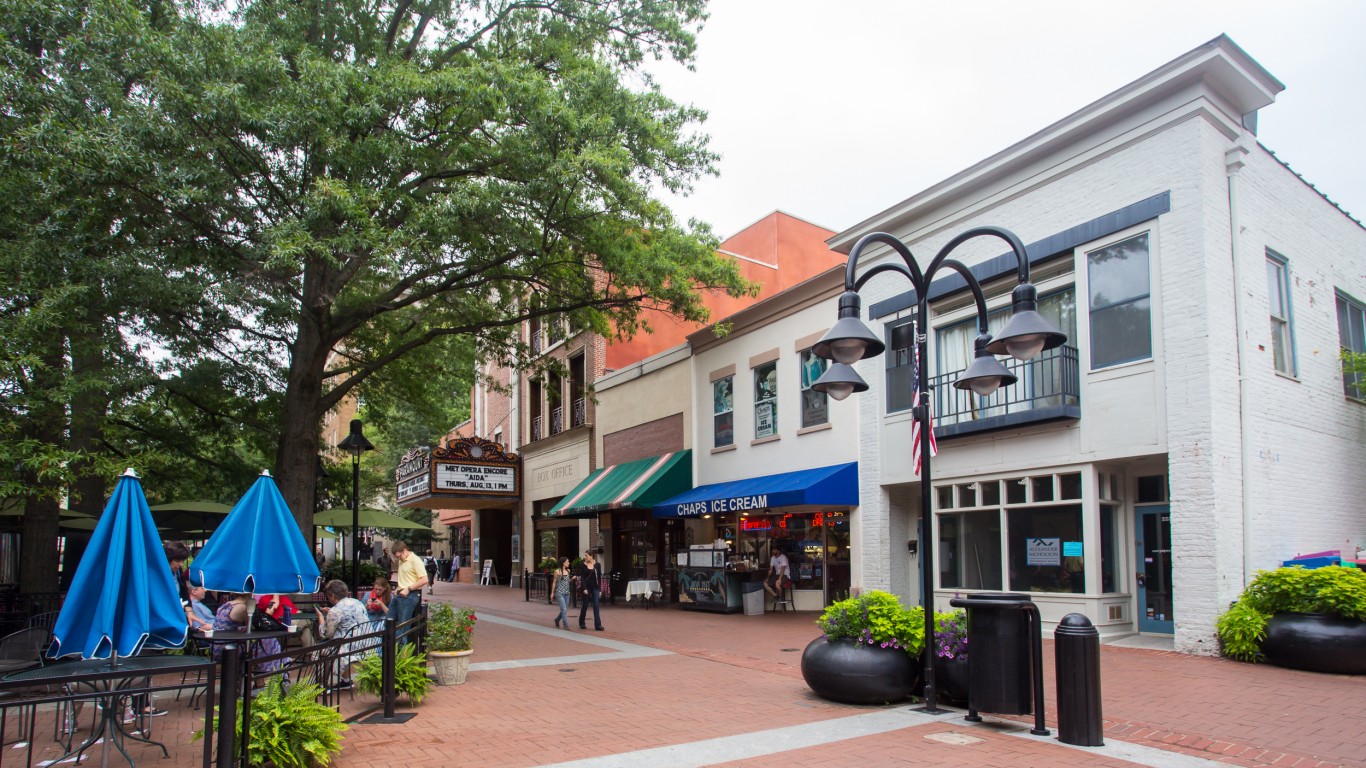
46. Charlottesville, VA
> Median household income: $75,907
> Median income change 2018 to 2019: +$3,753 (+5.2%)
> Median home value: $317,700 (highest 25% of US metros)
> Adults with a bachelor’s degree: 49.2% (highest 10% of US metros)
> 2019 unemployment: 2.5% (lowest 10% of US metros)

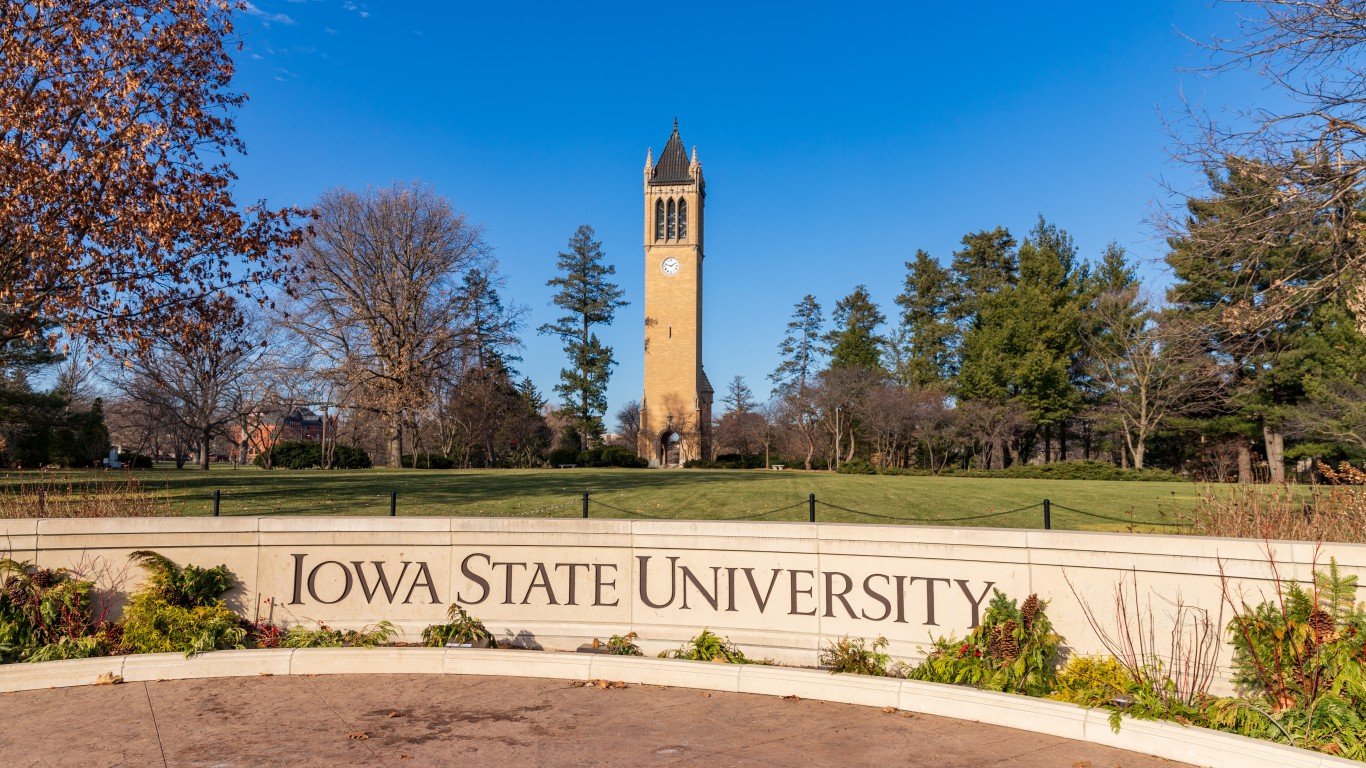
45. Rochester, MN
> Median household income: $75,926
> Median income change 2018 to 2019: +$2,246 (+3.0%)
> Median home value: $226,700
> Adults with a bachelor’s degree: 41.2% (highest 10% of US metros)
> 2019 unemployment: 2.8% (lowest 25% of US metros)
[in-text-ad]

44. Naples-Marco Island, FL
> Median household income: $76,025
> Median income change 2018 to 2019: +$5,177 (+7.3%)
> Median home value: $370,800 (highest 10% of US metros)
> Adults with a bachelor’s degree: 35.8% (highest 25% of US metros)
> 2019 unemployment: 3.1%
[recirclink id=725442]
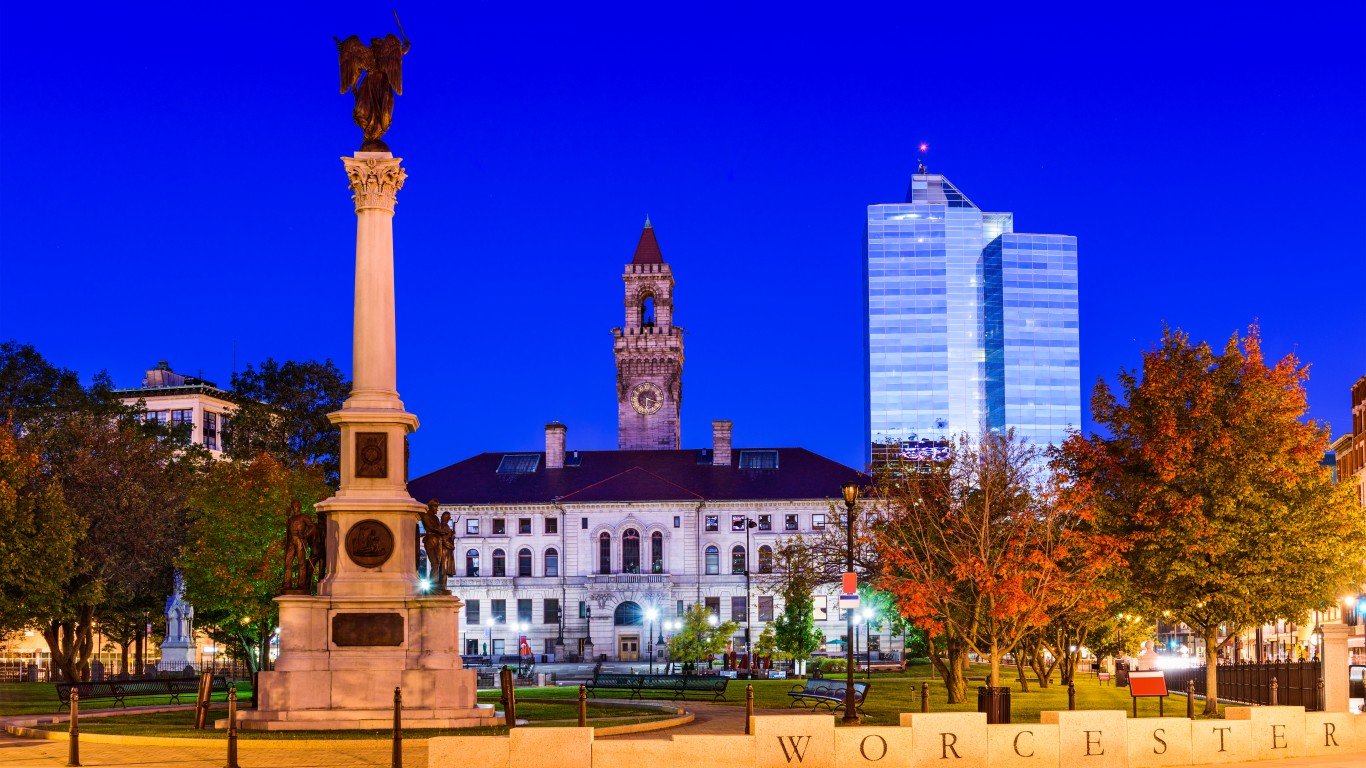
43. Worcester, MA-CT
> Median household income: $76,348
> Median income change 2018 to 2019: +$4,228 (+5.9%)
> Median home value: $294,300 (highest 25% of US metros)
> Adults with a bachelor’s degree: 35.3% (highest 25% of US metros)
> 2019 unemployment: 3.2%
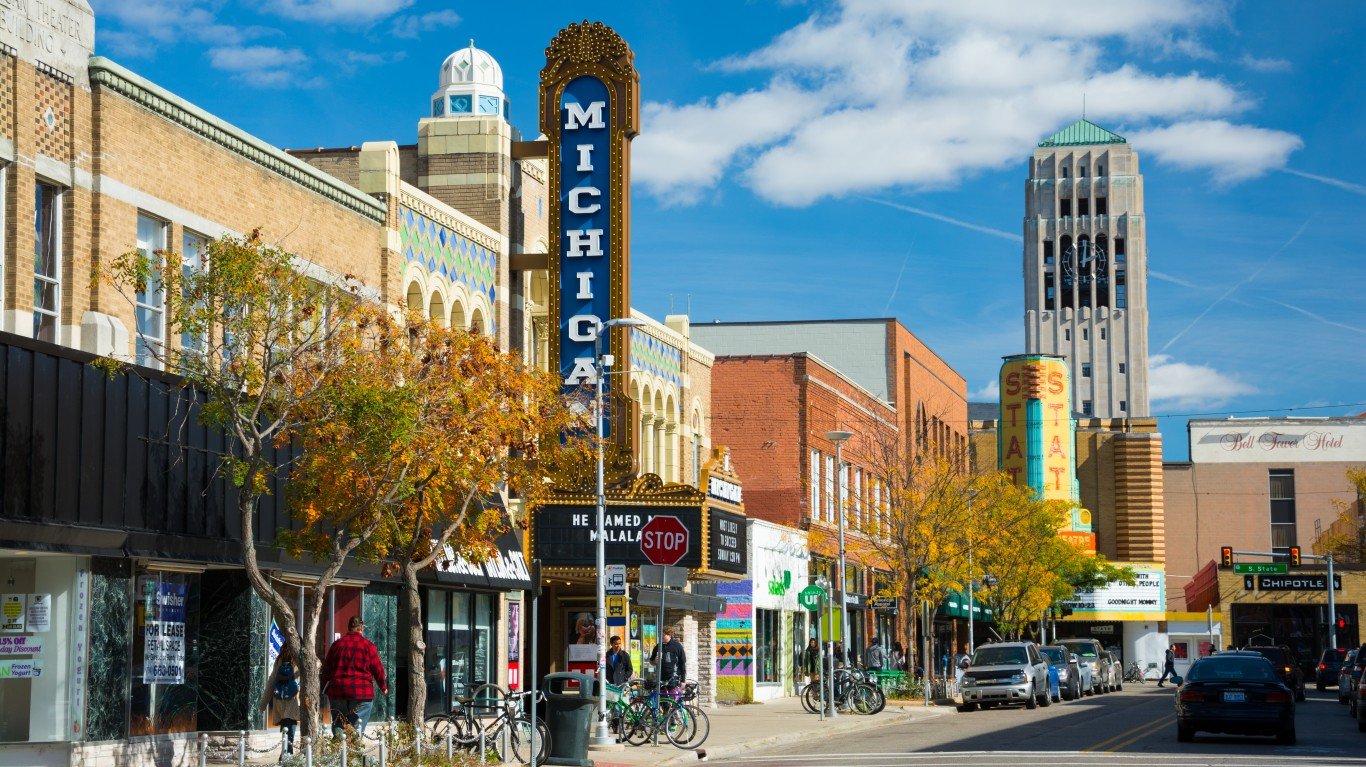
42. Ann Arbor, MI
> Median household income: $76,576
> Median income change 2018 to 2019: +$3,517 (+4.8%)
> Median home value: $295,300 (highest 25% of US metros)
> Adults with a bachelor’s degree: 55.9% (highest 10% of US metros)
> 2019 unemployment: 2.9% (lowest 25% of US metros)
[in-text-ad-2]
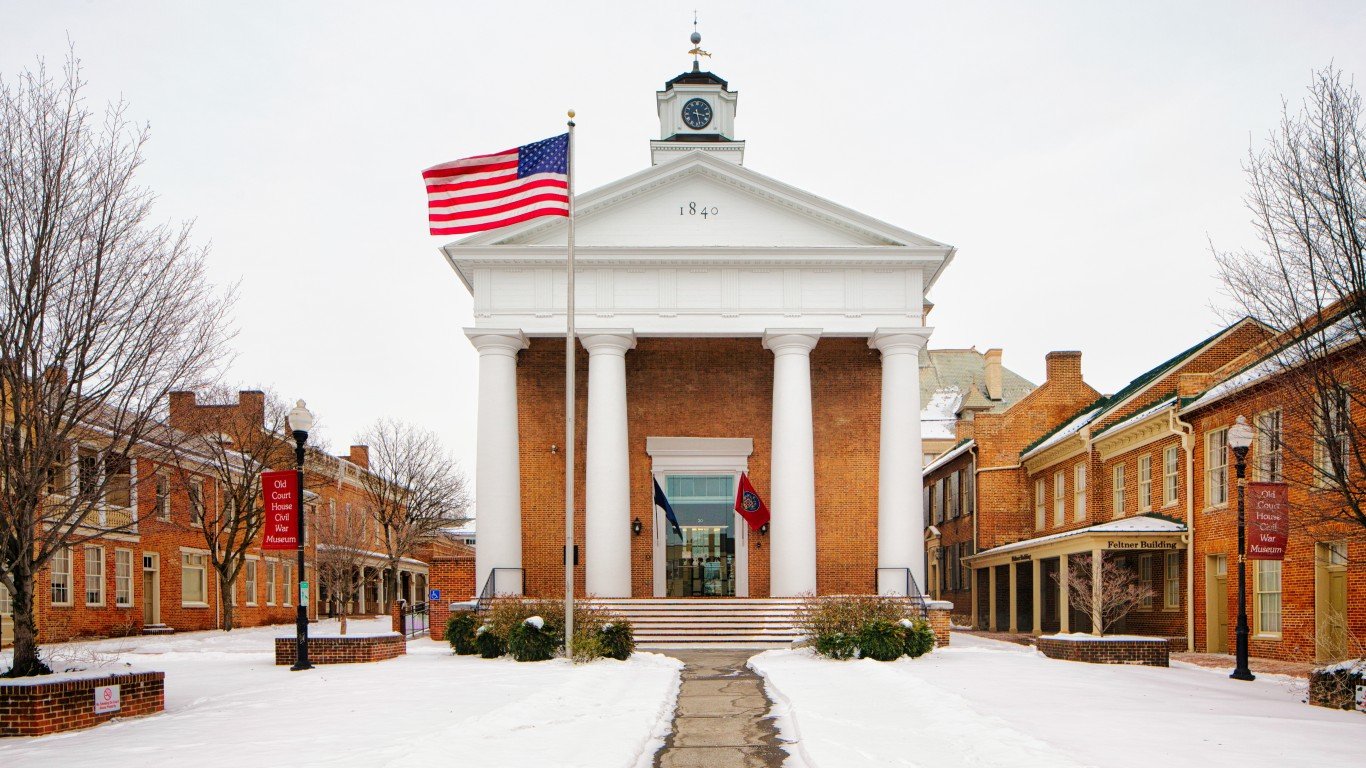
41. Winchester, VA-WV
> Median household income: $76,583
> Median income change 2018 to 2019: +$10,400 (+15.7%)
> Median home value: $247,300
> Adults with a bachelor’s degree: 26.7%
> 2019 unemployment: 2.7% (lowest 25% of US metros)

40. Sacramento-Roseville-Folsom, CA
> Median household income: $76,706
> Median income change 2018 to 2019: +$2,285 (+3.1%)
> Median home value: $434,400 (highest 10% of US metros)
> Adults with a bachelor’s degree: 34.2%
> 2019 unemployment: 3.6%
[in-text-ad]

39. Hartford-East Hartford-Middletown, CT
> Median household income: $77,005
> Median income change 2018 to 2019: -$1,815 (-2.3%)
> Median home value: $254,100
> Adults with a bachelor’s degree: 39.7% (highest 25% of US metros)
> 2019 unemployment: 3.8%
[recirclink id=728859]
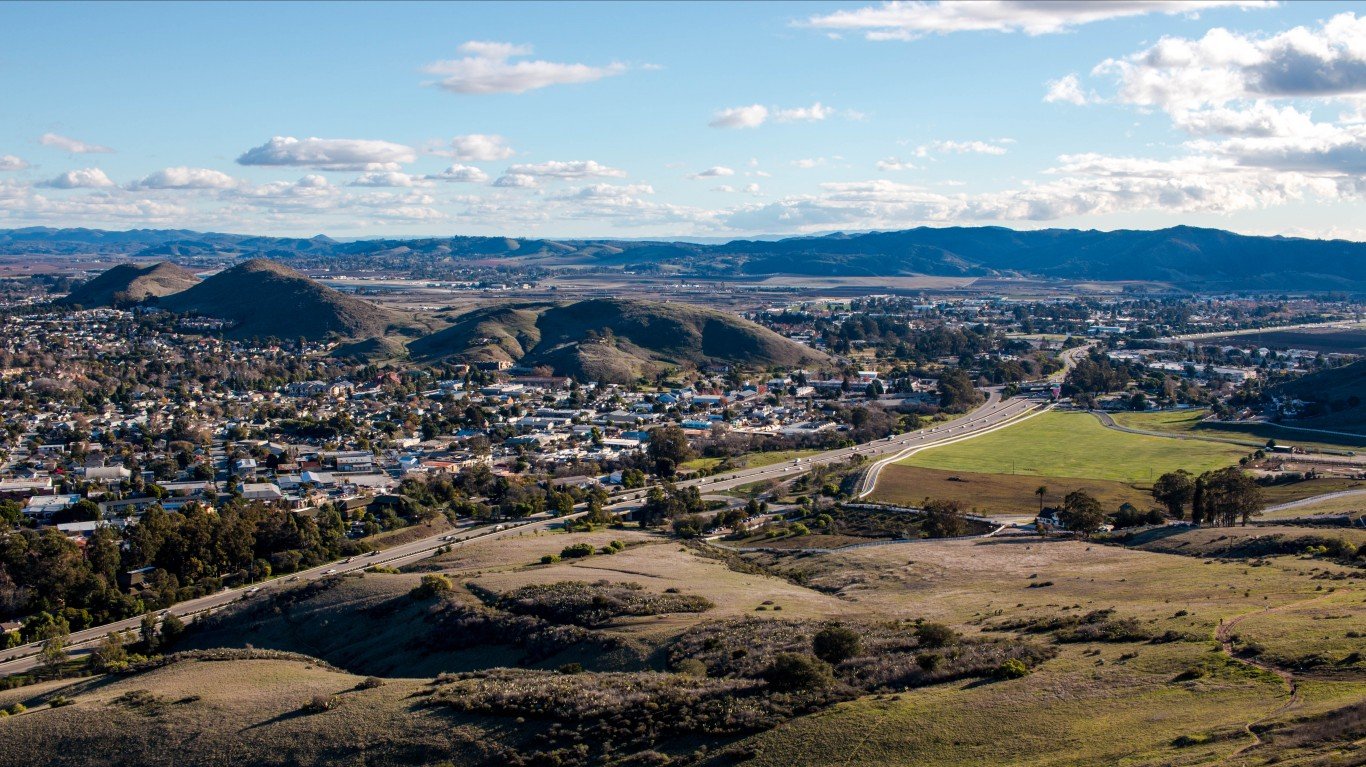
38. San Luis Obispo-Paso Robles, CA
> Median household income: $77,265
> Median income change 2018 to 2019: +$4,588 (+6.3%)
> Median home value: $637,000 (highest 10% of US metros)
> Adults with a bachelor’s degree: 37.2% (highest 25% of US metros)
> 2019 unemployment: 2.9% (lowest 25% of US metros)
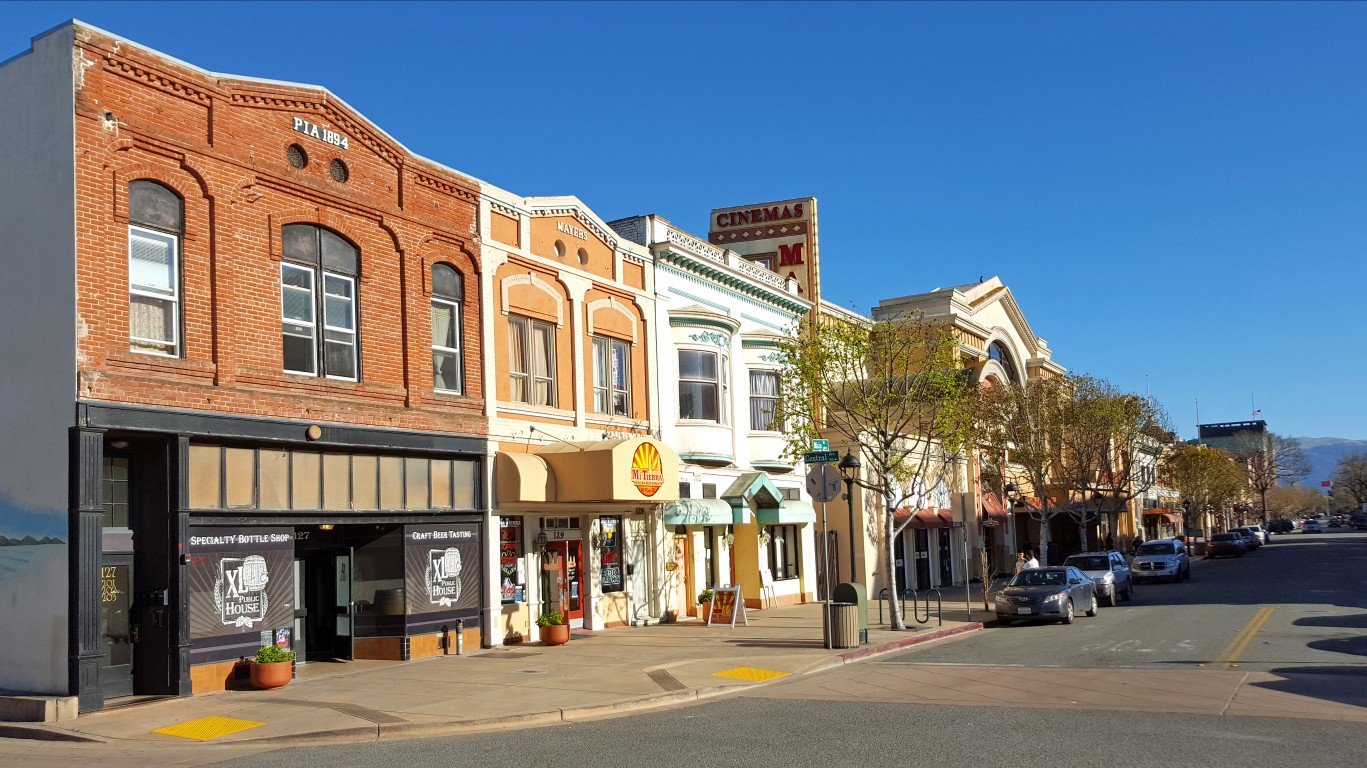
37. Salinas, CA
> Median household income: $77,514
> Median income change 2018 to 2019: +$5,787 (+8.1%)
> Median home value: $602,900 (highest 10% of US metros)
> Adults with a bachelor’s degree: 25.7%
> 2019 unemployment: 6.2% (highest 10% of US metros)
[in-text-ad-2]

36. Los Angeles-Long Beach-Anaheim, CA
> Median household income: $77,774
> Median income change 2018 to 2019: +$3,777 (+5.1%)
> Median home value: $666,900 (highest 10% of US metros)
> Adults with a bachelor’s degree: 35.5% (highest 25% of US metros)
> 2019 unemployment: 4.0%

35. Portland-Vancouver-Hillsboro, OR-WA
> Median household income: $78,439
> Median income change 2018 to 2019: +$1,663 (+2.2%)
> Median home value: $408,600 (highest 10% of US metros)
> Adults with a bachelor’s degree: 40.3% (highest 25% of US metros)
> 2019 unemployment: 3.5%
[in-text-ad]

34. Olympia-Lacey-Tumwater, WA
> Median household income: $78,512
> Median income change 2018 to 2019: +$4,856 (+6.6%)
> Median home value: $333,100 (highest 25% of US metros)
> Adults with a bachelor’s degree: 34.4%
> 2019 unemployment: 4.8% (highest 25% of US metros)
[recirclink id=730208]
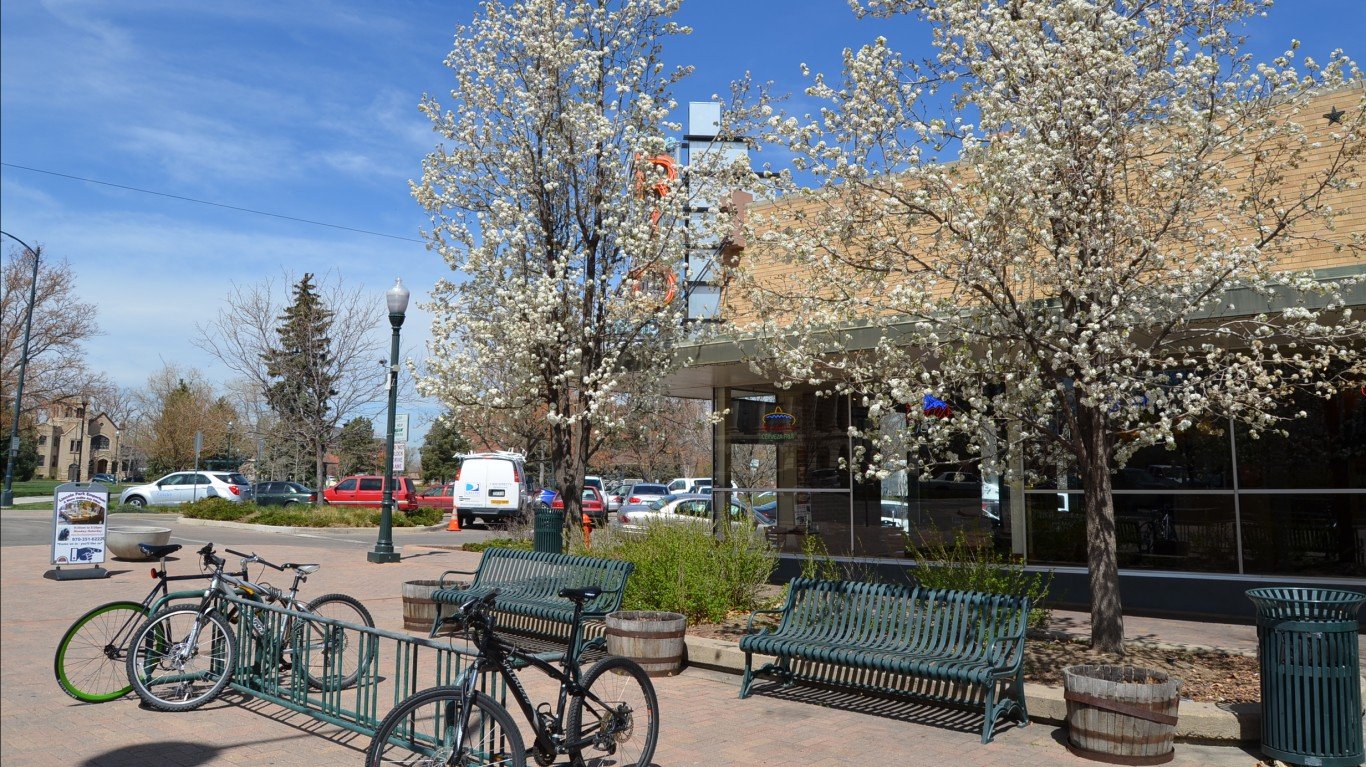
33. Greeley, CO
> Median household income: $78,615
> Median income change 2018 to 2019: +$1,514 (+2.0%)
> Median home value: $366,800 (highest 10% of US metros)
> Adults with a bachelor’s degree: 29.9%
> 2019 unemployment: 2.5% (lowest 10% of US metros)
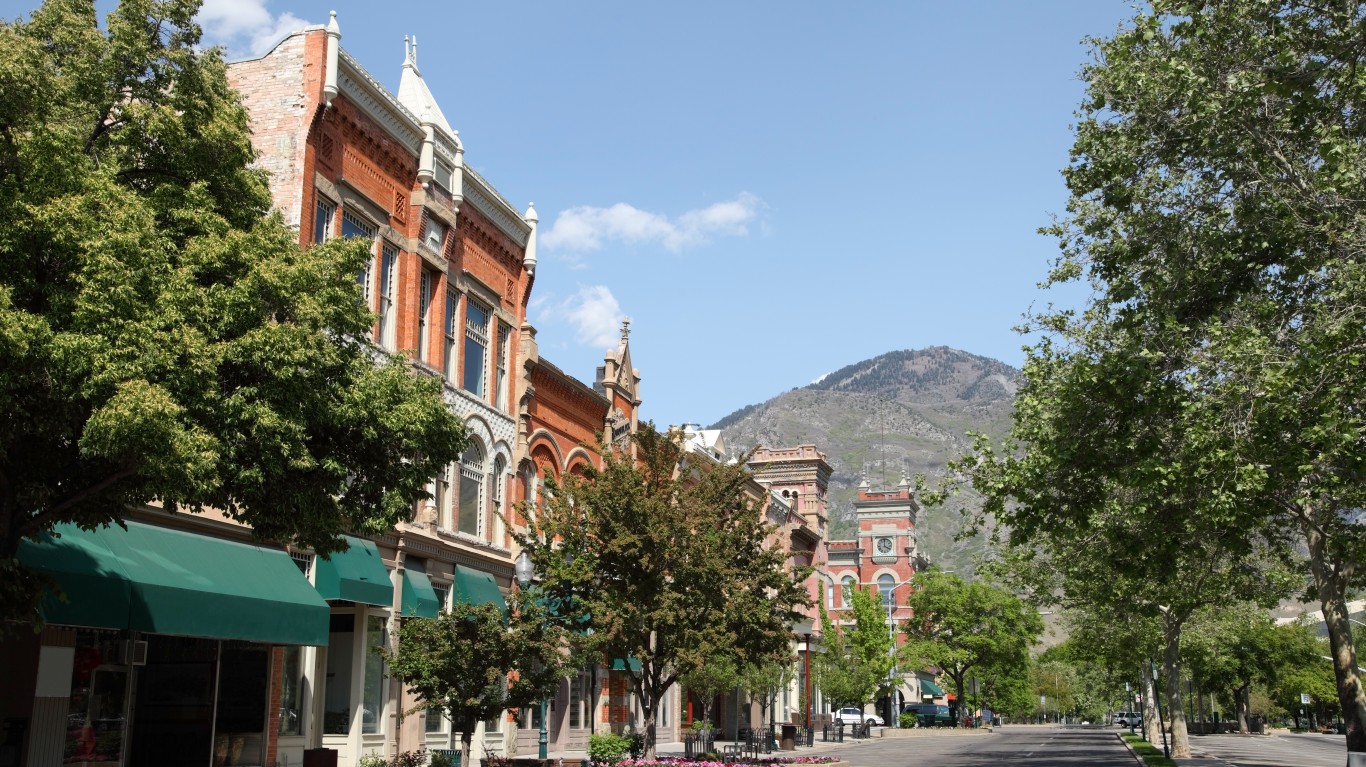
32. Provo-Orem, UT
> Median household income: $79,152
> Median income change 2018 to 2019: +$2,683 (+3.5%)
> Median home value: $360,600 (highest 10% of US metros)
> Adults with a bachelor’s degree: 40.6% (highest 10% of US metros)
> 2019 unemployment: 2.4% (lowest 10% of US metros)
[in-text-ad-2]

31. Ogden-Clearfield, UT
> Median household income: $79,251
> Median income change 2018 to 2019: +$960 (+1.2%)
> Median home value: $306,600 (highest 25% of US metros)
> Adults with a bachelor’s degree: 32.0%
> 2019 unemployment: 2.6% (lowest 10% of US metros)

30. Trenton-Princeton, NJ
> Median household income: $79,492
> Median income change 2018 to 2019: -$2,421 (-3.0%)
> Median home value: $291,600 (highest 25% of US metros)
> Adults with a bachelor’s degree: 44.5% (highest 10% of US metros)
> 2019 unemployment: 3.2%
[in-text-ad]

29. Bremerton-Silverdale-Port Orchard, WA
> Median household income: $79,624
> Median income change 2018 to 2019: +$1,217 (+1.6%)
> Median home value: $378,800 (highest 10% of US metros)
> Adults with a bachelor’s degree: 34.8% (highest 25% of US metros)
> 2019 unemployment: 4.6% (highest 25% of US metros)
[recirclink id=745909]
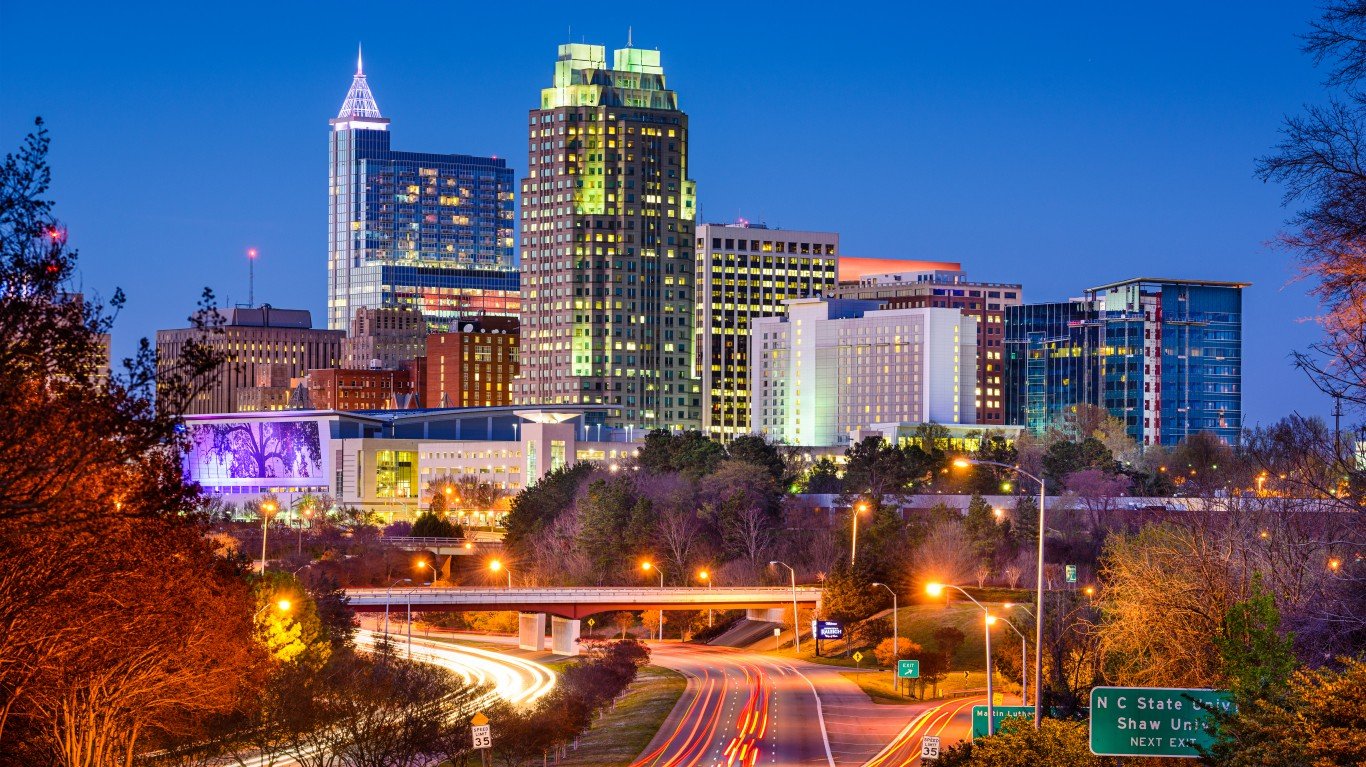
28. Raleigh-Cary, NC
> Median household income: $80,096
> Median income change 2018 to 2019: +$3,529 (+4.6%)
> Median home value: $285,600 (highest 25% of US metros)
> Adults with a bachelor’s degree: 48.0% (highest 10% of US metros)
> 2019 unemployment: 3.4%

27. Salt Lake City, UT
> Median household income: $80,196
> Median income change 2018 to 2019: +$4,980 (+6.6%)
> Median home value: $356,400 (highest 10% of US metros)
> Adults with a bachelor’s degree: 36.5% (highest 25% of US metros)
> 2019 unemployment: 2.5% (lowest 10% of US metros)
[in-text-ad-2]
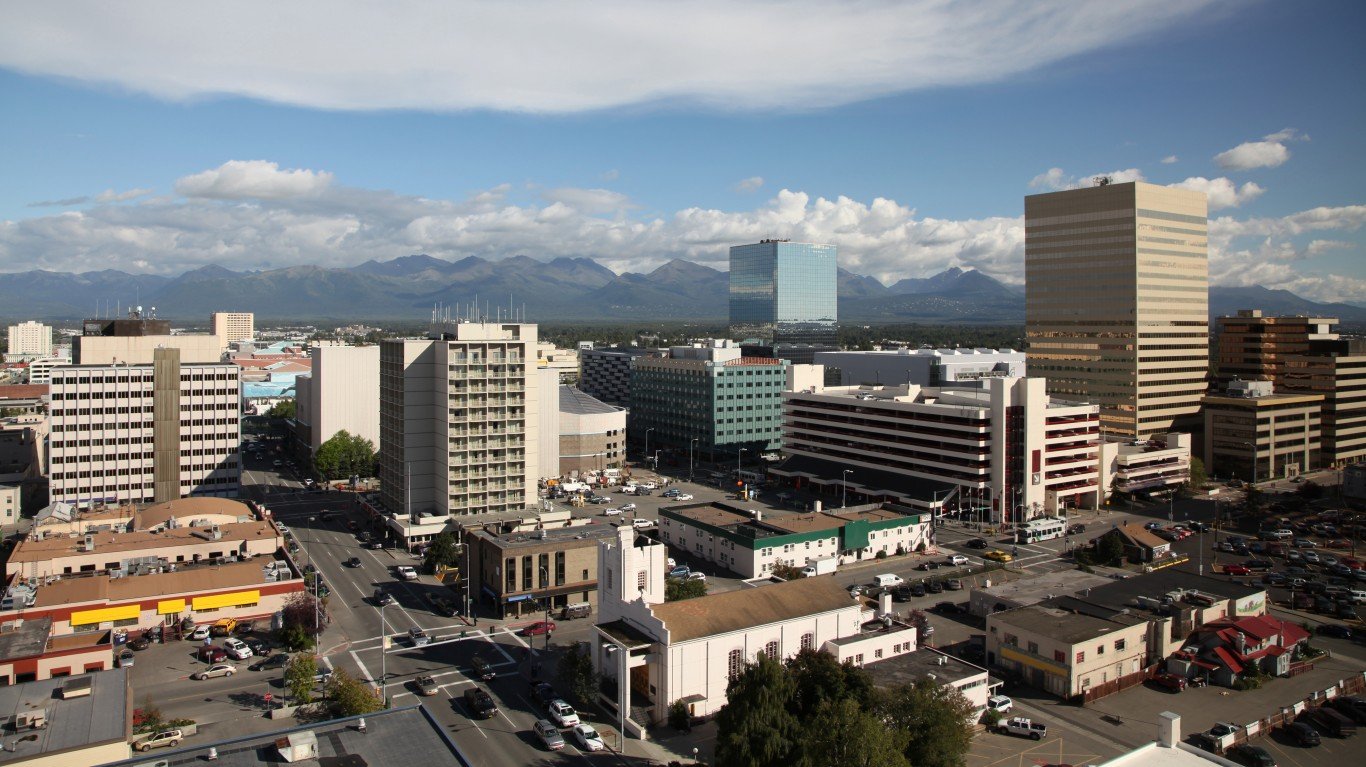
26. Anchorage, AK
> Median household income: $80,676
> Median income change 2018 to 2019: -$1,780 (-2.2%)
> Median home value: $300,100 (highest 25% of US metros)
> Adults with a bachelor’s degree: 33.1%
> 2019 unemployment: 5.5% (highest 10% of US metros)
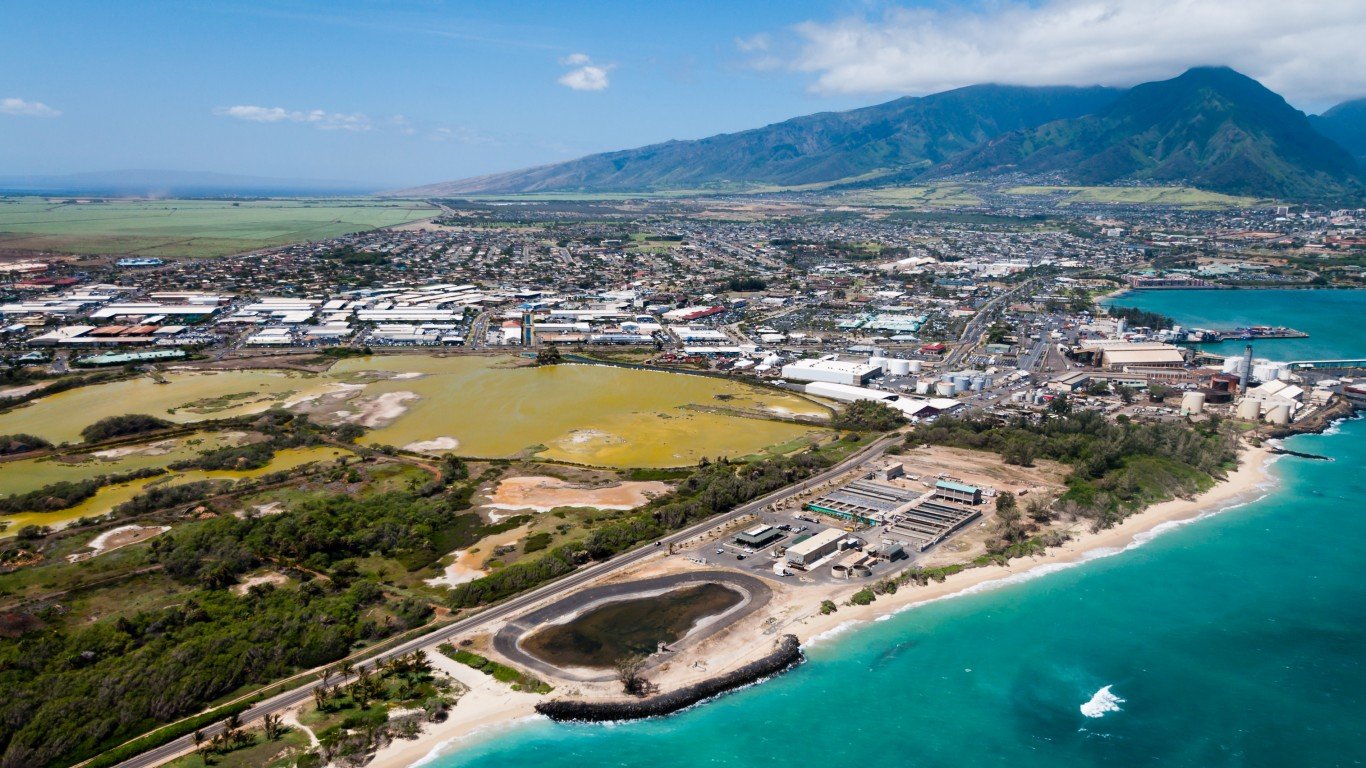
25. Kahului-Wailuku-Lahaina, HI
> Median household income: $80,754
> Median income change 2018 to 2019: -$3,771 (-4.5%)
> Median home value: $697,900 (highest 10% of US metros)
> Adults with a bachelor’s degree: 27.7%
> 2019 unemployment: 2.6% (lowest 10% of US metros)
[in-text-ad]

24. Austin-Round Rock-Georgetown, TX
> Median household income: $80,954
> Median income change 2018 to 2019: +$2,441 (+3.1%)
> Median home value: $318,400 (highest 25% of US metros)
> Adults with a bachelor’s degree: 46.2% (highest 10% of US metros)
> 2019 unemployment: 2.7% (lowest 25% of US metros)
[recirclink id=725442]

23. Midland, TX
> Median household income: $82,650
> Median income change 2018 to 2019: +$154 (+0.2%)
> Median home value: $263,500 (highest 25% of US metros)
> Adults with a bachelor’s degree: 29.3%
> 2019 unemployment: 2.1% (lowest 10% of US metros)

22. Baltimore-Columbia-Towson, MD
> Median household income: $83,160
> Median income change 2018 to 2019: +$1,541 (+1.9%)
> Median home value: $313,200 (highest 25% of US metros)
> Adults with a bachelor’s degree: 41.9% (highest 10% of US metros)
> 2019 unemployment: 3.6%
[in-text-ad-2]

21. New York-Newark-Jersey City, NY-NJ-PA
> Median household income: $83,160
> Median income change 2018 to 2019: +$3,316 (+4.2%)
> Median home value: $482,900 (highest 10% of US metros)
> Adults with a bachelor’s degree: 41.8% (highest 10% of US metros)
> 2019 unemployment: 3.7%
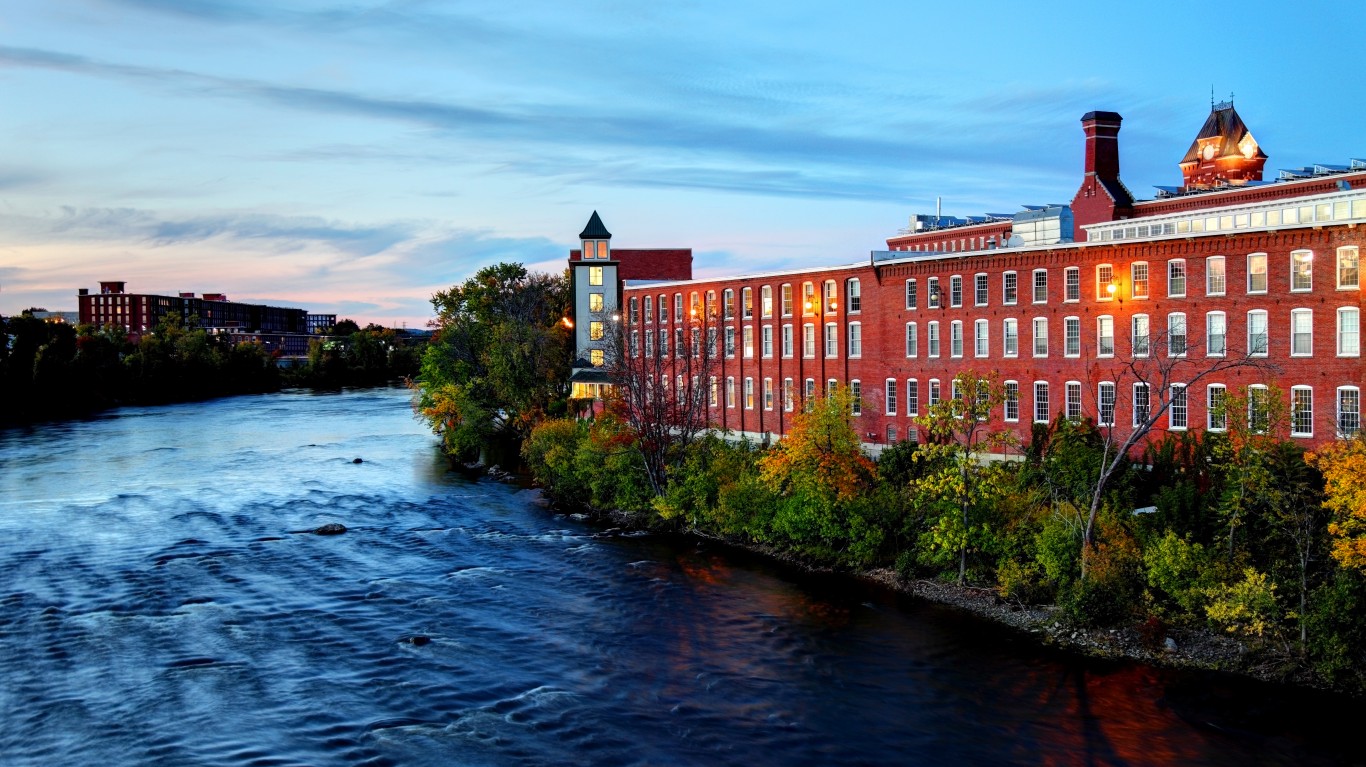
20. Manchester-Nashua, NH
> Median household income: $83,626
> Median income change 2018 to 2019: +$3,461 (+4.3%)
> Median home value: $293,300 (highest 25% of US metros)
> Adults with a bachelor’s degree: 37.8% (highest 25% of US metros)
> 2019 unemployment: 2.4% (lowest 10% of US metros)
[in-text-ad]

19. Minneapolis-St. Paul-Bloomington, MN-WI
> Median household income: $83,698
> Median income change 2018 to 2019: +$2,865 (+3.5%)
> Median home value: $284,500 (highest 25% of US metros)
> Adults with a bachelor’s degree: 43.2% (highest 10% of US metros)
> 2019 unemployment: 3.0%
[recirclink id=728859]

18. San Diego-Chula Vista-Carlsbad, CA
> Median household income: $83,985
> Median income change 2018 to 2019: +$3,534 (+4.4%)
> Median home value: $619,300 (highest 10% of US metros)
> Adults with a bachelor’s degree: 39.9% (highest 25% of US metros)
> 2019 unemployment: 3.2%
17. Barnstable Town, MA
> Median household income: $85,042
> Median income change 2018 to 2019: +$15,079 (+21.6%)
> Median home value: $409,700 (highest 10% of US metros)
> Adults with a bachelor’s degree: 47.1% (highest 10% of US metros)
> 2019 unemployment: 3.7%
[in-text-ad-2]
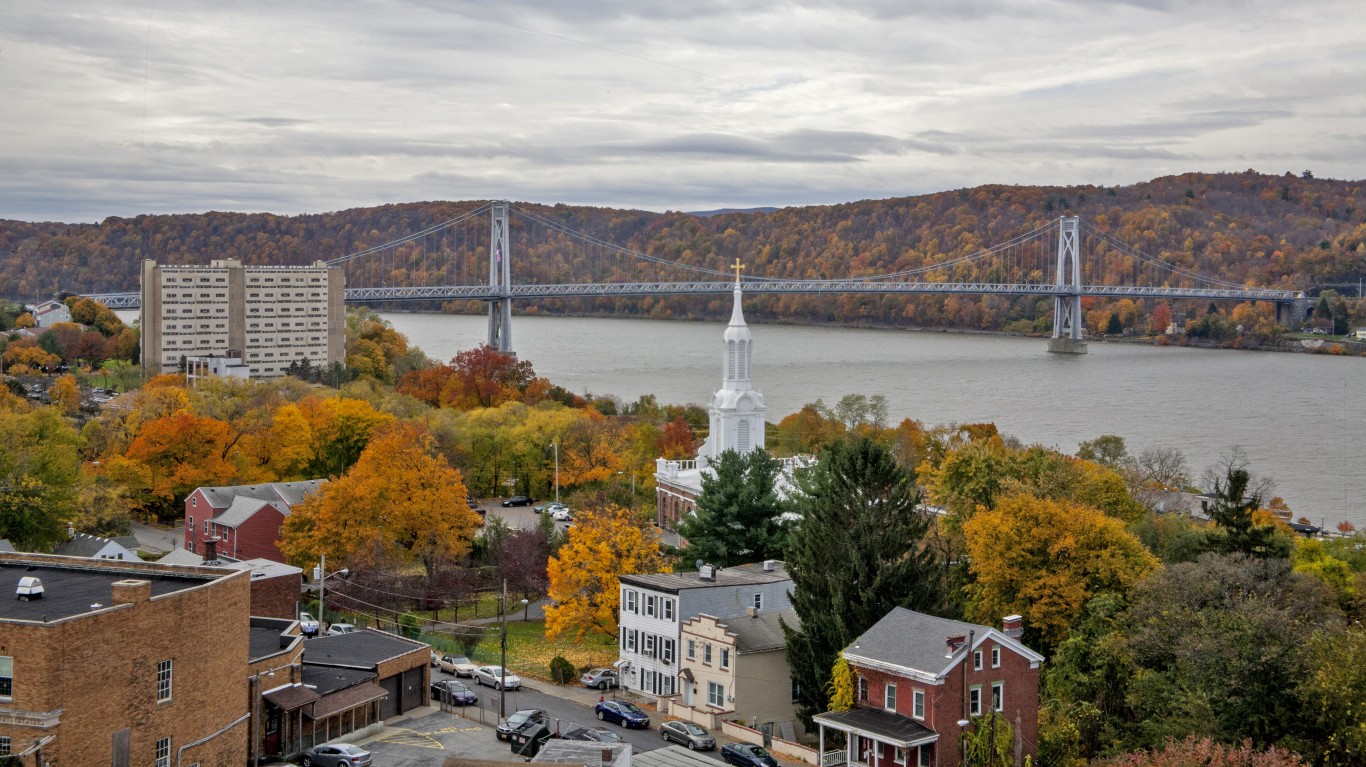
16. Poughkeepsie-Newburgh-Middletown, NY
> Median household income: $85,152
> Median income change 2018 to 2019: +$00 (+0.0%)
> Median home value: $292,400 (highest 25% of US metros)
> Adults with a bachelor’s degree: 33.2%
> 2019 unemployment: N/A
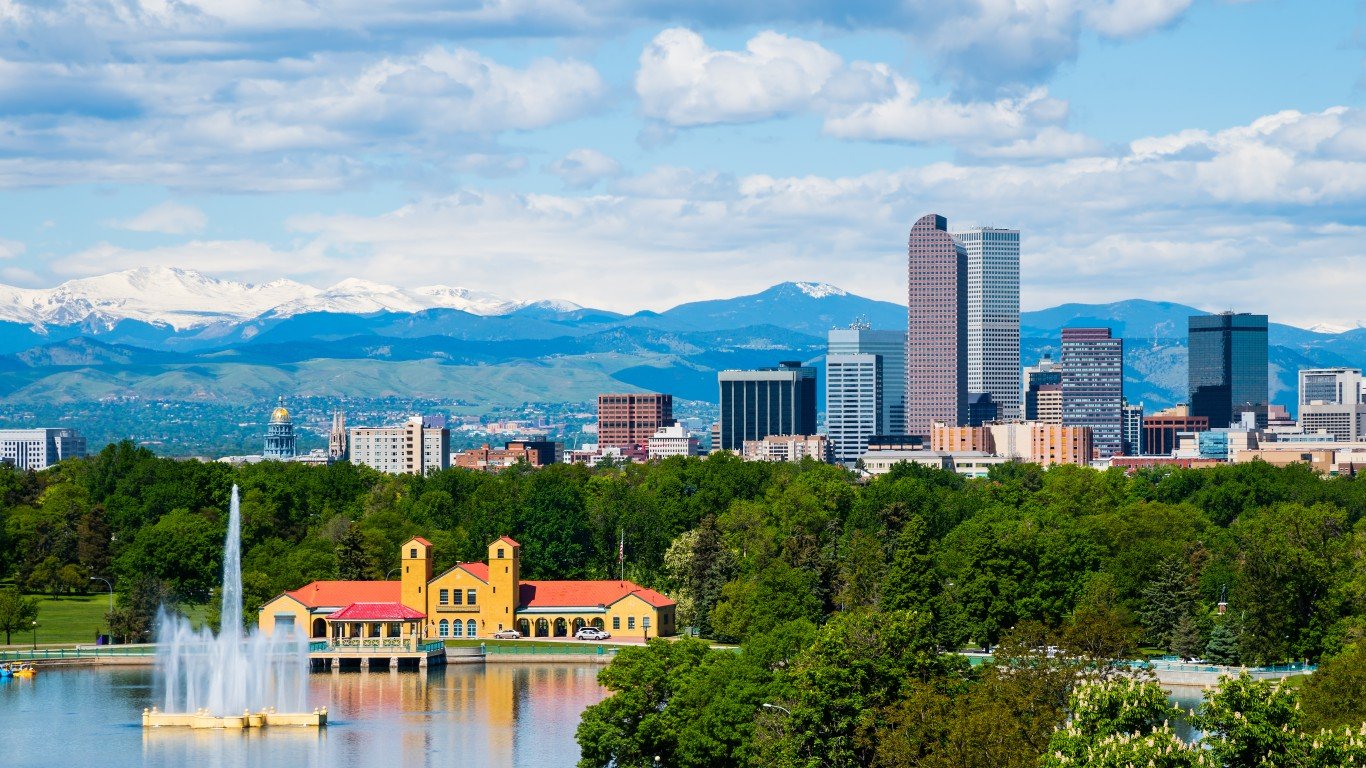
15. Denver-Aurora-Lakewood, CO
> Median household income: $85,641
> Median income change 2018 to 2019: +$4,853 (+6.0%)
> Median home value: $437,800 (highest 10% of US metros)
> Adults with a bachelor’s degree: 45.8% (highest 10% of US metros)
> 2019 unemployment: 2.7% (lowest 25% of US metros)
[in-text-ad]

14. Vallejo, CA
> Median household income: $86,652
> Median income change 2018 to 2019: +$890 (+1.0%)
> Median home value: $460,500 (highest 10% of US metros)
> Adults with a bachelor’s degree: 28.9%
> 2019 unemployment: 3.7%
[recirclink id=730208]

13. Urban Honolulu, HI
> Median household income: $87,470
> Median income change 2018 to 2019: +$1,789 (+2.1%)
> Median home value: $739,700 (highest 10% of US metros)
> Adults with a bachelor’s degree: 35.8% (highest 25% of US metros)
> 2019 unemployment: 2.6% (lowest 10% of US metros)

12. Santa Rosa-Petaluma, CA
> Median household income: $87,828
> Median income change 2018 to 2019: +$5,339 (+6.5%)
> Median home value: $664,600 (highest 10% of US metros)
> Adults with a bachelor’s degree: 37.4% (highest 25% of US metros)
> 2019 unemployment: 2.7% (lowest 25% of US metros)
[in-text-ad-2]

11. California-Lexington Park, MD
> Median household income: $87,947
> Median income change 2018 to 2019: -$5,928 (-6.3%)
> Median home value: $320,700 (highest 25% of US metros)
> Adults with a bachelor’s degree: 30.7%
> 2019 unemployment: 3.3%
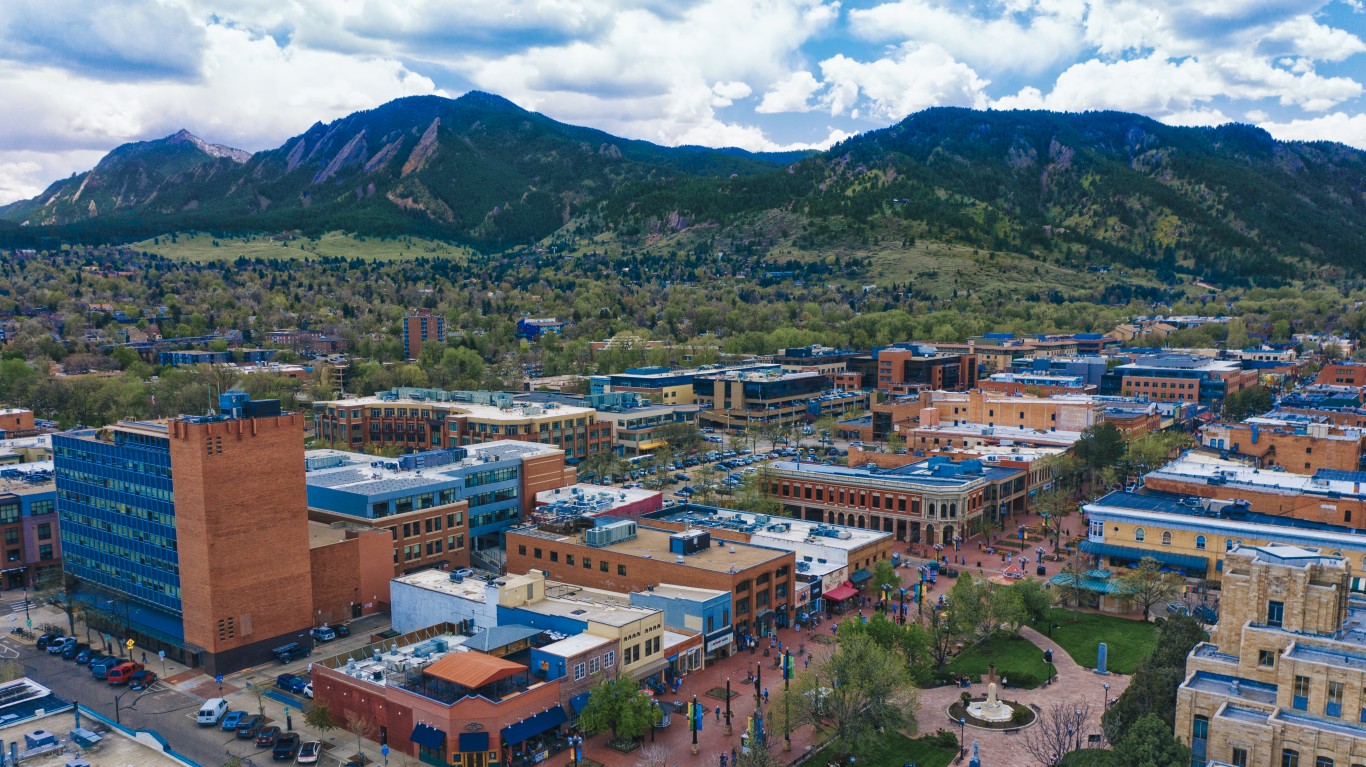
10. Boulder, CO
> Median household income: $88,535
> Median income change 2018 to 2019: +$2,972 (+3.5%)
> Median home value: $592,000 (highest 10% of US metros)
> Adults with a bachelor’s degree: 64.8% (highest 10% of US metros)
> 2019 unemployment: 2.4% (lowest 10% of US metros)
[in-text-ad]

9. Santa Cruz-Watsonville, CA
> Median household income: $89,269
> Median income change 2018 to 2019: +$748 (+0.8%)
> Median home value: $839,500 (highest 10% of US metros)
> Adults with a bachelor’s degree: 43.8% (highest 10% of US metros)
> 2019 unemployment: 4.7% (highest 25% of US metros)
[recirclink id=745909]
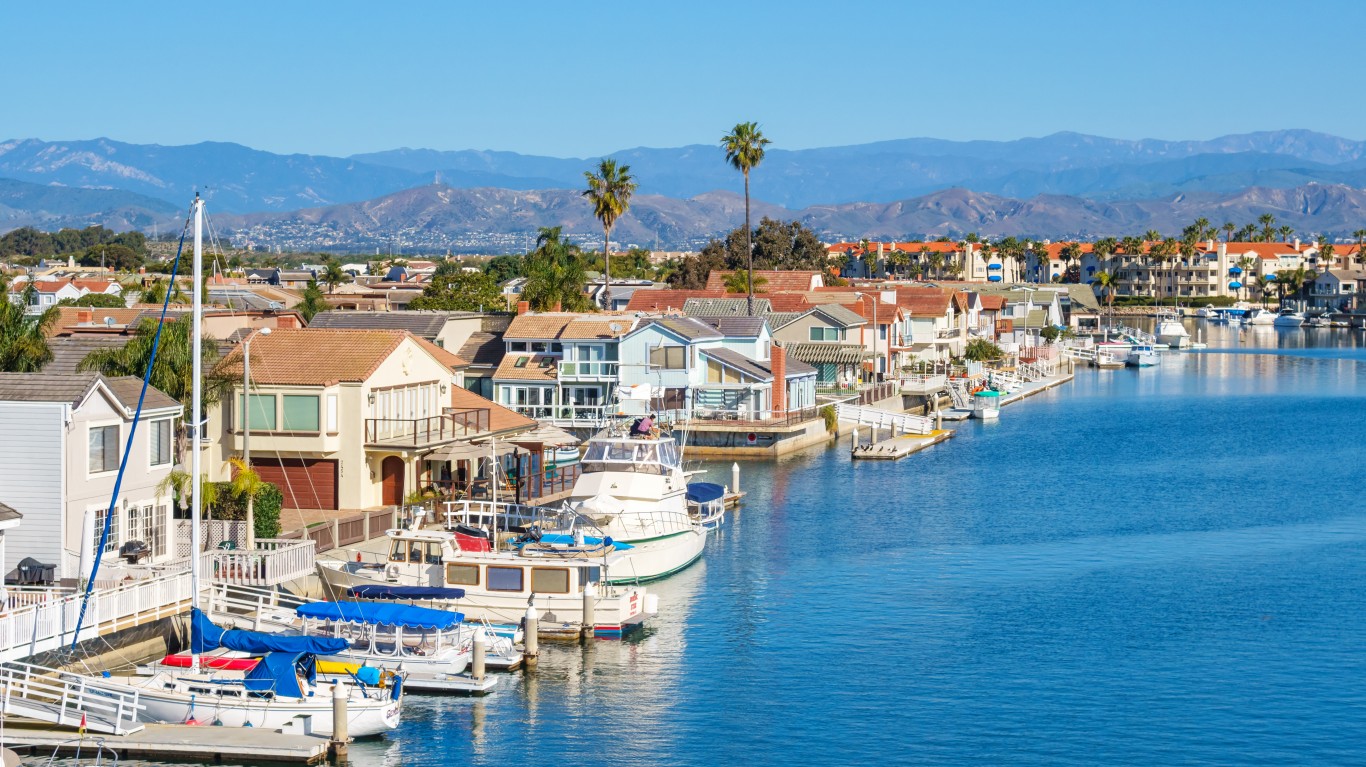
8. Oxnard-Thousand Oaks-Ventura, CA
> Median household income: $92,236
> Median income change 2018 to 2019: +$6,126 (+7.1%)
> Median home value: $629,600 (highest 10% of US metros)
> Adults with a bachelor’s degree: 34.8% (highest 25% of US metros)
> 2019 unemployment: 3.6%

7. Napa, CA
> Median household income: $92,769
> Median income change 2018 to 2019: +$3,978 (+4.5%)
> Median home value: $670,000 (highest 10% of US metros)
> Adults with a bachelor’s degree: 36.2% (highest 25% of US metros)
> 2019 unemployment: 2.8% (lowest 25% of US metros)
[in-text-ad-2]

6. Seattle-Tacoma-Bellevue, WA
> Median household income: $94,027
> Median income change 2018 to 2019: +$4,423 (+4.9%)
> Median home value: $503,000 (highest 10% of US metros)
> Adults with a bachelor’s degree: 44.1% (highest 10% of US metros)
> 2019 unemployment: 3.3%

5. Boston-Cambridge-Newton, MA-NH
> Median household income: $94,430
> Median income change 2018 to 2019: +$4,211 (+4.7%)
> Median home value: $482,700 (highest 10% of US metros)
> Adults with a bachelor’s degree: 49.3% (highest 10% of US metros)
> 2019 unemployment: 2.6% (lowest 10% of US metros)
[in-text-ad]
4. Bridgeport-Stamford-Norwalk, CT
> Median household income: $97,053
> Median income change 2018 to 2019: +$4,105 (+4.4%)
> Median home value: $444,500 (highest 10% of US metros)
> Adults with a bachelor’s degree: 49.1% (highest 10% of US metros)
> 2019 unemployment: 3.7%
[recirclink id=725442]

3. Washington-Arlington-Alexandria, DC-VA-MD-WV
> Median household income: $105,659
> Median income change 2018 to 2019: +$1,407 (+1.3%)
> Median home value: $446,300 (highest 10% of US metros)
> Adults with a bachelor’s degree: 51.4% (highest 10% of US metros)
> 2019 unemployment: 3.1%

2. San Francisco-Oakland-Berkeley, CA
> Median household income: $114,696
> Median income change 2018 to 2019: +$4,913 (+4.5%)
> Median home value: $940,900 (highest 10% of US metros)
> Adults with a bachelor’s degree: 51.4% (highest 10% of US metros)
> 2019 unemployment: 2.6% (lowest 10% of US metros)
[in-text-ad-2]
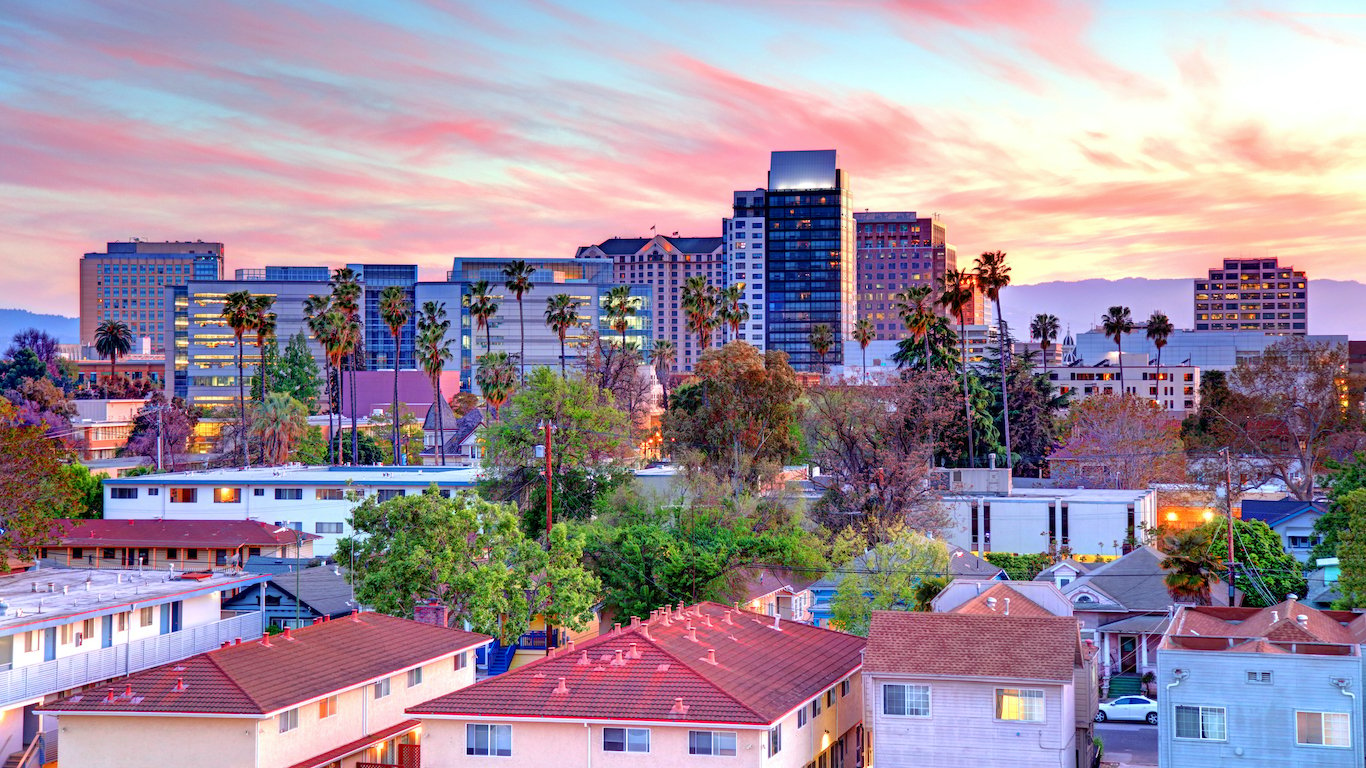
1. San Jose-Sunnyvale-Santa Clara, CA
> Median household income: $130,865
> Median income change 2018 to 2019: +$3,852 (+3.0%)
> Median home value: $1,116,400 (highest 10% of US metros)
> Adults with a bachelor’s degree: 52.7% (highest 10% of US metros)
> 2019 unemployment: 2.6% (lowest 10% of US metros)
Contact [email protected] for any questions or corrections.