
The U.S. has reported more than 20,000,000 confirmed COVID-19 cases as of Jan. 4, 2021. More than 340,000 Americans have died of COVID-19 — the highest death toll of any country.
The virus has spread throughout the country in a way that has been difficult to predict, surging in one region, then showing signs of improvement, and then reappearing in other regions. Though local outbreaks may ebb and flow, the current surge in cases has been felt nearly nationwide, leading to new travel restrictions and business closures around the country.
Nationwide, there were an average of 59.0 daily new coronavirus cases per 100,000 Americans in the week ending Jan. 4, 2021. Cumulatively, the U.S. has reported 6,252.5 cases per 100,000 Americans, and 104.4 deaths per 100,000 Americans.
The extent of the spread of the novel coronavirus continues to vary considerably from state to state, and even from county to county. Even as the number of daily new cases is flattening or even declining in some parts of the country, new cases are surging in others.
The coronavirus has spread to different parts of the country in different stages throughout the pandemic. In the spring, the worst hit states were in the Northeast, as New York City became the epicenter of the nation’s crisis. The virus spread to states throughout the Sun Belt in the summer, and hit states in the Midwest and West during the fall. Now, nearly every state is categorized as a COVID-19 hotspot, according to definitions based on new cases per capita from the nonprofit health organization Kaiser Family Foundation.
To determine the county in each state with the highest rate of daily cases of the virus, 24/7 Wall St. compiled and reviewed data from state and local health departments. We ranked counties according to the average new number of cases per 100,000 residents per day during the week ending Jan. 4, 2021. Population data used to adjust case and death totals came from the U.S. Census Bureau’s 2018 American Community Survey and are five-year estimates.

Alabama: Bullock County
> Avg. new daily cases in Bullock County in week ending Jan. 4, 2021: 113.4 per 100,000
> Cumulative confirmed COVID-19 cases in Bullock County as of Jan. 4, 2021: 910 (8,790.60 per 100,000)
> Cumulative confirmed COVID-19 deaths in Bullock County as of Jan. 4, 2021: 22 (212.5 per 100,000)
> Population: 10,352
> Largest place in Bullock County: Union Springs
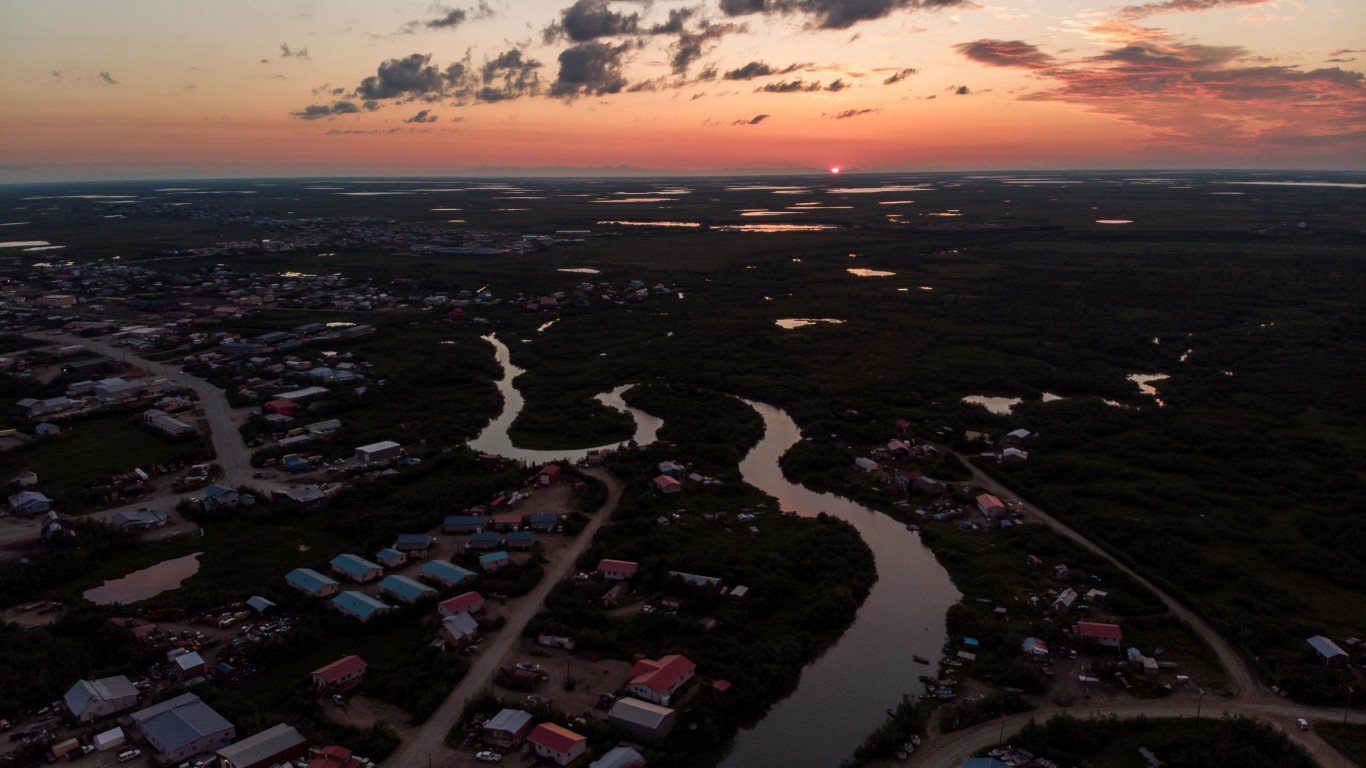
Alaska: Bethel Census Area
> Avg. new daily cases in Bethel Census Area in week ending Jan. 4, 2021: 60.6 per 100,000
> Cumulative confirmed COVID-19 cases in Bethel Census Area as of Jan. 4, 2021: 1,753 (9,717.30 per 100,000)
> Cumulative confirmed COVID-19 deaths in Bethel Census Area as of Jan. 4, 2021: 11 (61 per 100,000)
> Population: 18,040
> Largest place in Bethel Census Area: Bethel
These are all the counties in Alaska where COVID-19 is slowing (and where it’s still getting worse).

Arizona: La Paz County
> Avg. new daily cases in La Paz County in week ending Jan. 4, 2021: 145.4 per 100,000
> Cumulative confirmed COVID-19 cases in La Paz County as of Jan. 4, 2021: 1,621 (7,830.50 per 100,000)
> Cumulative confirmed COVID-19 deaths in La Paz County as of Jan. 4, 2021: 35 (169.1 per 100,000)
> Population: 20,701
> Largest place in La Paz County: Quartzsite

Arkansas: Izard County
> Avg. new daily cases in Izard County in week ending Jan. 4, 2021: 186.8 per 100,000
> Cumulative confirmed COVID-19 cases in Izard County as of Jan. 4, 2021: 1,615 (11,910.90 per 100,000)
> Cumulative confirmed COVID-19 deaths in Izard County as of Jan. 4, 2021: 21 (154.9 per 100,000)
> Population: 13,559
> Largest place in Izard County: Horseshoe Bend

California: San Bernardino County
> Avg. new daily cases in San Bernardino County in week ending Jan. 4, 2021: 146.8 per 100,000
> Cumulative confirmed COVID-19 cases in San Bernardino County as of Jan. 4, 2021: 208,271 (9,753.20 per 100,000)
> Cumulative confirmed COVID-19 deaths in San Bernardino County as of Jan. 4, 2021: 1,447 (67.8 per 100,000)
> Population: 2,135,413
> Largest place in San Bernardino County: San Bernardino
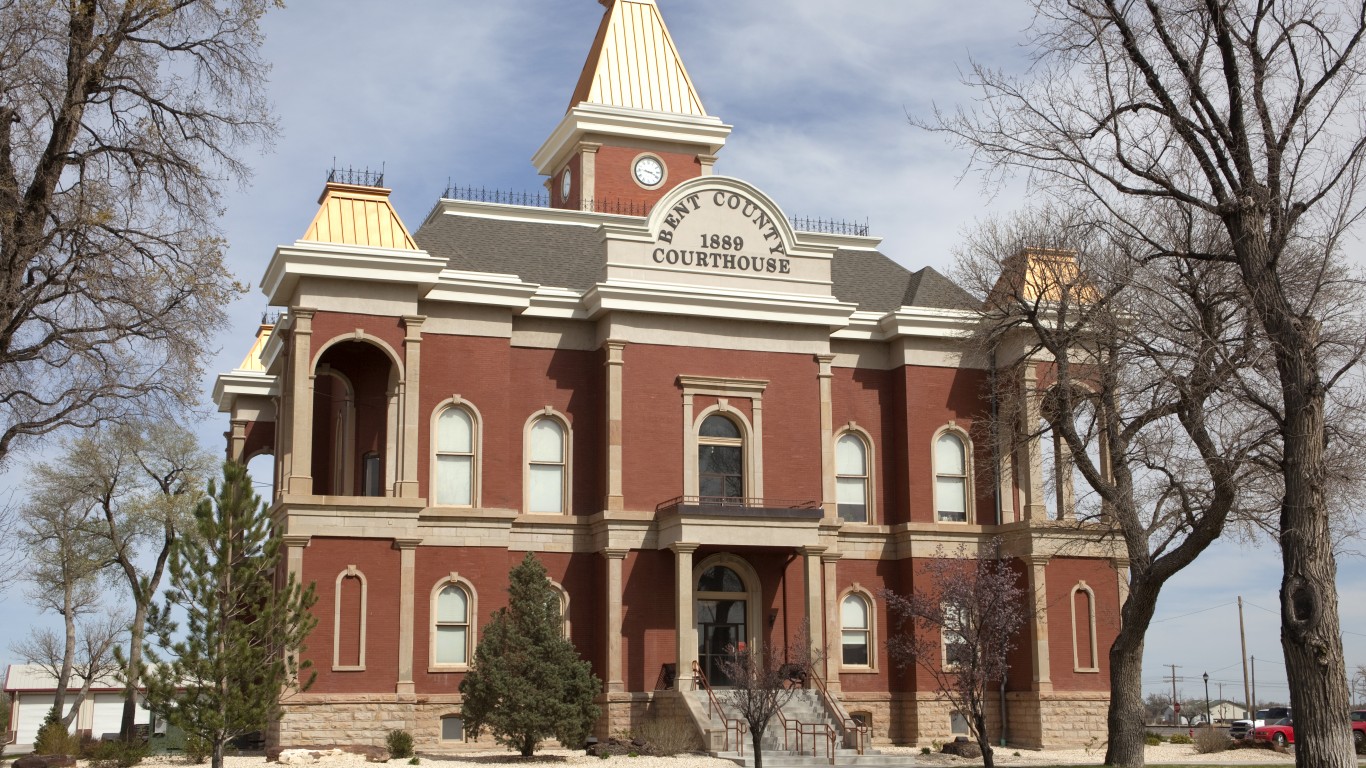
Colorado: Bent County
> Avg. new daily cases in Bent County in week ending Jan. 4, 2021: 274 per 100,000
> Cumulative confirmed COVID-19 cases in Bent County as of Jan. 4, 2021: 1,143 (19,676.40 per 100,000)
> Cumulative confirmed COVID-19 deaths in Bent County as of Jan. 4, 2021: 12 (206.6 per 100,000)
> Population: 5,809
> Largest place in Bent County: Las Animas

Connecticut: Windham County
> Avg. new daily cases in Windham County in week ending Jan. 4, 2021: 74 per 100,000
> Cumulative confirmed COVID-19 cases in Windham County as of Jan. 4, 2021: 5,555 (4,766.70 per 100,000)
> Cumulative confirmed COVID-19 deaths in Windham County as of Jan. 4, 2021: 86 (73.8 per 100,000)
> Population: 116,538
> Largest place in Windham County: Willimantic

Delaware: Kent County
> Avg. new daily cases in Kent County in week ending Jan. 4, 2021: 68.5 per 100,000
> Cumulative confirmed COVID-19 cases in Kent County as of Jan. 4, 2021: 9,733 (5,567.40 per 100,000)
> Cumulative confirmed COVID-19 deaths in Kent County as of Jan. 4, 2021: 168 (96.1 per 100,000)
> Population: 174,822
> Largest place in Kent County: Dover

Florida: Calhoun County
> Avg. new daily cases in Calhoun County in week ending Jan. 4, 2021: 102.4 per 100,000
> Cumulative confirmed COVID-19 cases in Calhoun County as of Jan. 4, 2021: 1,287 (8,910.30 per 100,000)
> Cumulative confirmed COVID-19 deaths in Calhoun County as of Jan. 4, 2021: 29 (200.8 per 100,000)
> Population: 14,444
> Largest place in Calhoun County: Blountstown

Georgia: Hancock County
> Avg. new daily cases in Hancock County in week ending Jan. 4, 2021: 120 per 100,000
> Cumulative confirmed COVID-19 cases in Hancock County as of Jan. 4, 2021: 648 (7,592.30 per 100,000)
> Cumulative confirmed COVID-19 deaths in Hancock County as of Jan. 4, 2021: 48 (562.4 per 100,000)
> Population: 8,535
> Largest place in Hancock County: Sparta

Hawaii: Maui County
> Avg. new daily cases in Maui County in week ending Jan. 4, 2021: 12.2 per 100,000
> Cumulative confirmed COVID-19 cases in Maui County as of Jan. 4, 2021: 1,198 (724.8 per 100,000)
> Cumulative confirmed COVID-19 deaths in Maui County as of Jan. 4, 2021: 17 (10.3 per 100,000)
> Population: 165,281
> Largest place in Maui County: Kahului
These are all the counties in Hawaii where COVID-19 is slowing (and where it’s still getting worse).
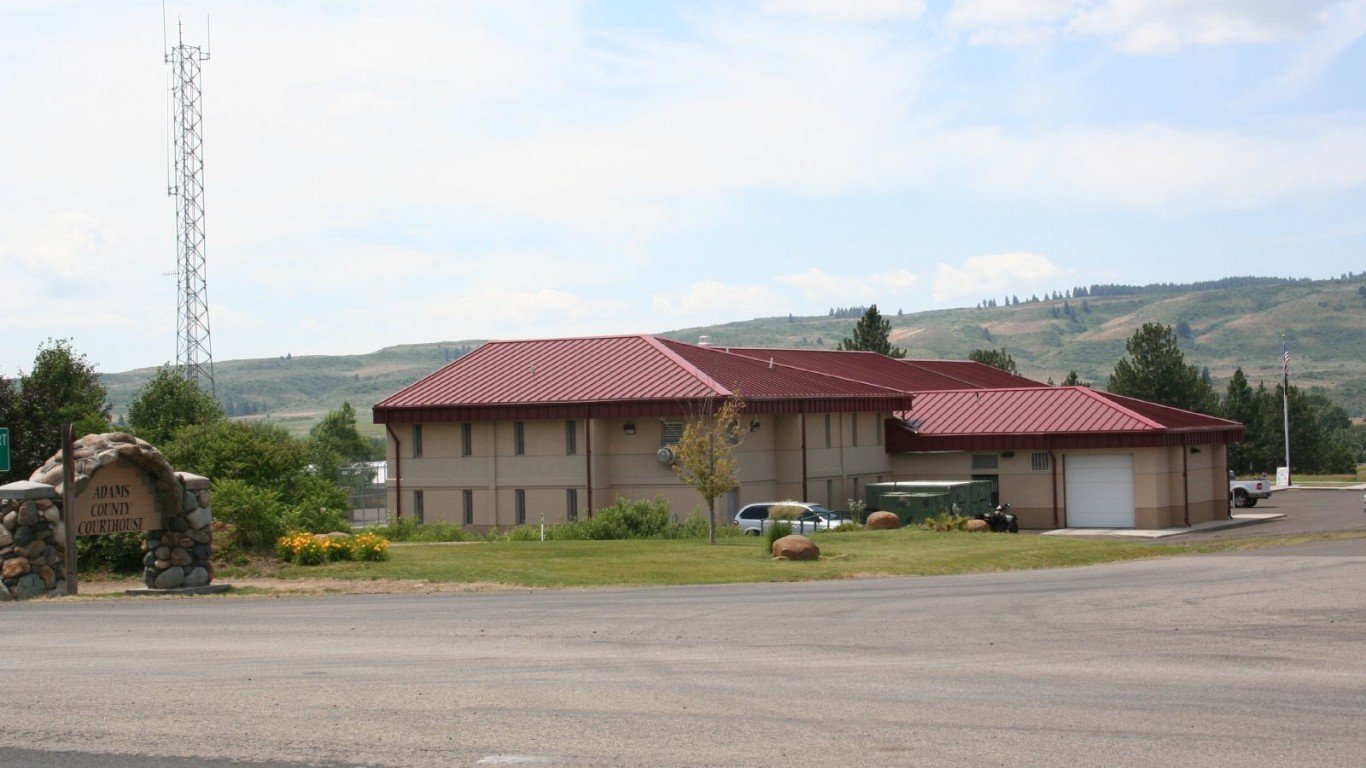
Idaho: Adams County
> Avg. new daily cases in Adams County in week ending Jan. 4, 2021: 141.7 per 100,000
> Cumulative confirmed COVID-19 cases in Adams County as of Jan. 4, 2021: 273 (6,792.70 per 100,000)
> Cumulative confirmed COVID-19 deaths in Adams County as of Jan. 4, 2021: 3 (74.6 per 100,000)
> Population: 4,019
> Largest place in Adams County: Council
These are all the counties in Idaho where COVID-19 is slowing (and where it’s still getting worse).
Illinois: Perry County
> Avg. new daily cases in Perry County in week ending Jan. 4, 2021: 182.2 per 100,000
> Cumulative confirmed COVID-19 cases in Perry County as of Jan. 4, 2021: 2,330 (10,896.00 per 100,000)
> Cumulative confirmed COVID-19 deaths in Perry County as of Jan. 4, 2021: 53 (247.8 per 100,000)
> Population: 21,384
> Largest place in Perry County: Du Quoin

Indiana: Dubois County
> Avg. new daily cases in Dubois County in week ending Jan. 4, 2021: 143.7 per 100,000
> Cumulative confirmed COVID-19 cases in Dubois County as of Jan. 4, 2021: 4,873 (11,488.00 per 100,000)
> Cumulative confirmed COVID-19 deaths in Dubois County as of Jan. 4, 2021: 61 (143.8 per 100,000)
> Population: 42,418
> Largest place in Dubois County: Jasper

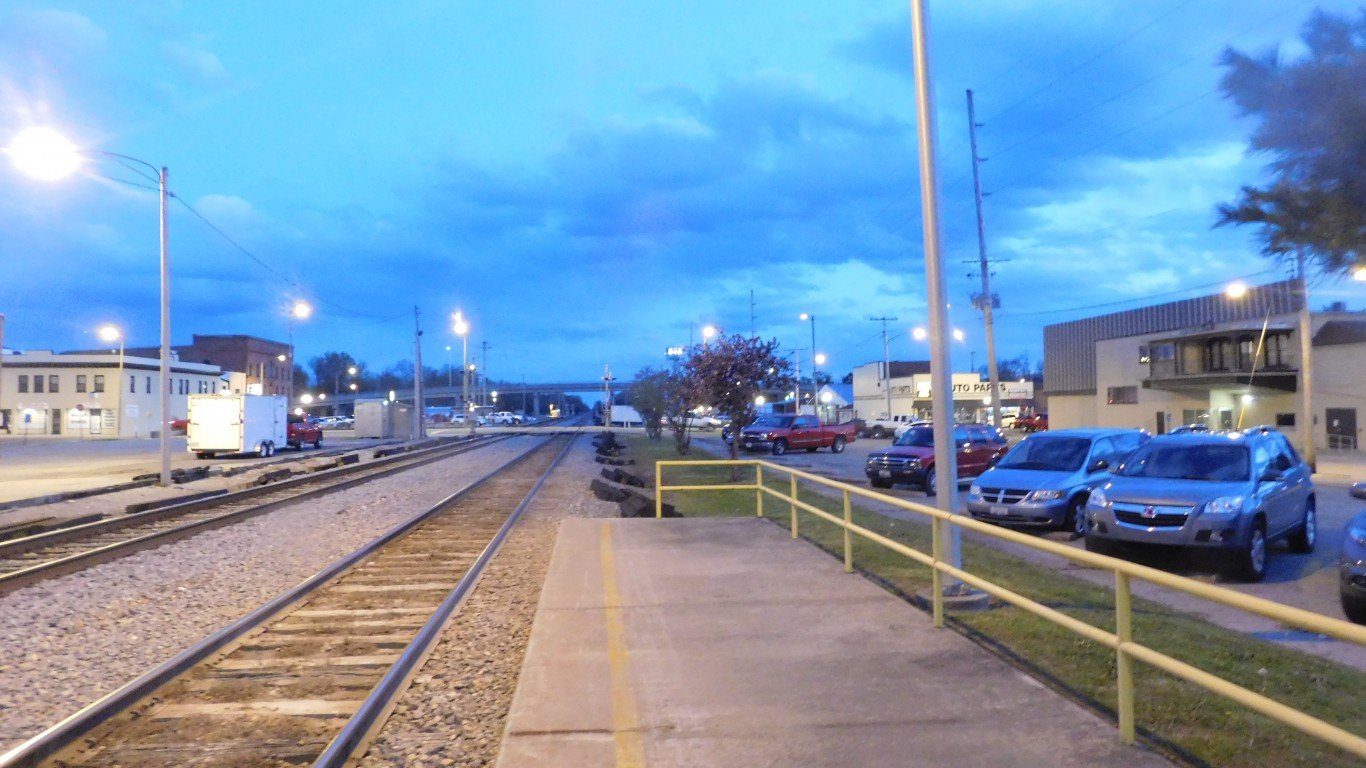
Iowa: Monroe County
> Avg. new daily cases in Monroe County in week ending Jan. 4, 2021: 115.2 per 100,000
> Cumulative confirmed COVID-19 cases in Monroe County as of Jan. 4, 2021: 696 (8,851.60 per 100,000)
> Cumulative confirmed COVID-19 deaths in Monroe County as of Jan. 4, 2021: 17 (216.2 per 100,000)
> Population: 7,863
> Largest place in Monroe County: Albia
These are all the counties in Iowa where COVID-19 is slowing (and where it’s still getting worse).

Kansas: Labette County
> Avg. new daily cases in Labette County in week ending Jan. 4, 2021: 166.3 per 100,000
> Cumulative confirmed COVID-19 cases in Labette County as of Jan. 4, 2021: 1,890 (9,279.70 per 100,000)
> Cumulative confirmed COVID-19 deaths in Labette County as of Jan. 4, 2021: N/A (N/A per 100,000)
> Population: 20,367
> Largest place in Labette County: Parsons
These are all the counties in Kansas where COVID-19 is slowing (and where it’s still getting worse).

Kentucky: Boyle County
> Avg. new daily cases in Boyle County in week ending Jan. 4, 2021: 176.3 per 100,000
> Cumulative confirmed COVID-19 cases in Boyle County as of Jan. 4, 2021: 2,418 (8,083.40 per 100,000)
> Cumulative confirmed COVID-19 deaths in Boyle County as of Jan. 4, 2021: 4 (13.4 per 100,000)
> Population: 29,913
> Largest place in Boyle County: Danville

Louisiana: Grant Parish
> Avg. new daily cases in Grant Parish in week ending Jan. 4, 2021: 101.5 per 100,000
> Cumulative confirmed COVID-19 cases in Grant Parish as of Jan. 4, 2021: 1,528 (6,837.30 per 100,000)
> Cumulative confirmed COVID-19 deaths in Grant Parish as of Jan. 4, 2021: 40 (179 per 100,000)
> Population: 22,348
> Largest place in Grant Parish: Colfax

Maine: York County
> Avg. new daily cases in York County in week ending Jan. 4, 2021: 63.1 per 100,000
> Cumulative confirmed COVID-19 cases in York County as of Jan. 4, 2021: 5,567 (2,741.00 per 100,000)
> Cumulative confirmed COVID-19 deaths in York County as of Jan. 4, 2021: 65 (32 per 100,000)
> Population: 203,102
> Largest place in York County: Biddeford
These are all the counties in Maine where COVID-19 is slowing (and where it’s still getting worse).

Maryland: Washington County
> Avg. new daily cases in Washington County in week ending Jan. 4, 2021: 96.2 per 100,000
> Cumulative confirmed COVID-19 cases in Washington County as of Jan. 4, 2021: 8,766 (5,851.40 per 100,000)
> Cumulative confirmed COVID-19 deaths in Washington County as of Jan. 4, 2021: 157 (104.8 per 100,000)
> Population: 149,811
> Largest place in Washington County: Hagerstown

Massachusetts: Bristol County
> Avg. new daily cases in Bristol County in week ending Jan. 4, 2021: 88.3 per 100,000
> Cumulative confirmed COVID-19 cases in Bristol County as of Jan. 4, 2021: 36,074 (6,454.40 per 100,000)
> Cumulative confirmed COVID-19 deaths in Bristol County as of Jan. 4, 2021: 1,089 (194.8 per 100,000)
> Population: 558,905
> Largest place in Bristol County: New Bedford

Michigan: Missaukee County
> Avg. new daily cases in Missaukee County in week ending Jan. 4, 2021: 58.9 per 100,000
> Cumulative confirmed COVID-19 cases in Missaukee County as of Jan. 4, 2021: 515 (3,432.00 per 100,000)
> Cumulative confirmed COVID-19 deaths in Missaukee County as of Jan. 4, 2021: 9 (60 per 100,000)
> Population: 15,006
> Largest place in Missaukee County: Lake City
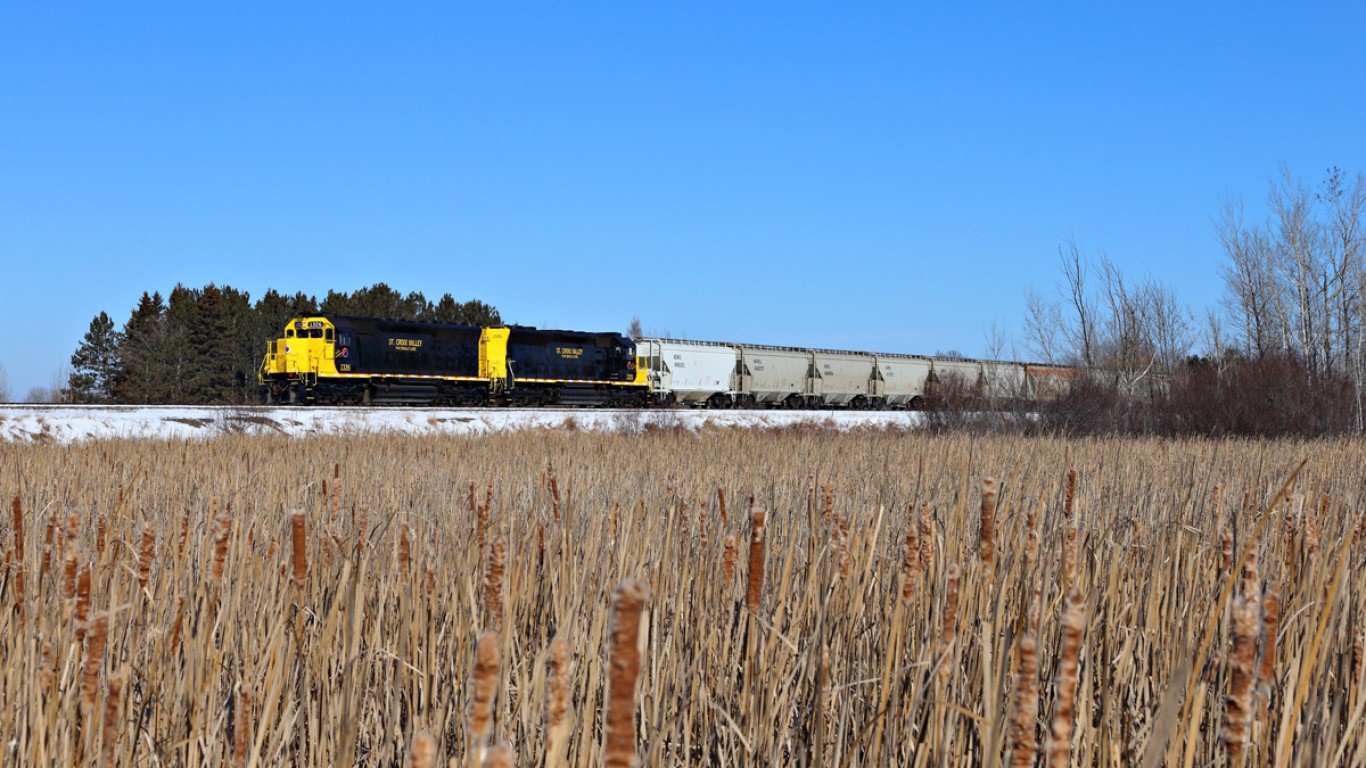
Minnesota: Pine County
> Avg. new daily cases in Pine County in week ending Jan. 4, 2021: 74.3 per 100,000
> Cumulative confirmed COVID-19 cases in Pine County as of Jan. 4, 2021: 2,534 (8,699.20 per 100,000)
> Cumulative confirmed COVID-19 deaths in Pine County as of Jan. 4, 2021: 12 (41.2 per 100,000)
> Population: 29,129
> Largest place in Pine County: Pine City

Mississippi: Jasper County
> Avg. new daily cases in Jasper County in week ending Jan. 4, 2021: 135.4 per 100,000
> Cumulative confirmed COVID-19 cases in Jasper County as of Jan. 4, 2021: 1,500 (9,075.00 per 100,000)
> Cumulative confirmed COVID-19 deaths in Jasper County as of Jan. 4, 2021: 26 (157.3 per 100,000)
> Population: 16,529
> Largest place in Jasper County: Bay Springs
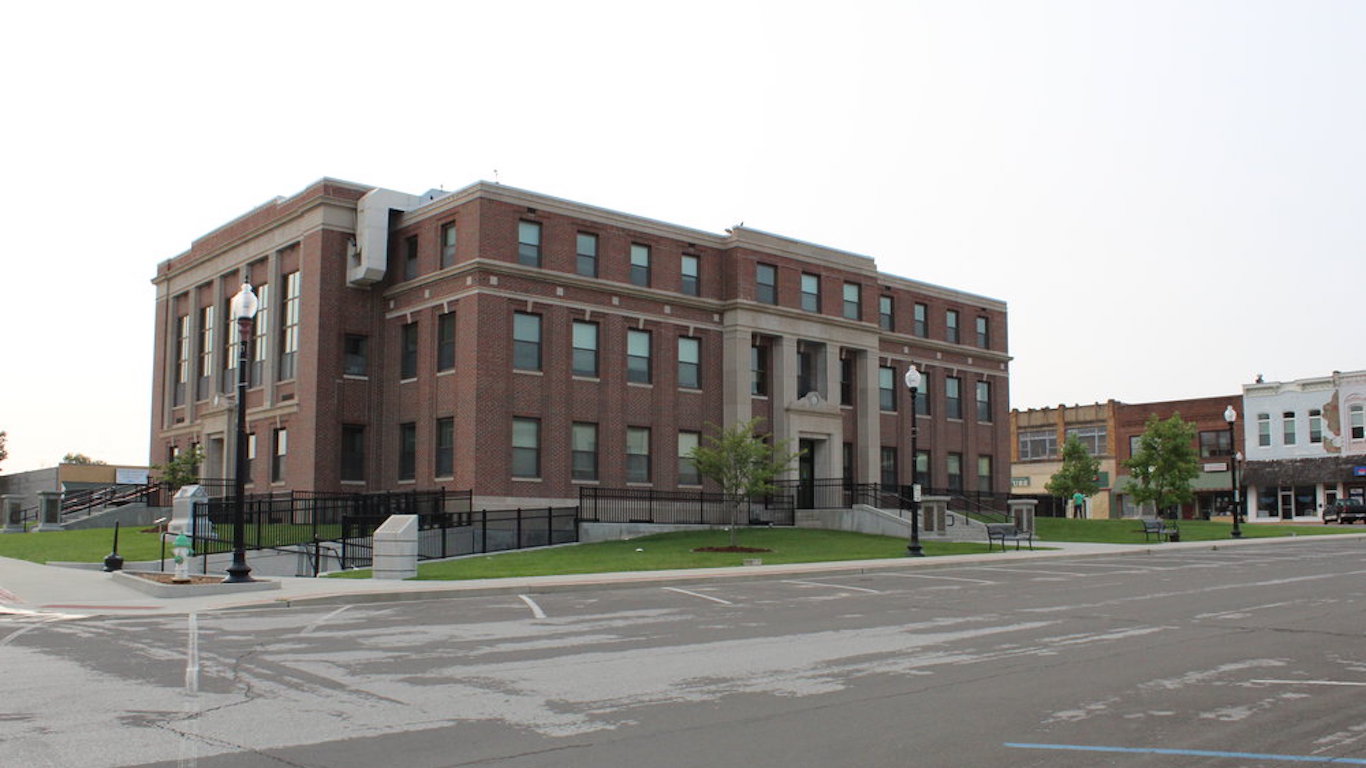
Missouri: Audrain County
> Avg. new daily cases in Audrain County in week ending Jan. 4, 2021: 111.4 per 100,000
> Cumulative confirmed COVID-19 cases in Audrain County as of Jan. 4, 2021: 1,834 (7,126.50 per 100,000)
> Cumulative confirmed COVID-19 deaths in Audrain County as of Jan. 4, 2021: 32 (124.3 per 100,000)
> Population: 25,735
> Largest place in Audrain County: Mexico

Montana: Lewis and Clark County
> Avg. new daily cases in Lewis and Clark County in week ending Jan. 4, 2021: 63.6 per 100,000
> Cumulative confirmed COVID-19 cases in Lewis and Clark County as of Jan. 4, 2021: 4,941 (7,366.20 per 100,000)
> Cumulative confirmed COVID-19 deaths in Lewis and Clark County as of Jan. 4, 2021: 42 (62.6 per 100,000)
> Population: 67,077
> Largest place in Lewis and Clark County: Helena

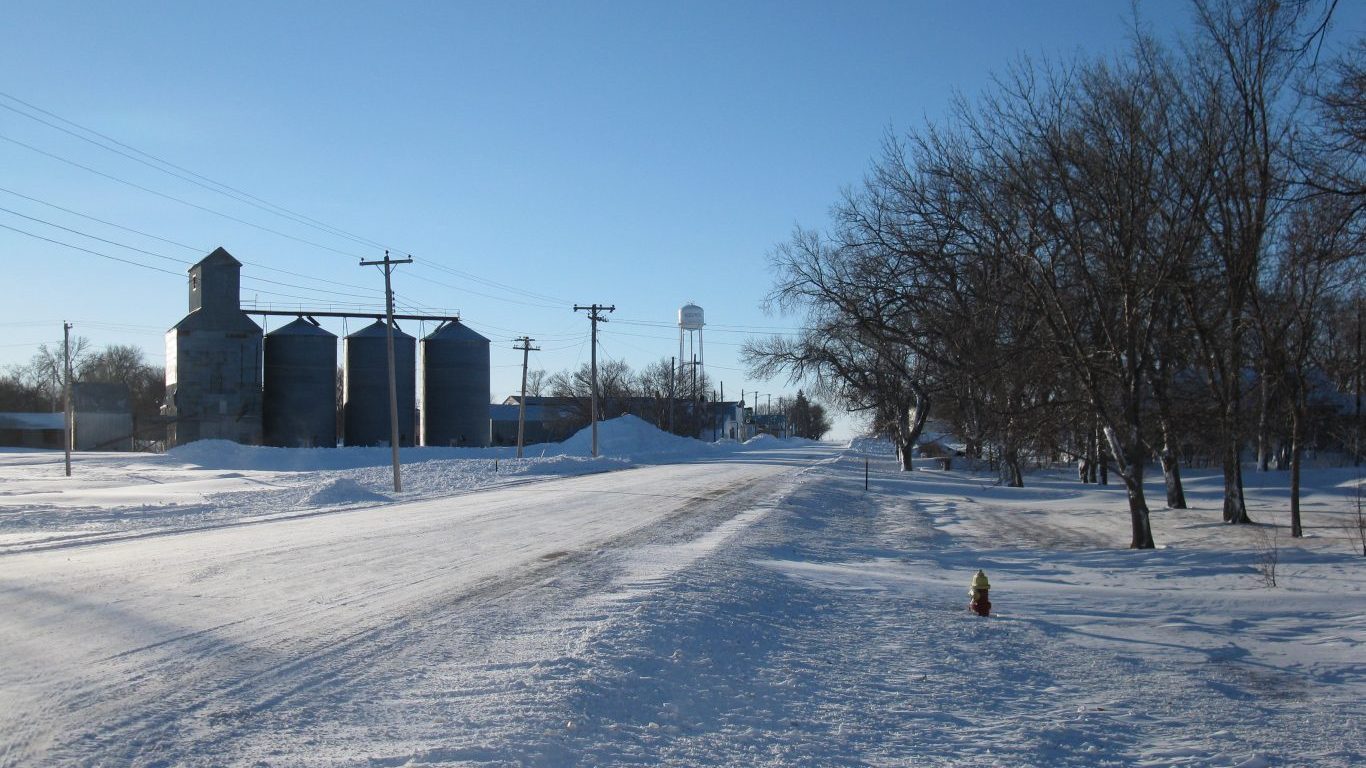
Nebraska: Johnson County
> Avg. new daily cases in Johnson County in week ending Jan. 4, 2021: 139 per 100,000
> Cumulative confirmed COVID-19 cases in Johnson County as of Jan. 4, 2021: 545 (10,486.80 per 100,000)
> Cumulative confirmed COVID-19 deaths in Johnson County as of Jan. 4, 2021: 5 (96.2 per 100,000)
> Population: 5,197
> Largest place in Johnson County: Tecumseh

Nevada: Pershing County
> Avg. new daily cases in Pershing County in week ending Jan. 4, 2021: 1,063.50 per 100,000
> Cumulative confirmed COVID-19 cases in Pershing County as of Jan. 4, 2021: 832 (12,585.10 per 100,000)
> Cumulative confirmed COVID-19 deaths in Pershing County as of Jan. 4, 2021: 10 (151.3 per 100,000)
> Population: 6,611
> Largest place in Pershing County: Lovelock
These are all the counties in Nevada where COVID-19 is slowing (and where it’s still getting worse).

New Hampshire: Hillsborough County
> Avg. new daily cases in Hillsborough County in week ending Jan. 4, 2021: 65.9 per 100,000
> Cumulative confirmed COVID-19 cases in Hillsborough County as of Jan. 4, 2021: 18,954 (4,610.70 per 100,000)
> Cumulative confirmed COVID-19 deaths in Hillsborough County as of Jan. 4, 2021: 445 (108.2 per 100,000)
> Population: 411,087
> Largest place in Hillsborough County: Manchester
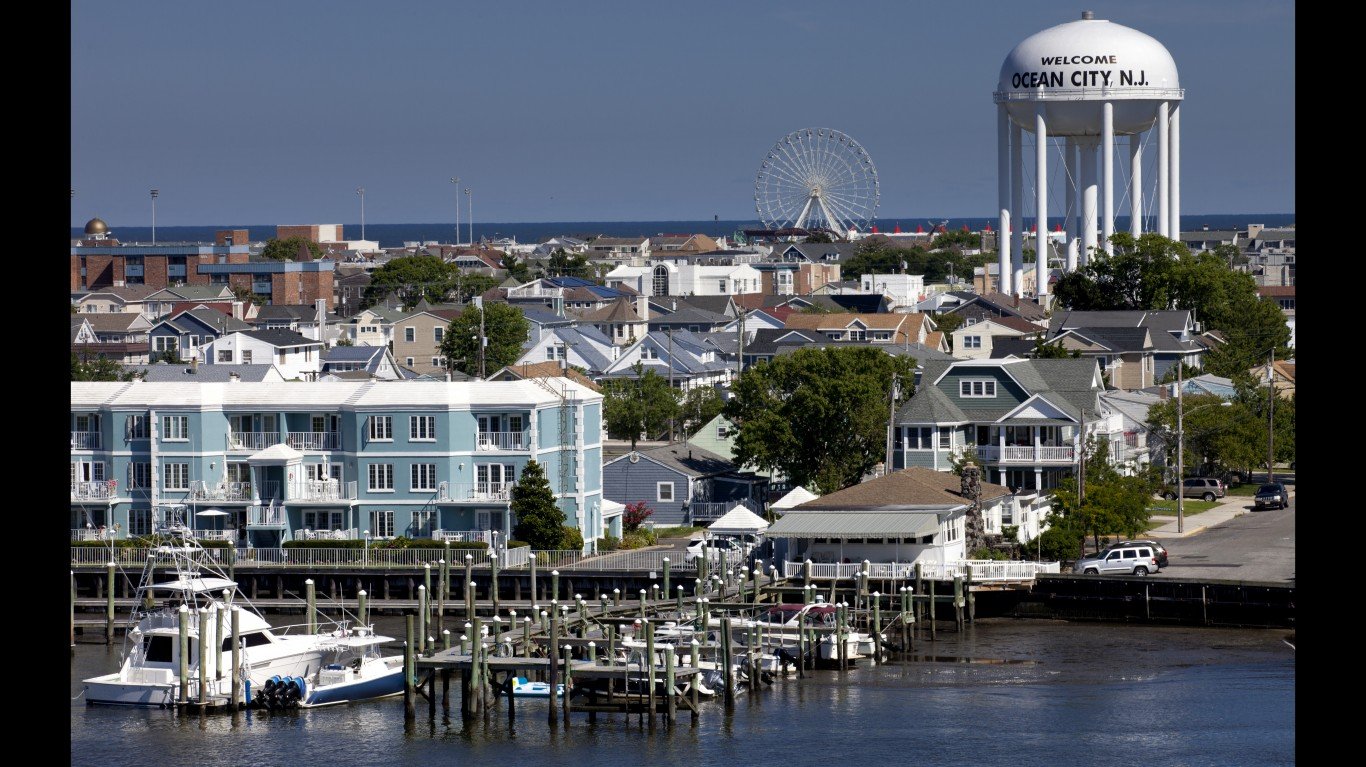
New Jersey: Cape May County
> Avg. new daily cases in Cape May County in week ending Jan. 4, 2021: 352.7 per 100,000
> Cumulative confirmed COVID-19 cases in Cape May County as of Jan. 4, 2021: 4,710 (5,026.40 per 100,000)
> Cumulative confirmed COVID-19 deaths in Cape May County as of Jan. 4, 2021: 138 (147.3 per 100,000)
> Population: 93,705
> Largest place in Cape May County: Ocean City

New Mexico: McKinley County
> Avg. new daily cases in McKinley County in week ending Jan. 4, 2021: 97.7 per 100,000
> Cumulative confirmed COVID-19 cases in McKinley County as of Jan. 4, 2021: 10,031 (13,769.60 per 100,000)
> Cumulative confirmed COVID-19 deaths in McKinley County as of Jan. 4, 2021: 355 (487.3 per 100,000)
> Population: 72,849
> Largest place in McKinley County: Gallup

New York: Oneida County
> Avg. new daily cases in Oneida County in week ending Jan. 4, 2021: 117.9 per 100,000
> Cumulative confirmed COVID-19 cases in Oneida County as of Jan. 4, 2021: 13,269 (5,749.60 per 100,000)
> Cumulative confirmed COVID-19 deaths in Oneida County as of Jan. 4, 2021: 268 (116.1 per 100,000)
> Population: 230,782
> Largest place in Oneida County: Utica

North Carolina: Hyde County
> Avg. new daily cases in Hyde County in week ending Jan. 4, 2021: 177.5 per 100,000
> Cumulative confirmed COVID-19 cases in Hyde County as of Jan. 4, 2021: 366 (6,786.60 per 100,000)
> Cumulative confirmed COVID-19 deaths in Hyde County as of Jan. 4, 2021: 5 (92.7 per 100,000)
> Population: 5,393
> Largest place in Hyde County: Ocracoke
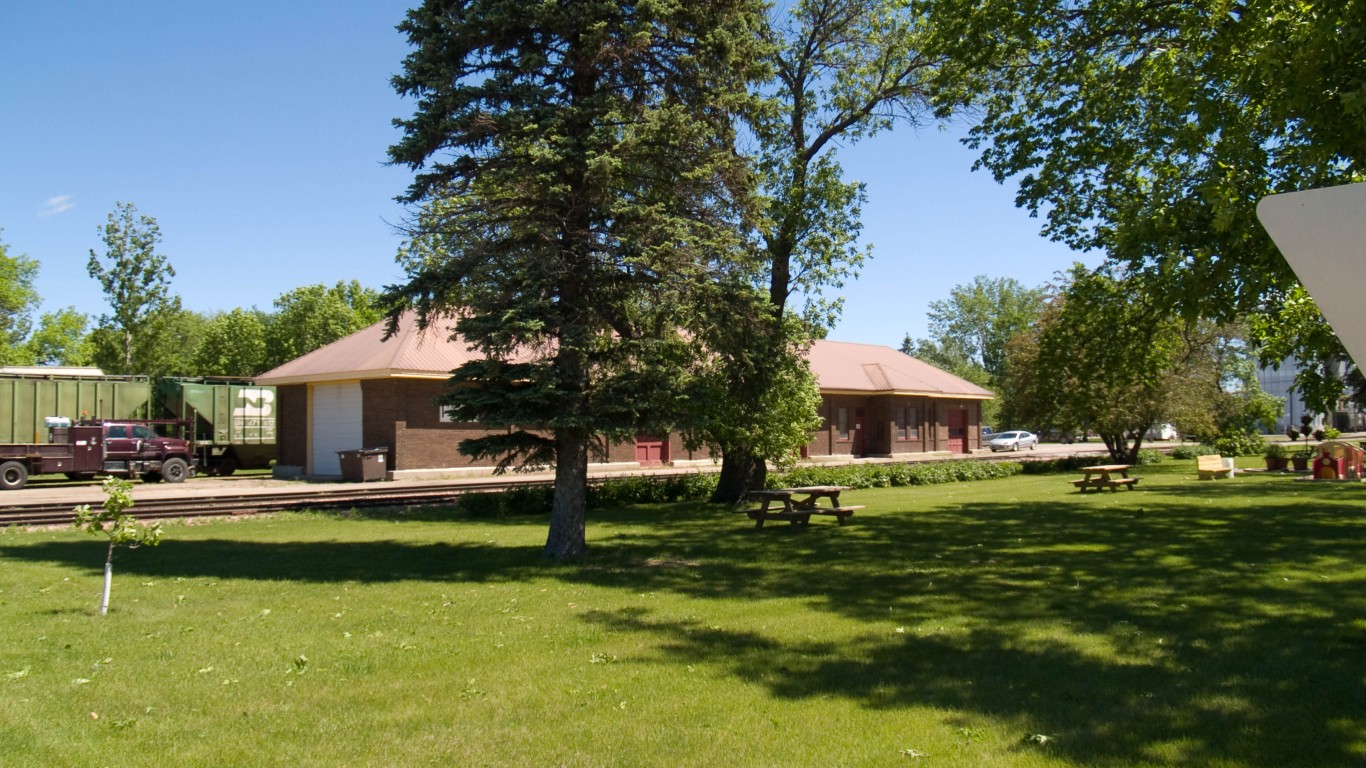
North Dakota: Eddy County
> Avg. new daily cases in Eddy County in week ending Jan. 4, 2021: 119.1 per 100,000
> Cumulative confirmed COVID-19 cases in Eddy County as of Jan. 4, 2021: 414 (17,898.80 per 100,000)
> Cumulative confirmed COVID-19 deaths in Eddy County as of Jan. 4, 2021: 6 (259.4 per 100,000)
> Population: 2,313
> Largest place in Eddy County: New Rockford

Ohio: Pickaway County
> Avg. new daily cases in Pickaway County in week ending Jan. 4, 2021: 97 per 100,000
> Cumulative confirmed COVID-19 cases in Pickaway County as of Jan. 4, 2021: 6,341 (11,043.20 per 100,000)
> Cumulative confirmed COVID-19 deaths in Pickaway County as of Jan. 4, 2021: 50 (87.1 per 100,000)
> Population: 57,420
> Largest place in Pickaway County: Circleville
These are all the counties in Ohio where COVID-19 is slowing (and where it’s still getting worse).

Oklahoma: Woods County
> Avg. new daily cases in Woods County in week ending Jan. 4, 2021: 178.4 per 100,000
> Cumulative confirmed COVID-19 cases in Woods County as of Jan. 4, 2021: 1,026 (11,241.40 per 100,000)
> Cumulative confirmed COVID-19 deaths in Woods County as of Jan. 4, 2021: 5 (54.8 per 100,000)
> Population: 9,127
> Largest place in Woods County: Alva

Oregon: Jefferson County
> Avg. new daily cases in Jefferson County in week ending Jan. 4, 2021: 68.3 per 100,000
> Cumulative confirmed COVID-19 cases in Jefferson County as of Jan. 4, 2021: 1,540 (6,654.30 per 100,000)
> Cumulative confirmed COVID-19 deaths in Jefferson County as of Jan. 4, 2021: 18 (77.8 per 100,000)
> Population: 23,143
> Largest place in Jefferson County: Madras
These are all the counties in Oregon where COVID-19 is slowing (and where it’s still getting worse).

Pennsylvania: Forest County
> Avg. new daily cases in Forest County in week ending Jan. 4, 2021: 110.8 per 100,000
> Cumulative confirmed COVID-19 cases in Forest County as of Jan. 4, 2021: 340 (4,625.20 per 100,000)
> Cumulative confirmed COVID-19 deaths in Forest County as of Jan. 4, 2021: 4 (54.4 per 100,000)
> Population: 7,351
> Largest place in Forest County: Tionesta

Rhode Island: Bristol County
> Avg. new daily cases in Bristol County in week ending Jan. 4, 2021: 95 per 100,000
> Cumulative confirmed COVID-19 cases in Bristol County as of Jan. 4, 2021: 2,403 (4,914.10 per 100,000)
> Cumulative confirmed COVID-19 deaths in Bristol County as of Jan. 4, 2021: N/A (N/A per 100,000)
> Population: 48,900
> Largest place in Bristol County: Bristol

South Carolina: Florence County
> Avg. new daily cases in Florence County in week ending Jan. 4, 2021: 109.5 per 100,000
> Cumulative confirmed COVID-19 cases in Florence County as of Jan. 4, 2021: 11,340 (8,184.10 per 100,000)
> Cumulative confirmed COVID-19 deaths in Florence County as of Jan. 4, 2021: 268 (193.4 per 100,000)
> Population: 138,561
> Largest place in Florence County: Florence
South Dakota: Edmunds County
> Avg. new daily cases in Edmunds County in week ending Jan. 4, 2021: 115.5 per 100,000
> Cumulative confirmed COVID-19 cases in Edmunds County as of Jan. 4, 2021: 387 (9,822.30 per 100,000)
> Cumulative confirmed COVID-19 deaths in Edmunds County as of Jan. 4, 2021: 4 (101.5 per 100,000)
> Population: 3,940
> Largest place in Edmunds County: Ipswich

Tennessee: Moore County
> Avg. new daily cases in Moore County in week ending Jan. 4, 2021: 146.9 per 100,000
> Cumulative confirmed COVID-19 cases in Moore County as of Jan. 4, 2021: 720 (11,388.80 per 100,000)
> Cumulative confirmed COVID-19 deaths in Moore County as of Jan. 4, 2021: 6 (94.9 per 100,000)
> Population: 6,322
> Largest place in Moore County: Lynchburg

Texas: Wilbarger County
> Avg. new daily cases in Wilbarger County in week ending Jan. 4, 2021: 167.5 per 100,000
> Cumulative confirmed COVID-19 cases in Wilbarger County as of Jan. 4, 2021: 1,380 (10,692.70 per 100,000)
> Cumulative confirmed COVID-19 deaths in Wilbarger County as of Jan. 4, 2021: 33 (255.7 per 100,000)
> Population: 12,906
> Largest place in Wilbarger County: Vernon
These are all the counties in Texas where COVID-19 is slowing (and where it’s still getting worse).

Utah: Utah County
> Avg. new daily cases in Utah County in week ending Jan. 4, 2021: 94.8 per 100,000
> Cumulative confirmed COVID-19 cases in Utah County as of Jan. 4, 2021: 69,491 (11,769.40 per 100,000)
> Cumulative confirmed COVID-19 deaths in Utah County as of Jan. 4, 2021: 219 (37.1 per 100,000)
> Population: 590,440
> Largest place in Utah County: Provo
These are all the counties in Utah where COVID-19 is slowing (and where it’s still getting worse).

Vermont: Bennington County
> Avg. new daily cases in Bennington County in week ending Jan. 4, 2021: 30.6 per 100,000
> Cumulative confirmed COVID-19 cases in Bennington County as of Jan. 4, 2021: 546 (1,520.00 per 100,000)
> Cumulative confirmed COVID-19 deaths in Bennington County as of Jan. 4, 2021: 3 (8.4 per 100,000)
> Population: 35,920
> Largest place in Bennington County: Bennington
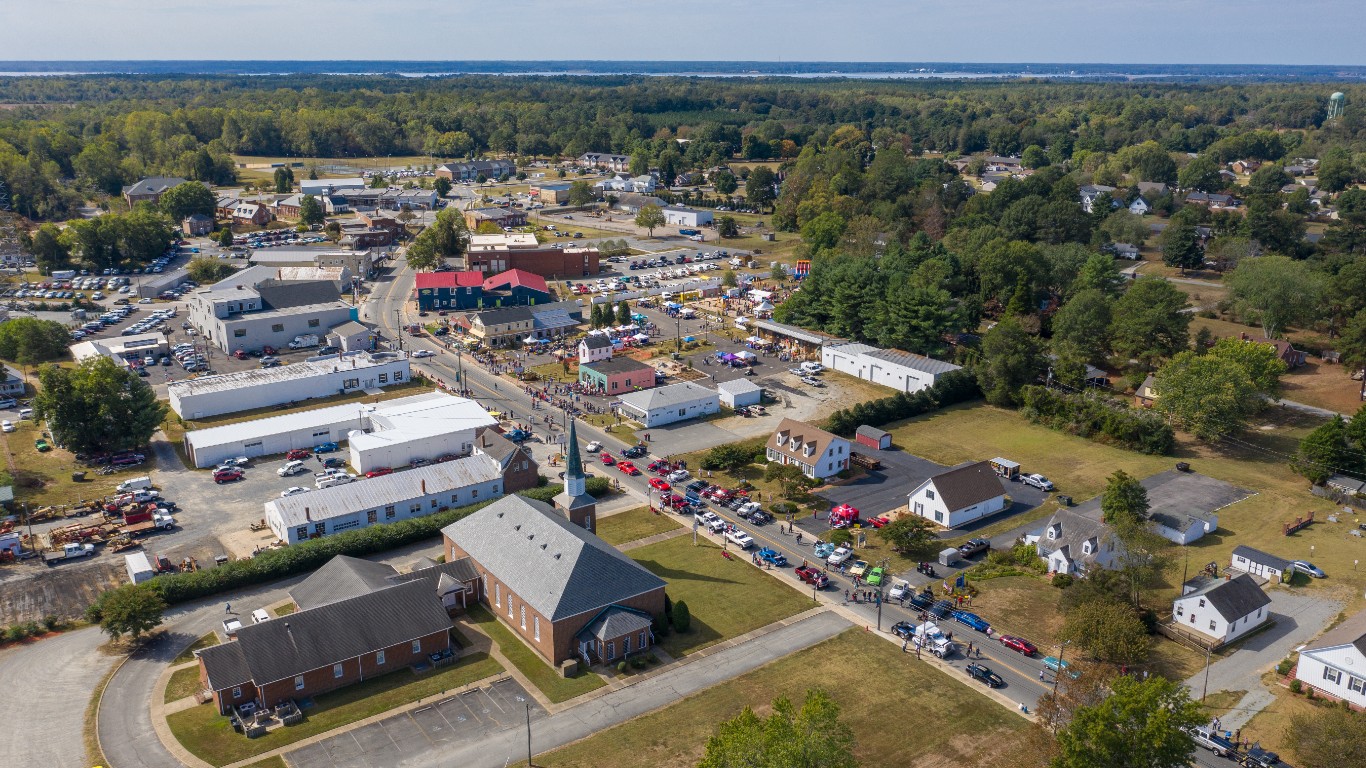
Virginia: Richmond County
> Avg. new daily cases in Richmond County in week ending Jan. 4, 2021: 137 per 100,000
> Cumulative confirmed COVID-19 cases in Richmond County as of Jan. 4, 2021: 849 (9,563.00 per 100,000)
> Cumulative confirmed COVID-19 deaths in Richmond County as of Jan. 4, 2021: 5 (56.3 per 100,000)
> Population: 8,878
> Largest place in Richmond County: Warsaw

Washington: Garfield County
> Avg. new daily cases in Garfield County in week ending Jan. 4, 2021: 81.7 per 100,000
> Cumulative confirmed COVID-19 cases in Garfield County as of Jan. 4, 2021: 96 (4,316.60 per 100,000)
> Cumulative confirmed COVID-19 deaths in Garfield County as of Jan. 4, 2021: 2 (89.9 per 100,000)
> Population: 2,224
> Largest place in Garfield County: Pomeroy

West Virginia: Pleasants County
> Avg. new daily cases in Pleasants County in week ending Jan. 4, 2021: 269.1 per 100,000
> Cumulative confirmed COVID-19 cases in Pleasants County as of Jan. 4, 2021: 595 (7,925.90 per 100,000)
> Cumulative confirmed COVID-19 deaths in Pleasants County as of Jan. 4, 2021: 6 (79.9 per 100,000)
> Population: 7,507
> Largest place in Pleasants County: St. Marys
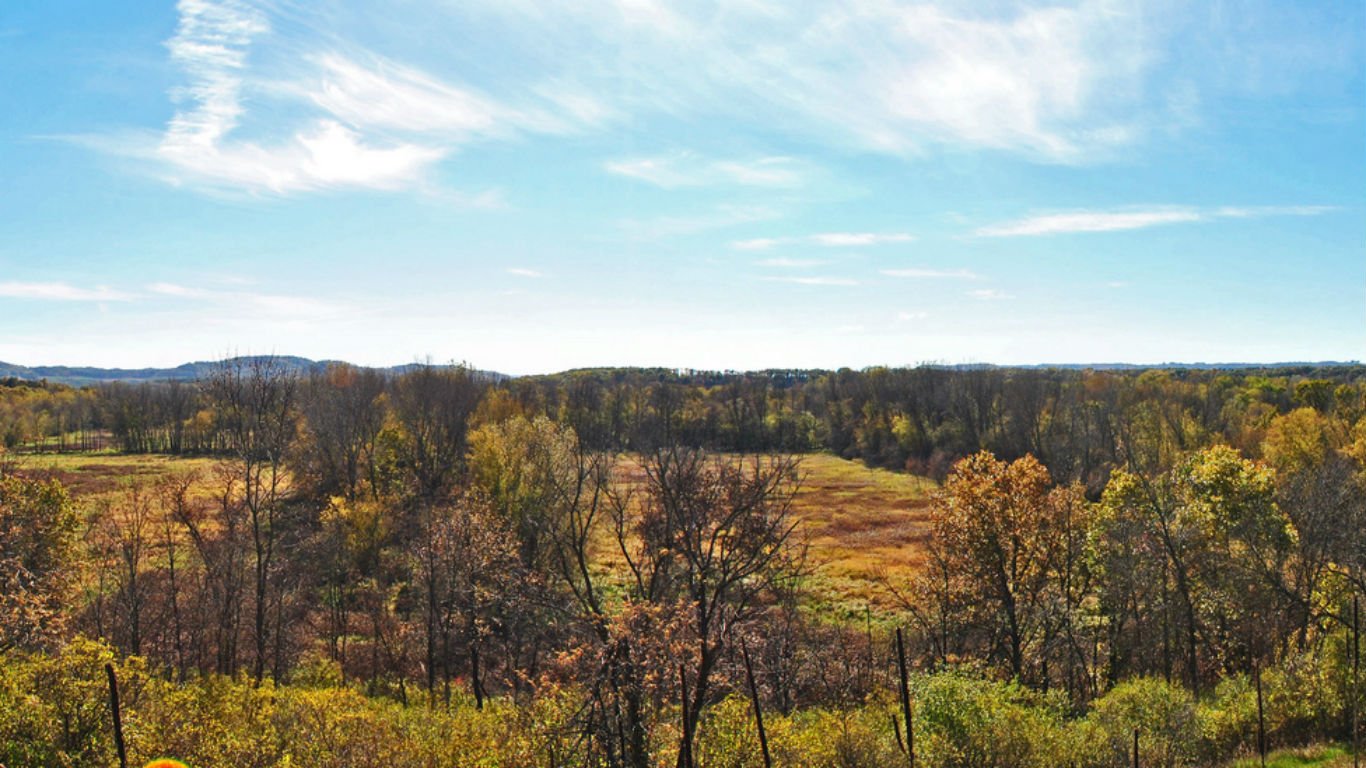
Wisconsin: Pepin County
> Avg. new daily cases in Pepin County in week ending Jan. 4, 2021: 88.2 per 100,000
> Cumulative confirmed COVID-19 cases in Pepin County as of Jan. 4, 2021: 681 (9,377.60 per 100,000)
> Cumulative confirmed COVID-19 deaths in Pepin County as of Jan. 4, 2021: 5 (68.9 per 100,000)
> Population: 7,262
> Largest place in Pepin County: Durand
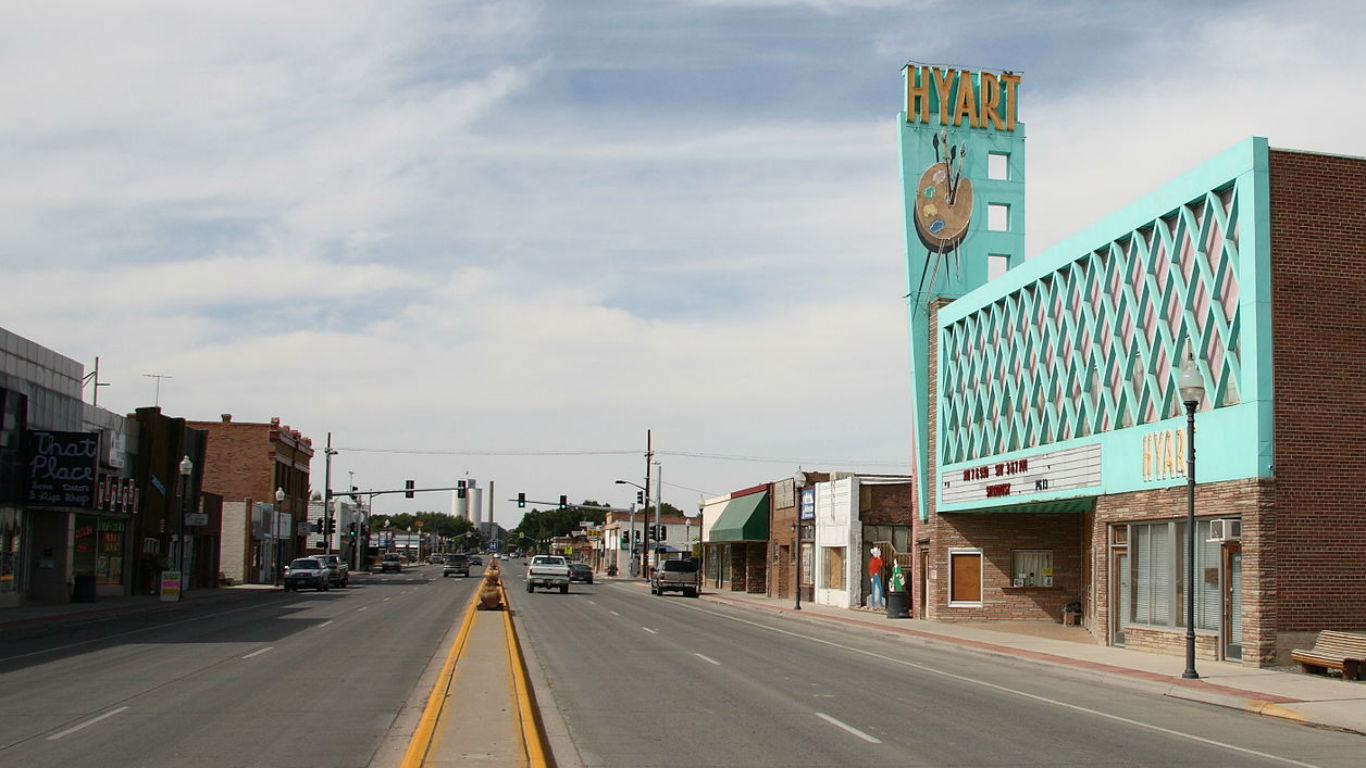
Wyoming: Big Horn County
> Avg. new daily cases in Big Horn County in week ending Jan. 4, 2021: 83.9 per 100,000
> Cumulative confirmed COVID-19 cases in Big Horn County as of Jan. 4, 2021: 824 (6,923.80 per 100,000)
> Cumulative confirmed COVID-19 deaths in Big Horn County as of Jan. 4, 2021: 21 (176.5 per 100,000)
> Population: 11,901
> Largest place in Big Horn County: Lovell
Click here to see all coronavirus data for every state.
Contact [email protected] for any questions or corrections.