Vaccine distribution is well underway across the United States. Still, the novel coronavirus continues to spread and claim American lives. In the past week alone, there were an average of 3,272 new deaths attributed to the virus every day.
Since the first COVID-19-related death was reported in the United States on Feb. 29, 2020, there have been a total of 387,551 COVID-19 deaths nationwide, equal to about 118 for every 100,000 Americans.
Of course, deaths attributable to the virus are not evenly spread across the country. While there are still counties and county equivalents that have not reported a single COVID-19 death, nearly every state has at least one county where the number of deaths attributable to the virus per capita exceeds the national rate — sometimes by orders of magnitude. There are 18 states home to at least one county where COVID-19 deaths per capita are at least three times higher than they are nationwide. In one county in South Dakota, there have been a total of 789 coronavirus deaths for every 100,000 people.
Counties and county equivalents where COVID-19 deaths are highly concentrated are often home to larger populations of individuals at increased risk of severe illness if they are infected. One such group is retirement-age Americans. Americans 65 and older are at least 90 times more likely to die from the virus, if infected, than those in the 18 to 29 age range. The vast majority of the places on this list are home to a larger concentration of 65 and older residents than the state as a whole.
In addition to more vulnerable populations, the places on this list also tend to have a higher than average per capita COVID-19 cases. In 40 states, the county or county equivalent with the most COVID-19 deaths per 100,000 also has a higher number of confirmed cases per 100,000 than the state as a whole.
All COVID-19 data used in this story is current as of Jan. 18, 2021. Rhode Island and Kansas do not report deaths attributable to COVID-19 at the county level and are not included.

Alabama: Lowndes County
> COVID-19 deaths in Lowndes: 342 per 100,000 people (total: 35)
> COVID-19 deaths in Alabama: 125 per 100,000 people (total: 6,121)
> COVID-19 cases in Lowndes: 10,815 per 100,000 people (total: 1,107)
> COVID-19 cases in Alabama: 8,675 per 100,000 people (total: 424,028)
> 65 and older population: 18.4% in Lowndes, 16.5% in Alabama

Alaska: Yukon-Koyukuk Census Area
> COVID-19 deaths in Yukon-Koyukuk: 74 per 100,000 people (total: 4)
> COVID-19 deaths in Alaska: 31 per 100,000 people (total: 228)
> COVID-19 cases in Yukon-Koyukuk: 3,176 per 100,000 people (total: 172)
> COVID-19 cases in Alaska: 7,064 per 100,000 people (total: 52,093)
> 65 and older population: 14.3% in Yukon-Koyukuk, 11.2% in Alaska
These are all the counties in Alaska where COVID-19 is slowing (and where it’s still getting worse).
Arizona: Apache County
> COVID-19 deaths in Apache: 389 per 100,000 people (total: 278)
> COVID-19 deaths in Arizona: 157 per 100,000 people (total: 11,265)
> COVID-19 cases in Apache: 12,128 per 100,000 people (total: 8,674)
> COVID-19 cases in Arizona: 9,472 per 100,000 people (total: 679,282)
> 65 and older population: 15.0% in Apache, 17.1% in Arizona

Arkansas: Fulton County
> COVID-19 deaths in Fulton: 486 per 100,000 people (total: 59)
> COVID-19 deaths in Arkansas: 144 per 100,000 people (total: 4,343)
> COVID-19 cases in Fulton: 10,627 per 100,000 people (total: 1,290)
> COVID-19 cases in Arkansas: 9,034 per 100,000 people (total: 272,263)
> 65 and older population: 25.5% in Fulton, 16.6% in Arkansas

California: Imperial County
> COVID-19 deaths in Imperial: 257 per 100,000 people (total: 463)
> COVID-19 deaths in California: 85 per 100,000 people (total: 33,593)
> COVID-19 cases in Imperial: 14,013 per 100,000 people (total: 25,253)
> COVID-19 cases in California: 7,516 per 100,000 people (total: 2,973,174)
> 65 and older population: 12.6% in Imperial, 14.0% in California
Colorado: Otero County
> COVID-19 deaths in Otero: 311 per 100,000 people (total: 57)
> COVID-19 deaths in Colorado: 94 per 100,000 people (total: 5,379)
> COVID-19 cases in Otero: 9,583 per 100,000 people (total: 1,756)
> COVID-19 cases in Colorado: 6,584 per 100,000 people (total: 374,981)
> 65 and older population: 20.1% in Otero, 13.8% in Colorado

Connecticut: Hartford County
> COVID-19 deaths in Hartford: 225 per 100,000 people (total: 2,013)
> COVID-19 deaths in Connecticut: 187 per 100,000 people (total: 6,670)
> COVID-19 cases in Hartford: 6,497 per 100,000 people (total: 58,134)
> COVID-19 cases in Connecticut: 6,441 per 100,000 people (total: 230,125)
> 65 and older population: 16.8% in Hartford, 16.8% in Connecticut

Delaware: Sussex County
> COVID-19 deaths in Sussex: 146 per 100,000 people (total: 320)
> COVID-19 deaths in Delaware: 105 per 100,000 people (total: 1,016)
> COVID-19 cases in Sussex: 8,546 per 100,000 people (total: 18,762)
> COVID-19 cases in Delaware: 7,332 per 100,000 people (total: 70,910)
> 65 and older population: 27.0% in Sussex, 18.2% in Delaware
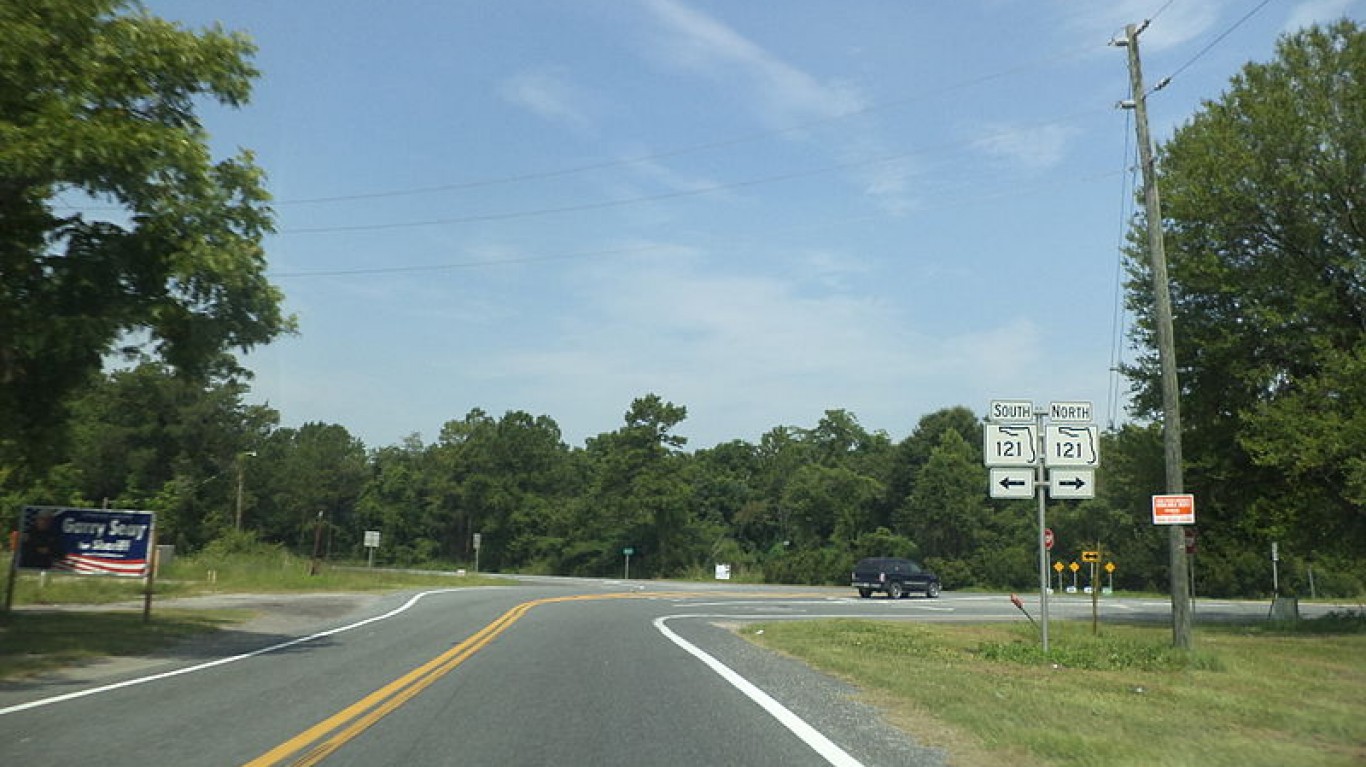
Florida: Union County
> COVID-19 deaths in Union: 453 per 100,000 people (total: 69)
> COVID-19 deaths in Florida: 116 per 100,000 people (total: 24,653)
> COVID-19 cases in Union: 10,572 per 100,000 people (total: 1,611)
> COVID-19 cases in Florida: 7,415 per 100,000 people (total: 1,579,281)
> 65 and older population: 15.0% in Union, 20.1% in Florida
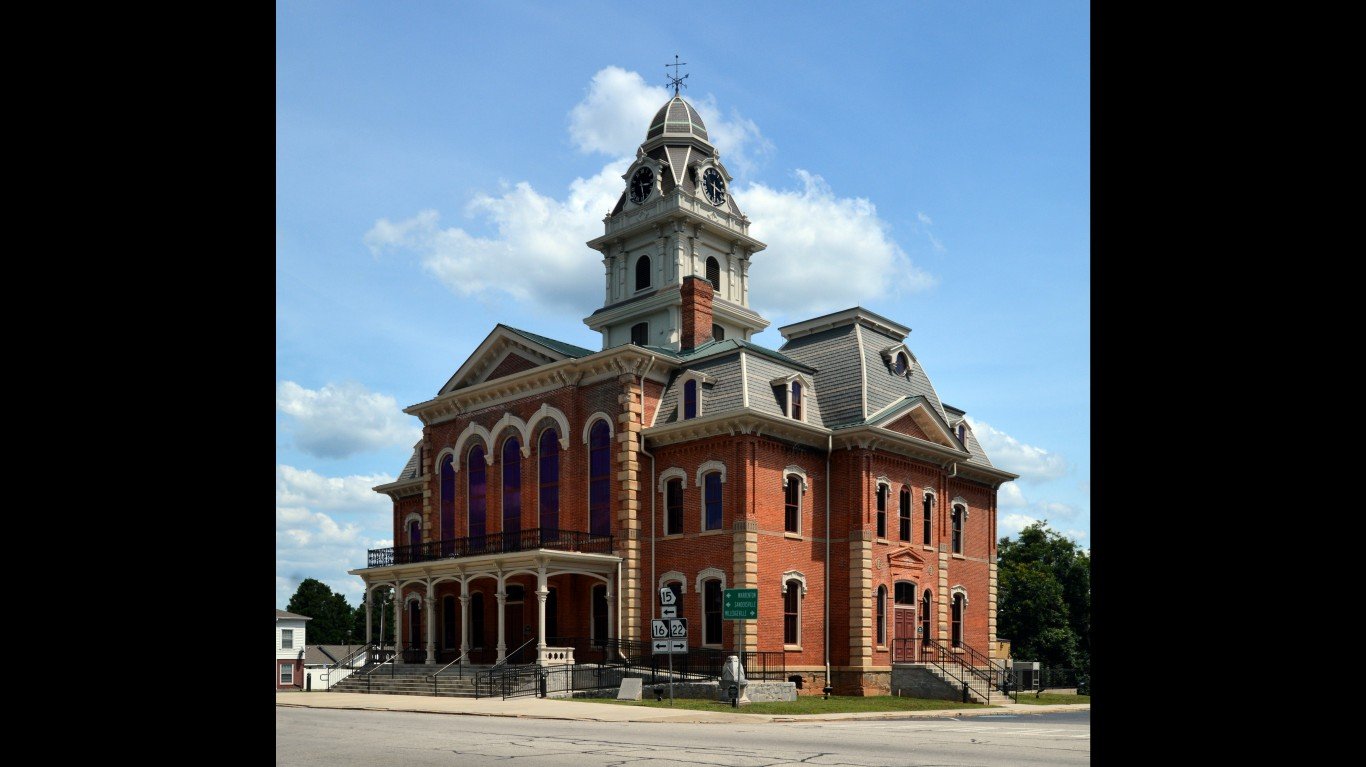
Georgia: Hancock County
> COVID-19 deaths in Hancock: 586 per 100,000 people (total: 50)
> COVID-19 deaths in Georgia: 117 per 100,000 people (total: 12,360)
> COVID-19 cases in Hancock: 8,448 per 100,000 people (total: 721)
> COVID-19 cases in Georgia: 6,509 per 100,000 people (total: 684,763)
> 65 and older population: 22.4% in Hancock, 13.5% in Georgia

Hawaii: Honolulu County
> COVID-19 deaths in Honolulu: 26 per 100,000 people (total: 253)
> COVID-19 deaths in Hawaii: 23 per 100,000 people (total: 322)
> COVID-19 cases in Honolulu: 2,022 per 100,000 people (total: 19,974)
> COVID-19 cases in Hawaii: 1,723 per 100,000 people (total: 24,482)
> 65 and older population: 17.3% in Honolulu, 17.8% in Hawaii
These are all the counties in Hawaii where COVID-19 is slowing (and where it’s still getting worse).

Idaho: Shoshone County
> COVID-19 deaths in Shoshone: 240 per 100,000 people (total: 30)
> COVID-19 deaths in Idaho: 92 per 100,000 people (total: 1,607)
> COVID-19 cases in Shoshone: 7,345 per 100,000 people (total: 920)
> COVID-19 cases in Idaho: 8,867 per 100,000 people (total: 155,554)
> 65 and older population: 22.3% in Shoshone, 15.4% in Idaho
These are all the counties in Idaho where COVID-19 is slowing (and where it’s still getting worse).

Illinois: Ford County
> COVID-19 deaths in Ford: 366 per 100,000 people (total: 49)
> COVID-19 deaths in Illinois: 158 per 100,000 people (total: 20,118)
> COVID-19 cases in Ford: 10,300 per 100,000 people (total: 1,380)
> COVID-19 cases in Illinois: 8,415 per 100,000 people (total: 1,072,214)
> 65 and older population: 18.8% in Ford, 15.2% in Illinois

Indiana: Decatur County
> COVID-19 deaths in Decatur: 309 per 100,000 people (total: 82)
> COVID-19 deaths in Indiana: 134 per 100,000 people (total: 8,966)
> COVID-19 cases in Decatur: 9,144 per 100,000 people (total: 2,428)
> COVID-19 cases in Indiana: 8,857 per 100,000 people (total: 592,709)
> 65 and older population: 16.5% in Decatur, 15.4% in Indiana

Iowa: Harrison County
> COVID-19 deaths in Harrison: 438 per 100,000 people (total: 62)
> COVID-19 deaths in Iowa: 137 per 100,000 people (total: 4,323)
> COVID-19 cases in Harrison: 10,917 per 100,000 people (total: 1,544)
> COVID-19 cases in Iowa: 9,659 per 100,000 people (total: 304,852)
> 65 and older population: 19.4% in Harrison, 16.7% in Iowa
These are all the counties in Iowa where COVID-19 is slowing (and where it’s still getting worse).

Kentucky: Robertson County
> COVID-19 deaths in Robertson: 373 per 100,000 people (total: 8)
> COVID-19 deaths in Kentucky: 71 per 100,000 people (total: 3,167)
> COVID-19 cases in Robertson: 7,513 per 100,000 people (total: 161)
> COVID-19 cases in Kentucky: 7,355 per 100,000 people (total: 328,668)
> 65 and older population: 21.5% in Robertson, 16.0% in Kentucky

Louisiana: East Feliciana Parish
> COVID-19 deaths in East Feliciana: 503 per 100,000 people (total: 98)
> COVID-19 deaths in Louisiana: 177 per 100,000 people (total: 8,253)
> COVID-19 cases in East Feliciana: 13,785 per 100,000 people (total: 2,688)
> COVID-19 cases in Louisiana: 7,939 per 100,000 people (total: 369,951)
> 65 and older population: 17.1% in East Feliciana, 15.0% in Louisiana

Maine: Oxford County
> COVID-19 deaths in Oxford: 59 per 100,000 people (total: 34)
> COVID-19 deaths in Maine: 38 per 100,000 people (total: 514)
> COVID-19 cases in Oxford: 2,756 per 100,000 people (total: 1,580)
> COVID-19 cases in Maine: 2,531 per 100,000 people (total: 33,876)
> 65 and older population: 21.2% in Oxford, 20.0% in Maine
These are all the counties in Maine where COVID-19 is slowing (and where it’s still getting worse).
Maryland: Allegany County
> COVID-19 deaths in Allegany: 229 per 100,000 people (total: 165)
> COVID-19 deaths in Maryland: 109 per 100,000 people (total: 6,596)
> COVID-19 cases in Allegany: 8,185 per 100,000 people (total: 5,891)
> COVID-19 cases in Maryland: 5,432 per 100,000 people (total: 328,214)
> 65 and older population: 19.8% in Allegany, 15.0% in Maryland

Massachusetts: Hampden County
> COVID-19 deaths in Hampden: 242 per 100,000 people (total: 1,135)
> COVID-19 deaths in Massachusetts: 199 per 100,000 people (total: 13,705)
> COVID-19 cases in Hampden: 7,084 per 100,000 people (total: 33,234)
> COVID-19 cases in Massachusetts: 6,859 per 100,000 people (total: 473,441)
> 65 and older population: 16.5% in Hampden, 16.2% in Massachusetts

Michigan: Baraga County
> COVID-19 deaths in Baraga: 341 per 100,000 people (total: 29)
> COVID-19 deaths in Michigan: 147 per 100,000 people (total: 14,686)
> COVID-19 cases in Baraga: 6,700 per 100,000 people (total: 570)
> COVID-19 cases in Michigan: 5,854 per 100,000 people (total: 585,128)
> 65 and older population: 21.7% in Baraga, 16.7% in Michigan
Minnesota: Kittson County
> COVID-19 deaths in Kittson: 438 per 100,000 people (total: 19)
> COVID-19 deaths in Minnesota: 106 per 100,000 people (total: 5,939)
> COVID-19 cases in Kittson: 8,577 per 100,000 people (total: 372)
> COVID-19 cases in Minnesota: 7,972 per 100,000 people (total: 447,349)
> 65 and older population: 23.9% in Kittson, 15.4% in Minnesota

Mississippi: Neshoba County
> COVID-19 deaths in Neshoba: 517 per 100,000 people (total: 152)
> COVID-19 deaths in Mississippi: 185 per 100,000 people (total: 5,524)
> COVID-19 cases in Neshoba: 11,516 per 100,000 people (total: 3,383)
> COVID-19 cases in Mississippi: 8,503 per 100,000 people (total: 253,932)
> 65 and older population: 15.7% in Neshoba, 15.4% in Mississippi
Missouri: Clinton County
> COVID-19 deaths in Clinton: 293 per 100,000 people (total: 60)
> COVID-19 deaths in Missouri: 102 per 100,000 people (total: 6,256)
> COVID-19 cases in Clinton: 6,930 per 100,000 people (total: 1,419)
> COVID-19 cases in Missouri: 7,163 per 100,000 people (total: 438,840)
> 65 and older population: 17.5% in Clinton, 16.5% in Missouri

Montana: Big Horn County
> COVID-19 deaths in Big Horn: 516 per 100,000 people (total: 69)
> COVID-19 deaths in Montana: 103 per 100,000 people (total: 1,093)
> COVID-19 cases in Big Horn: 16,604 per 100,000 people (total: 2,221)
> COVID-19 cases in Montana: 8,432 per 100,000 people (total: 89,576)
> 65 and older population: 12.1% in Big Horn, 18.2% in Montana
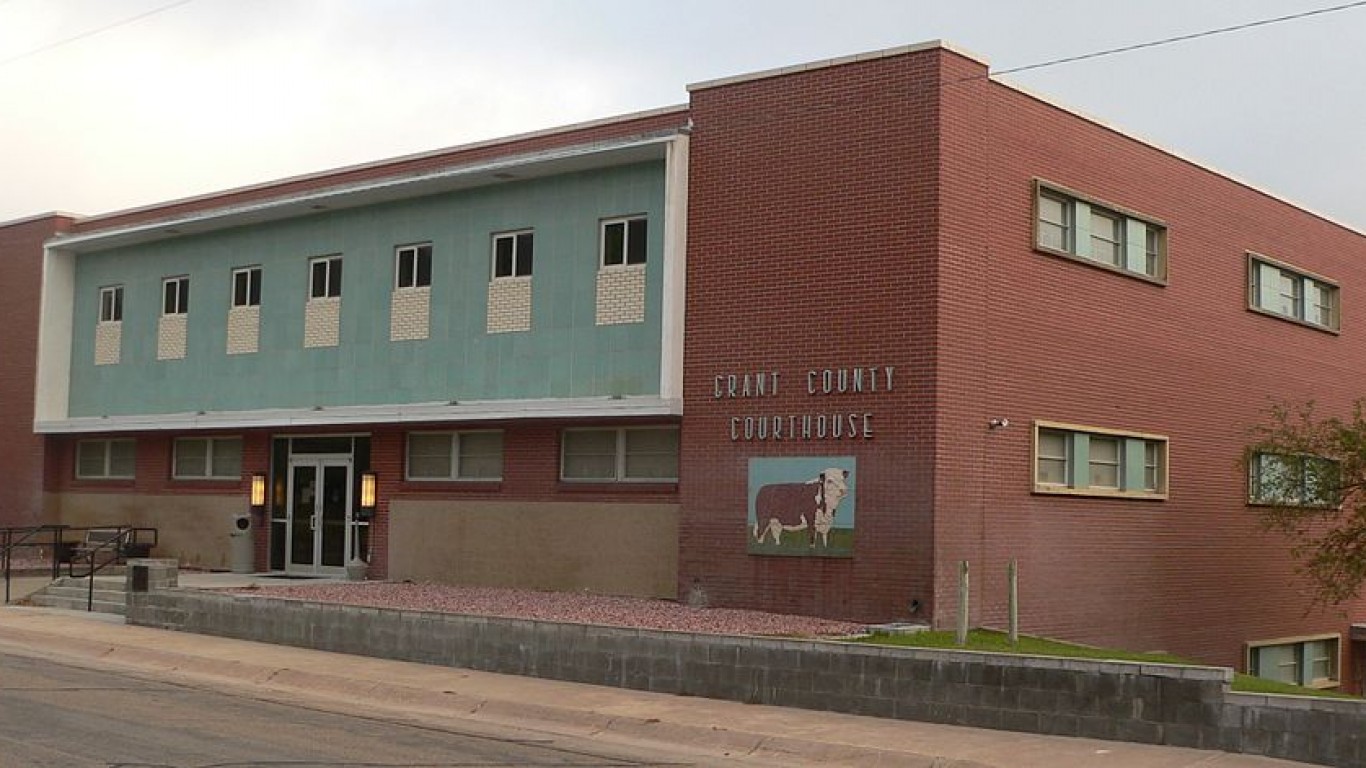
Nebraska: Grant County
> COVID-19 deaths in Grant: 557 per 100,000 people (total: 4)
> COVID-19 deaths in Nebraska: 95 per 100,000 people (total: 1,837)
> COVID-19 cases in Grant: 3,064 per 100,000 people (total: 22)
> COVID-19 cases in Nebraska: 9,432 per 100,000 people (total: 181,978)
> 65 and older population: 21.1% in Grant, 15.4% in Nebraska

Nevada: Pershing County
> COVID-19 deaths in Pershing: 227 per 100,000 people (total: 15)
> COVID-19 deaths in Nevada: 125 per 100,000 people (total: 3,784)
> COVID-19 cases in Pershing: 12,963 per 100,000 people (total: 857)
> COVID-19 cases in Nevada: 8,661 per 100,000 people (total: 262,794)
> 65 and older population: 15.7% in Pershing, 15.4% in Nevada
These are all the counties in Nevada where COVID-19 is slowing (and where it’s still getting worse).

New Hampshire: Belknap County
> COVID-19 deaths in Belknap: 127 per 100,000 people (total: 77)
> COVID-19 deaths in New Hampshire: 69 per 100,000 people (total: 933)
> COVID-19 cases in Belknap: 4,024 per 100,000 people (total: 2,440)
> COVID-19 cases in New Hampshire: 4,266 per 100,000 people (total: 57,864)
> 65 and older population: 21.4% in Belknap, 17.5% in New Hampshire
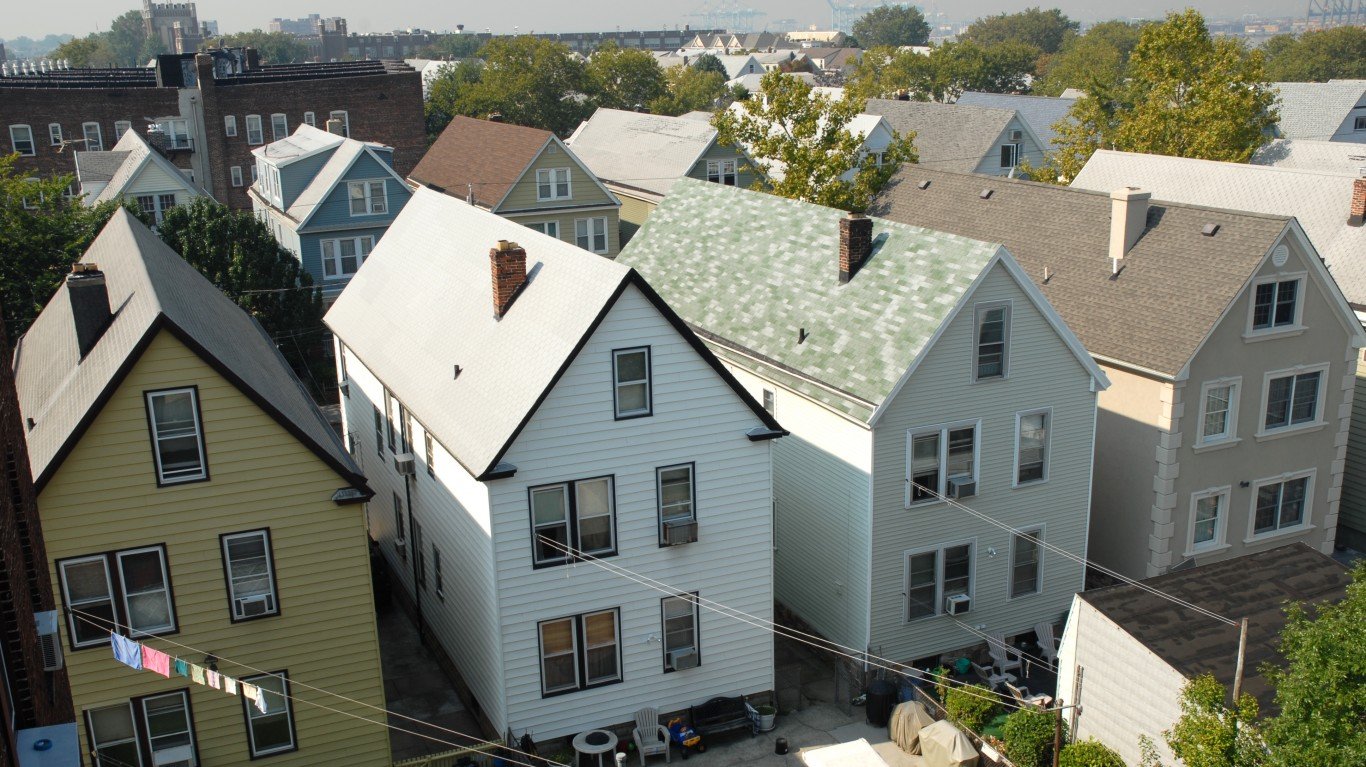
New Jersey: Essex County
> COVID-19 deaths in Essex: 312 per 100,000 people (total: 2,479)
> COVID-19 deaths in New Jersey: 230 per 100,000 people (total: 20,458)
> COVID-19 cases in Essex: 7,489 per 100,000 people (total: 59,432)
> COVID-19 cases in New Jersey: 7,083 per 100,000 people (total: 631,020)
> 65 and older population: 13.4% in Essex, 15.9% in New Jersey

New Mexico: McKinley County
> COVID-19 deaths in McKinley: 527 per 100,000 people (total: 384)
> COVID-19 deaths in New Mexico: 141 per 100,000 people (total: 2,958)
> COVID-19 cases in McKinley: 15,048 per 100,000 people (total: 10,962)
> COVID-19 cases in New Mexico: 7,839 per 100,000 people (total: 164,263)
> 65 and older population: 11.9% in McKinley, 16.9% in New Mexico

New York: Bronx County
> COVID-19 deaths in Bronx: 255 per 100,000 people (total: 3,662)
> COVID-19 deaths in New York: 169 per 100,000 people (total: 33,052)
> COVID-19 cases in Bronx: 7,036 per 100,000 people (total: 101,170)
> COVID-19 cases in New York: 6,374 per 100,000 people (total: 1,245,575)
> 65 and older population: 12.5% in Bronx, 16.1% in New York
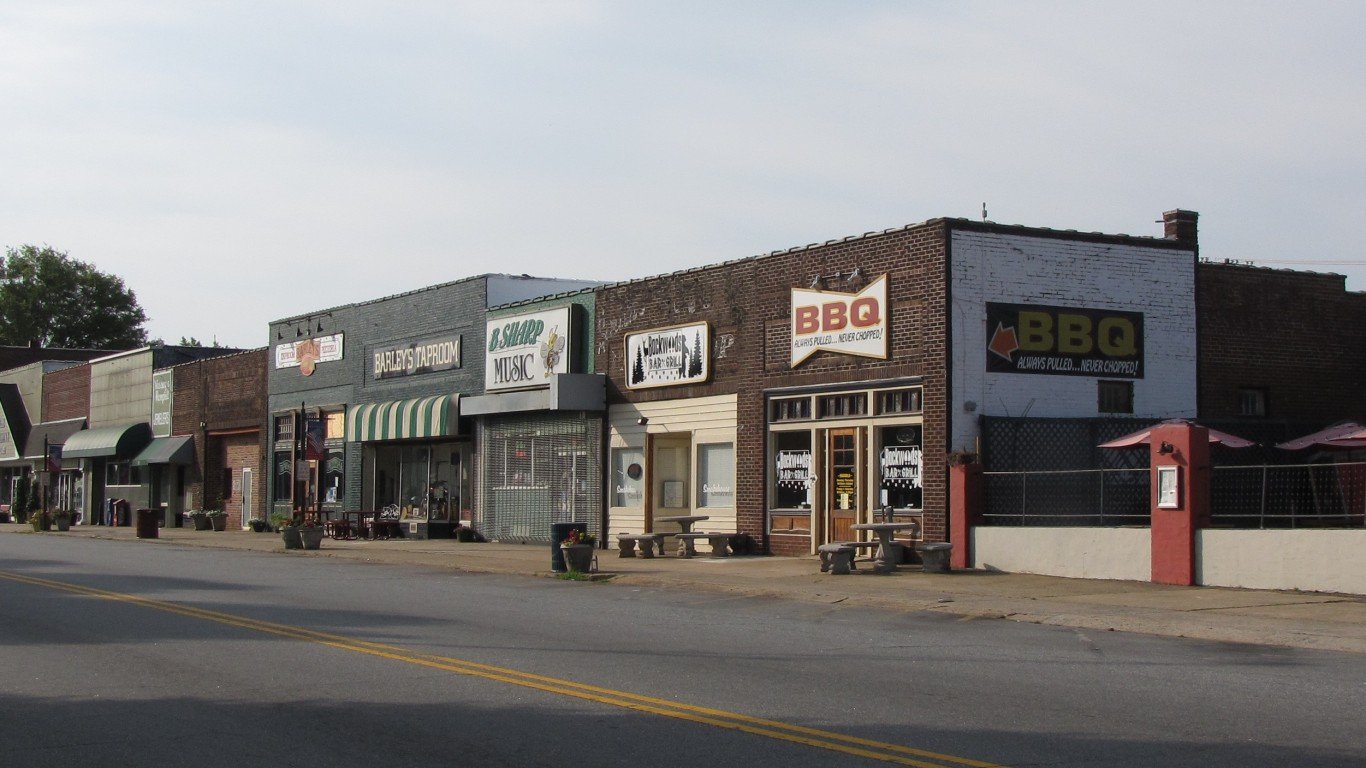
North Carolina: Rutherford County
> COVID-19 deaths in Rutherford: 231 per 100,000 people (total: 154)
> COVID-19 deaths in North Carolina: 78 per 100,000 people (total: 8,083)
> COVID-19 cases in Rutherford: 8,495 per 100,000 people (total: 5,652)
> COVID-19 cases in North Carolina: 6,497 per 100,000 people (total: 674,637)
> 65 and older population: 21.1% in Rutherford, 15.9% in North Carolina

North Dakota: Dickey County
> COVID-19 deaths in Dickey: 644 per 100,000 people (total: 32)
> COVID-19 deaths in North Dakota: 182 per 100,000 people (total: 1,384)
> COVID-19 cases in Dickey: 14,386 per 100,000 people (total: 715)
> COVID-19 cases in North Dakota: 12,622 per 100,000 people (total: 95,934)
> 65 and older population: 20.4% in Dickey, 14.9% in North Dakota
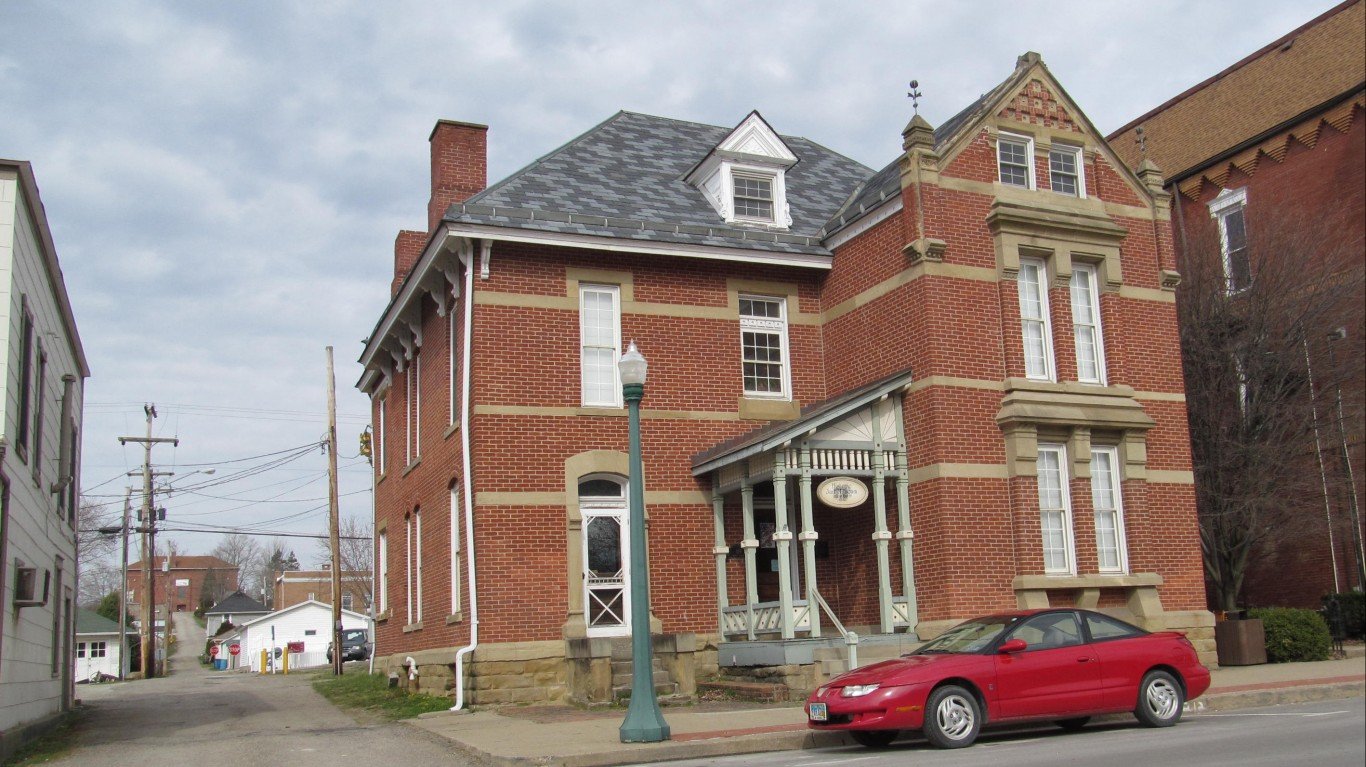
Ohio: Noble County
> COVID-19 deaths in Noble: 277 per 100,000 people (total: 40)
> COVID-19 deaths in Ohio: 88 per 100,000 people (total: 10,281)
> COVID-19 cases in Noble: 8,191 per 100,000 people (total: 1,183)
> COVID-19 cases in Ohio: 7,110 per 100,000 people (total: 831,066)
> 65 and older population: 26.7% in Noble, 16.7% in Ohio
These are all the counties in Ohio where COVID-19 is slowing (and where it’s still getting worse).

Oklahoma: Cotton County
> COVID-19 deaths in Cotton: 202 per 100,000 people (total: 12)
> COVID-19 deaths in Oklahoma: 76 per 100,000 people (total: 2,994)
> COVID-19 cases in Cotton: 8,939 per 100,000 people (total: 530)
> COVID-19 cases in Oklahoma: 9,049 per 100,000 people (total: 356,816)
> 65 and older population: 19.4% in Cotton, 15.3% in Oklahoma

Oregon: Malheur County
> COVID-19 deaths in Malheur: 171 per 100,000 people (total: 52)
> COVID-19 deaths in Oregon: 43 per 100,000 people (total: 1,803)
> COVID-19 cases in Malheur: 10,302 per 100,000 people (total: 3,135)
> COVID-19 cases in Oregon: 3,194 per 100,000 people (total: 133,851)
> 65 and older population: 16.4% in Malheur, 17.2% in Oregon
These are all the counties in Oregon where COVID-19 is slowing (and where it’s still getting worse).
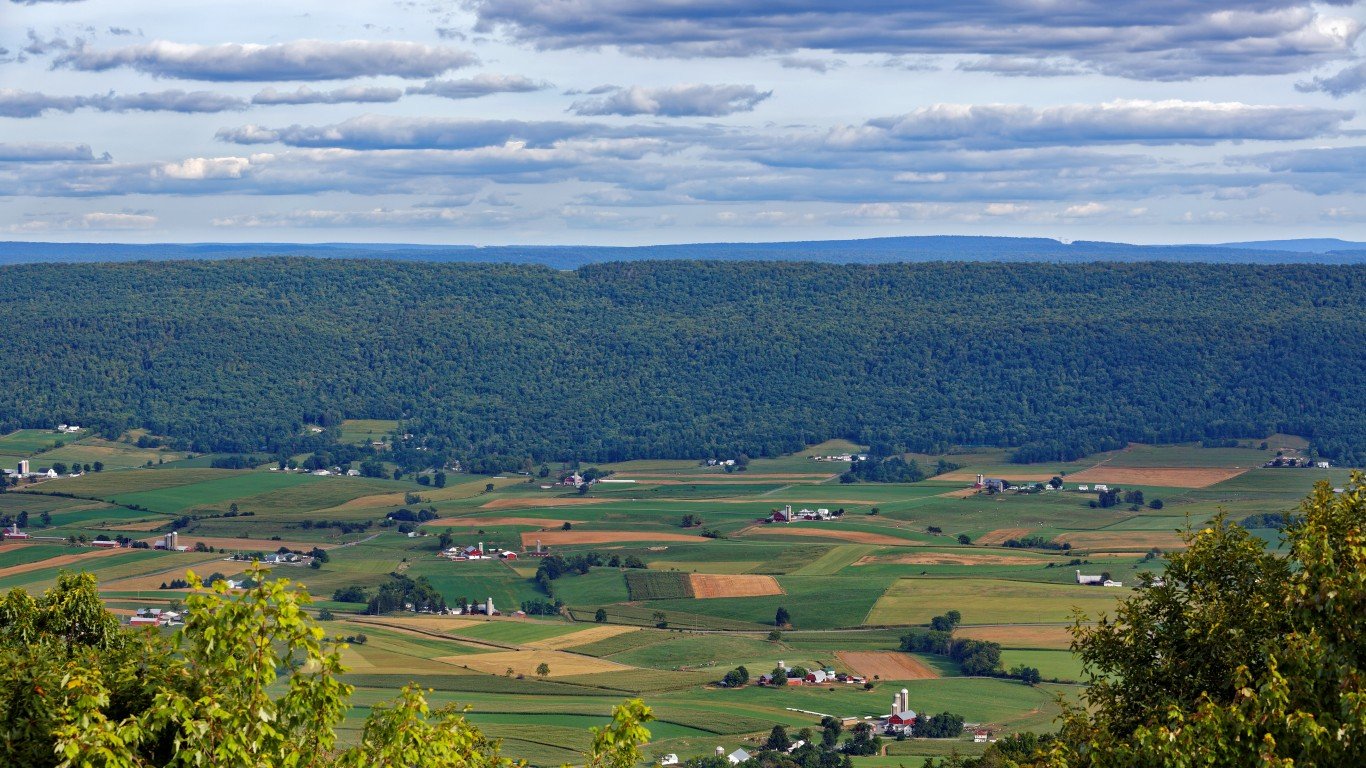
Pennsylvania: Mifflin County
> COVID-19 deaths in Mifflin: 293 per 100,000 people (total: 136)
> COVID-19 deaths in Pennsylvania: 151 per 100,000 people (total: 19,390)
> COVID-19 cases in Mifflin: 8,684 per 100,000 people (total: 4,026)
> COVID-19 cases in Pennsylvania: 6,027 per 100,000 people (total: 771,845)
> 65 and older population: 21.1% in Mifflin, 17.8% in Pennsylvania

South Carolina: Bamberg County
> COVID-19 deaths in Bamberg: 295 per 100,000 people (total: 43)
> COVID-19 deaths in South Carolina: 123 per 100,000 people (total: 6,248)
> COVID-19 cases in Bamberg: 7,767 per 100,000 people (total: 1,134)
> COVID-19 cases in South Carolina: 7,700 per 100,000 people (total: 391,464)
> 65 and older population: 21.0% in Bamberg, 17.2% in South Carolina
South Dakota: Jerauld County
> COVID-19 deaths in Jerauld: 789 per 100,000 people (total: 16)
> COVID-19 deaths in South Dakota: 189 per 100,000 people (total: 1,667)
> COVID-19 cases in Jerauld: 13,061 per 100,000 people (total: 265)
> COVID-19 cases in South Dakota: 10,729 per 100,000 people (total: 94,652)
> 65 and older population: 29.6% in Jerauld, 16.3% in South Dakota

Tennessee: Pickett County
> COVID-19 deaths in Pickett: 373 per 100,000 people (total: 19)
> COVID-19 deaths in Tennessee: 125 per 100,000 people (total: 8,430)
> COVID-19 cases in Pickett: 13,345 per 100,000 people (total: 679)
> COVID-19 cases in Tennessee: 10,159 per 100,000 people (total: 687,751)
> 65 and older population: 26.9% in Pickett, 16.0% in Tennessee

Texas: Lamb County
> COVID-19 deaths in Lamb: 550 per 100,000 people (total: 73)
> COVID-19 deaths in Texas: 112 per 100,000 people (total: 32,084)
> COVID-19 cases in Lamb: 13,565 per 100,000 people (total: 1,799)
> COVID-19 cases in Texas: 7,406 per 100,000 people (total: 2,125,552)
> 65 and older population: 16.5% in Lamb, 12.3% in Texas
These are all the counties in Texas where COVID-19 is slowing (and where it’s still getting worse).

Utah: San Juan County
> COVID-19 deaths in San Juan: 229 per 100,000 people (total: 35)
> COVID-19 deaths in Utah: 47 per 100,000 people (total: 1,500)
> COVID-19 cases in San Juan: 10,896 per 100,000 people (total: 1,665)
> COVID-19 cases in Utah: 10,279 per 100,000 people (total: 324,919)
> 65 and older population: 13.7% in San Juan, 10.8% in Utah
These are all the counties in Utah where COVID-19 is slowing (and where it’s still getting worse).
Vermont: Franklin County
> COVID-19 deaths in Franklin: 67 per 100,000 people (total: 33)
> COVID-19 deaths in Vermont: 26 per 100,000 people (total: 163)
> COVID-19 cases in Franklin: 1,369 per 100,000 people (total: 671)
> COVID-19 cases in Vermont: 1,632 per 100,000 people (total: 10,220)
> 65 and older population: 15.6% in Franklin, 18.8% in Vermont

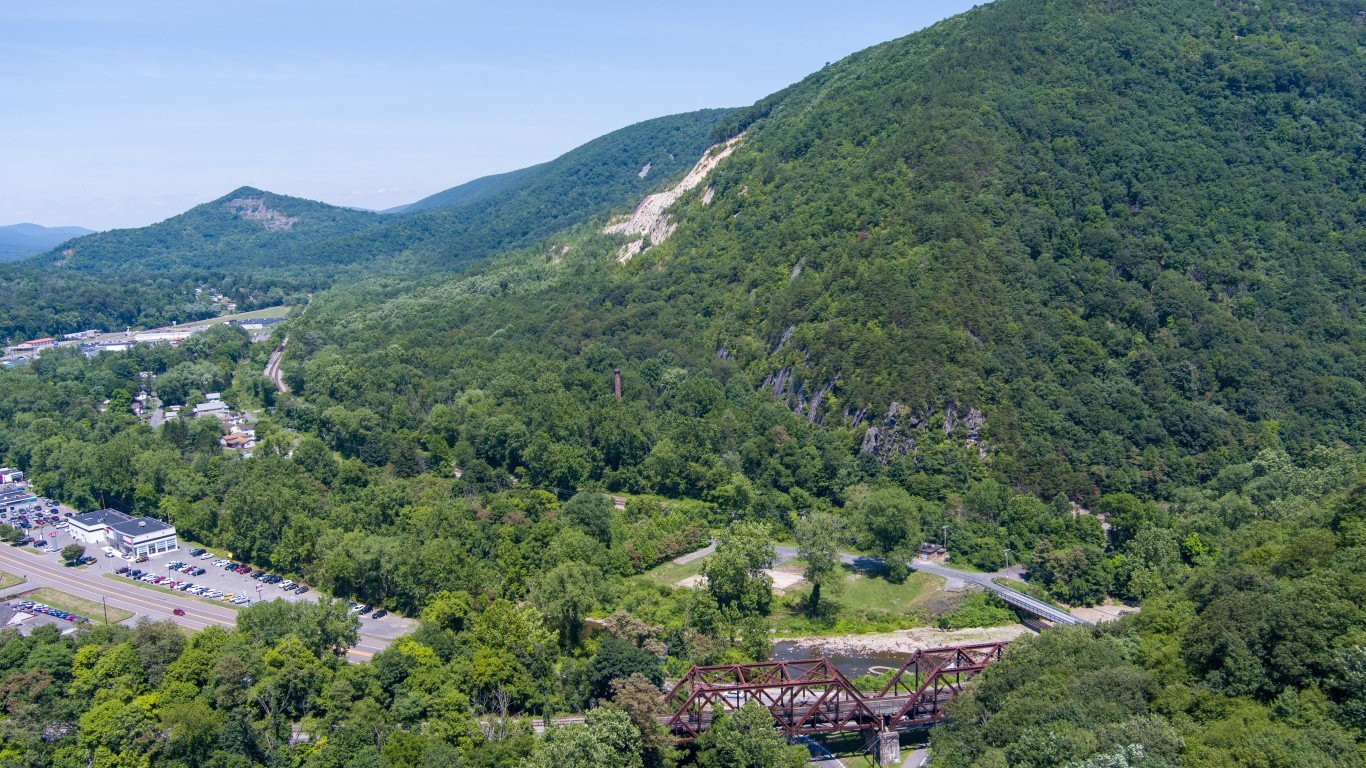
Virginia: Galax
> COVID-19 deaths in Galax: 572 per 100,000 people (total: 38)
> COVID-19 deaths in Virginia: 67 per 100,000 people (total: 5,739)
> COVID-19 cases in Galax: 13,905 per 100,000 people (total: 923)
> COVID-19 cases in Virginia: 5,243 per 100,000 people (total: 446,550)
> 65 and older population: 22.4% in Galax, 15.0% in Virginia

Washington: Garfield County
> COVID-19 deaths in Garfield: 180 per 100,000 people (total: 4)
> COVID-19 deaths in Washington: 52 per 100,000 people (total: 3,903)
> COVID-19 cases in Garfield: 4,586 per 100,000 people (total: 102)
> COVID-19 cases in Washington: 3,848 per 100,000 people (total: 289,939)
> 65 and older population: 24.7% in Garfield, 15.1% in Washington
West Virginia: Mineral County
> COVID-19 deaths in Mineral: 264 per 100,000 people (total: 72)
> COVID-19 deaths in West Virginia: 99 per 100,000 people (total: 1,784)
> COVID-19 cases in Mineral: 8,498 per 100,000 people (total: 2,318)
> COVID-19 cases in West Virginia: 6,081 per 100,000 people (total: 109,809)
> 65 and older population: 21.3% in Mineral, 19.4% in West Virginia

Wisconsin: Iron County
> COVID-19 deaths in Iron: 332 per 100,000 people (total: 19)
> COVID-19 deaths in Wisconsin: 94 per 100,000 people (total: 5,470)
> COVID-19 cases in Iron: 7,787 per 100,000 people (total: 445)
> COVID-19 cases in Wisconsin: 8,994 per 100,000 people (total: 522,877)
> 65 and older population: 30.1% in Iron, 16.5% in Wisconsin
Wyoming: Washakie County
> COVID-19 deaths in Washakie: 283 per 100,000 people (total: 23)
> COVID-19 deaths in Wyoming: 90 per 100,000 people (total: 522)
> COVID-19 cases in Washakie: 10,383 per 100,000 people (total: 844)
> COVID-19 cases in Wyoming: 8,604 per 100,000 people (total: 49,708)
> 65 and older population: 21.1% in Washakie, 15.7% in Wyoming
Click here to see all coronavirus data for every state.
Contact [email protected] for any questions or corrections.