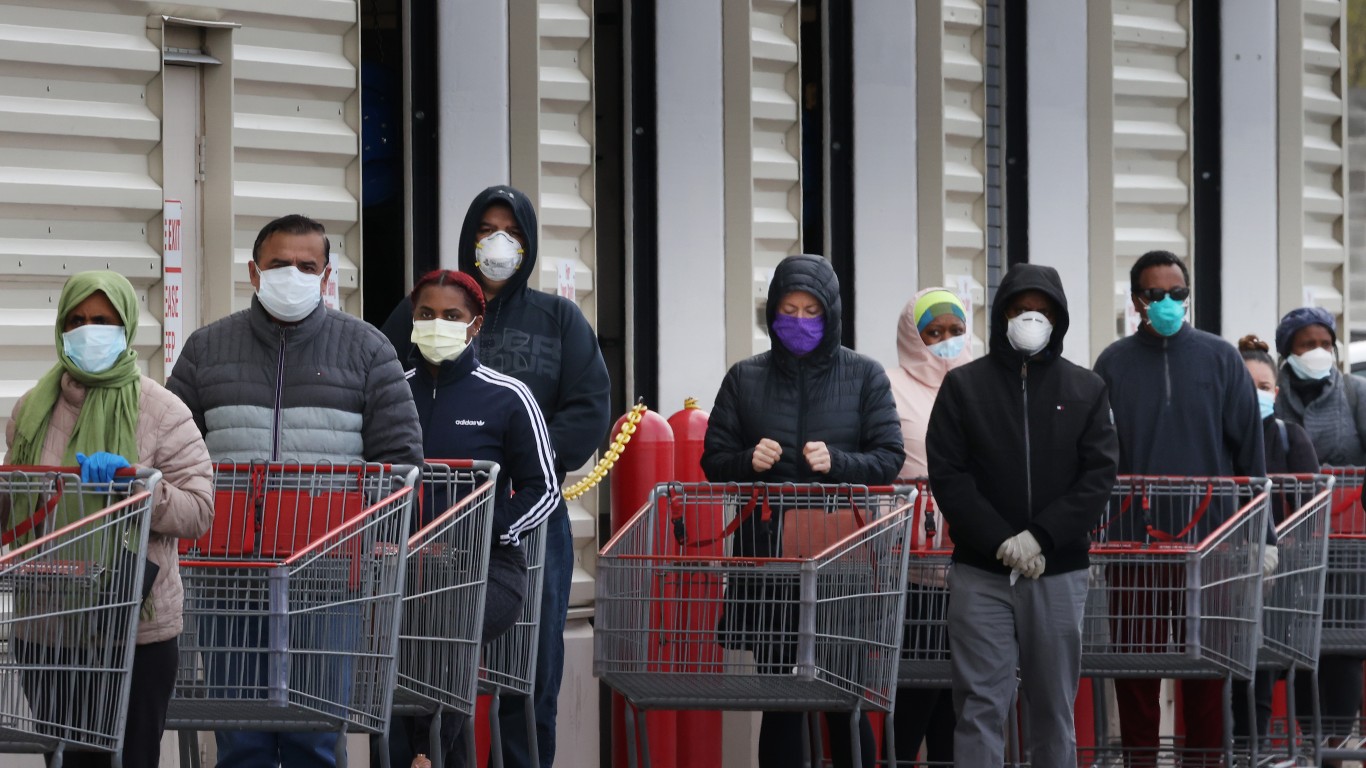

Vaccine distribution is well underway across the United States. Still, the novel coronavirus continues to spread through the population. In the last week alone, there were an average of 134,592 new cases of the virus every day.
Since the first known case was identified in the U.S. on Jan. 21, 2020, there have been a total of 26,239,600 reported cases of COVID-19 nationwide — or 8,020 per 100,000 people. Of course, infections are not evenly spread across the country, and some states have far higher infections rates per capita than others. The number of confirmed cases per 100,000 people ranges from as low as 1,836 to as high as 12,885, depending on the state.
Though the first case of the novel coronavirus in the United States was on the West Coast, the early epicenter of the outbreak was on the other side of the country, in New York City. In the months since, the parts of the country hit hardest by the virus shifted to the Southeast, the Midwest, and California.
Currently, the states with the lowest number of infections per capita tend to be concentrated in the Northeast, while the states with the highest population-adjusted infection rates are most likely to be located in the Midwest.
The severity of a COVID-19 outbreak across a given state is subject to a wide range of factors. Still, states that had a hands-off approach in the early days of the pandemic are more likely to be worse off today than those that adopted strict measures to control the spread. Arkansas, Iowa, Nebraska, North Dakota, Oklahoma, South Dakota, and Wyoming were the only states that did not issue a statewide stay-at-home order in March or early April — and of those states, all seven currently have a higher infection rate than the U.S. as a whole.
All COVID-19 data used in this story are current as of Feb. 3, 2021.

51. Hawaii
> Cumulative cases of COVID-19 as of Feb. 3: 1,836 per 100,000 people (26,081 total cases)
> COVID-19 related deaths as of Feb. 3: 29 per 100,000 people (414 total deaths)
> Avg. new daily cases in the last week: 6.4 per 100,000 people (total: 639)
> Population: 1,420,491
These are all the counties in Hawaii where COVID-19 is slowing (and where it’s still getting worse).

50. Vermont
> Cumulative cases of COVID-19 as of Feb. 3: 1,969 per 100,000 people (12,329 total cases)
> COVID-19 related deaths as of Feb. 3: 29 per 100,000 people (179 total deaths)
> Avg. new daily cases in the last week: 21.7 per 100,000 people (total: 950)
> Population: 626,299

49. Maine
> Cumulative cases of COVID-19 as of Feb. 3: 3,006 per 100,000 people (40,233 total cases)
> COVID-19 related deaths as of Feb. 3: 47 per 100,000 people (627 total deaths)
> Avg. new daily cases in the last week: 22 per 100,000 people (total: 2,063)
> Population: 1,338,404
These are all the counties in Maine where COVID-19 is slowing (and where it’s still getting worse).

48. Oregon
> Cumulative cases of COVID-19 as of Feb. 3: 3,451 per 100,000 people (144,605 total cases)
> COVID-19 related deaths as of Feb. 3: 48 per 100,000 people (1,991 total deaths)
> Avg. new daily cases in the last week: 20.2 per 100,000 people (total: 5,937)
> Population: 4,190,713
These are all the counties in Oregon where COVID-19 is slowing (and where it’s still getting worse).

47. Washington
> Cumulative cases of COVID-19 as of Feb. 3: 4,197 per 100,000 people (316,294 total cases)
> COVID-19 related deaths as of Feb. 3: 58 per 100,000 people (4,388 total deaths)
> Avg. new daily cases in the last week: 20.9 per 100,000 people (total: 11,005)
> Population: 7,535,591

46. New Hampshire
> Cumulative cases of COVID-19 as of Feb. 3: 4,919 per 100,000 people (66,721 total cases)
> COVID-19 related deaths as of Feb. 3: 79 per 100,000 people (1,076 total deaths)
> Avg. new daily cases in the last week: 33.3 per 100,000 people (total: 3,158)
> Population: 1,356,458

45. Washington D.C.
> Cumulative cases of COVID-19 as of Feb. 3: 5,434 per 100,000 people (37,199 total cases)
> COVID-19 related deaths as of Feb. 3: 135 per 100,000 people (926 total deaths)
> Avg. new daily cases in the last week: 27.1 per 100,000 people (total: 1,334)
> Population: 702,455
Click here to see all COVID-19 data for Washington D.C.

44. Maryland
> Cumulative cases of COVID-19 as of Feb. 3: 5,916 per 100,000 people (357,483 total cases)
> COVID-19 related deaths as of Feb. 3: 119 per 100,000 people (7,220 total deaths)
> Avg. new daily cases in the last week: 25.8 per 100,000 people (total: 10,924)
> Population: 6,042,718

43. Virginia
> Cumulative cases of COVID-19 as of Feb. 3: 6,027 per 100,000 people (513,339 total cases)
> COVID-19 related deaths as of Feb. 3: 77 per 100,000 people (6,575 total deaths)
> Avg. new daily cases in the last week: 41.6 per 100,000 people (total: 24,786)
> Population: 8,517,685

42. Michigan
> Cumulative cases of COVID-19 as of Feb. 3: 6,161 per 100,000 people (615,860 total cases)
> COVID-19 related deaths as of Feb. 3: 157 per 100,000 people (15,644 total deaths)
> Avg. new daily cases in the last week: 16.6 per 100,000 people (total: 11,627)
> Population: 9,995,915

41. Pennsylvania
> Cumulative cases of COVID-19 as of Feb. 3: 6,665 per 100,000 people (853,616 total cases)
> COVID-19 related deaths as of Feb. 3: 171 per 100,000 people (21,955 total deaths)
> Avg. new daily cases in the last week: 39.3 per 100,000 people (total: 35,247)
> Population: 12,807,060

40. West Virginia
> Cumulative cases of COVID-19 as of Feb. 3: 6,782 per 100,000 people (122,470 total cases)
> COVID-19 related deaths as of Feb. 3: 114 per 100,000 people (2,058 total deaths)
> Avg. new daily cases in the last week: 37.1 per 100,000 people (total: 4,695)
> Population: 1,805,832

39. Colorado
> Cumulative cases of COVID-19 as of Feb. 3: 7,010 per 100,000 people (399,267 total cases)
> COVID-19 related deaths as of Feb. 3: 99 per 100,000 people (5,664 total deaths)
> Avg. new daily cases in the last week: 22.6 per 100,000 people (total: 9,009)
> Population: 5,695,564

38. Connecticut
> Cumulative cases of COVID-19 as of Feb. 3: 7,194 per 100,000 people (257,004 total cases)
> COVID-19 related deaths as of Feb. 3: 200 per 100,000 people (7,157 total deaths)
> Avg. new daily cases in the last week: 38.6 per 100,000 people (total: 9,665)
> Population: 3,572,665

37. New York
> Cumulative cases of COVID-19 as of Feb. 3: 7,334 per 100,000 people (1,433,304 total cases)
> COVID-19 related deaths as of Feb. 3: 182 per 100,000 people (35,631 total deaths)
> Avg. new daily cases in the last week: 52.8 per 100,000 people (total: 72,222)
> Population: 19,542,209

36. Alaska
> Cumulative cases of COVID-19 as of Feb. 3: 7,434 per 100,000 people (54,820 total cases)
> COVID-19 related deaths as of Feb. 3: 38 per 100,000 people (277 total deaths)
> Avg. new daily cases in the last week: 22.3 per 100,000 people (total: 1,150)
> Population: 737,438
These are all the counties in Alaska where COVID-19 is slowing (and where it’s still getting worse).

35. North Carolina
> Cumulative cases of COVID-19 as of Feb. 3: 7,476 per 100,000 people (776,307 total cases)
> COVID-19 related deaths as of Feb. 3: 92 per 100,000 people (9,578 total deaths)
> Avg. new daily cases in the last week: 59.6 per 100,000 people (total: 43,297)
> Population: 10,383,620

34. Missouri
> Cumulative cases of COVID-19 as of Feb. 3: 7,536 per 100,000 people (461,720 total cases)
> COVID-19 related deaths as of Feb. 3: 116 per 100,000 people (7,098 total deaths)
> Avg. new daily cases in the last week: 20.5 per 100,000 people (total: 8,783)
> Population: 6,126,452

33. Massachusetts
> Cumulative cases of COVID-19 as of Feb. 3: 7,695 per 100,000 people (531,117 total cases)
> COVID-19 related deaths as of Feb. 3: 213 per 100,000 people (14,708 total deaths)
> Avg. new daily cases in the last week: 44.7 per 100,000 people (total: 21,614)
> Population: 6,902,149

32. Ohio
> Cumulative cases of COVID-19 as of Feb. 3: 7,757 per 100,000 people (906,727 total cases)
> COVID-19 related deaths as of Feb. 3: 98 per 100,000 people (11,430 total deaths)
> Avg. new daily cases in the last week: 34.8 per 100,000 people (total: 28,443)
> Population: 11,689,442
These are all the counties in Ohio where COVID-19 is slowing (and where it’s still getting worse).

31. New Jersey
> Cumulative cases of COVID-19 as of Feb. 3: 7,922 per 100,000 people (705,760 total cases)
> COVID-19 related deaths as of Feb. 3: 244 per 100,000 people (21,693 total deaths)
> Avg. new daily cases in the last week: 46.9 per 100,000 people (total: 29,272)
> Population: 8,908,520

30. Delaware
> Cumulative cases of COVID-19 as of Feb. 3: 8,166 per 100,000 people (78,982 total cases)
> COVID-19 related deaths as of Feb. 3: 117 per 100,000 people (1,130 total deaths)
> Avg. new daily cases in the last week: 46.5 per 100,000 people (total: 3,150)
> Population: 967,171

29. Florida
> Cumulative cases of COVID-19 as of Feb. 3: 8,191 per 100,000 people (1,744,619 total cases)
> COVID-19 related deaths as of Feb. 3: 129 per 100,000 people (27,467 total deaths)
> Avg. new daily cases in the last week: 45.9 per 100,000 people (total: 68,448)
> Population: 21,299,325

28. Minnesota
> Cumulative cases of COVID-19 as of Feb. 3: 8,265 per 100,000 people (463,766 total cases)
> COVID-19 related deaths as of Feb. 3: 111 per 100,000 people (6,234 total deaths)
> Avg. new daily cases in the last week: 16.4 per 100,000 people (total: 6,449)
> Population: 5,611,179

27. Kentucky
> Cumulative cases of COVID-19 as of Feb. 3: 8,270 per 100,000 people (369,519 total cases)
> COVID-19 related deaths as of Feb. 3: 86 per 100,000 people (3,863 total deaths)
> Avg. new daily cases in the last week: 53 per 100,000 people (total: 16,576)
> Population: 4,468,402

26. California
> Cumulative cases of COVID-19 as of Feb. 3: 8,295 per 100,000 people (3,281,271 total cases)
> COVID-19 related deaths as of Feb. 3: 106 per 100,000 people (41,811 total deaths)
> Avg. new daily cases in the last week: 40.2 per 100,000 people (total: 111,357)
> Population: 39,557,045

25. New Mexico
> Cumulative cases of COVID-19 as of Feb. 3: 8,383 per 100,000 people (175,652 total cases)
> COVID-19 related deaths as of Feb. 3: 159 per 100,000 people (3,338 total deaths)
> Avg. new daily cases in the last week: 31.4 per 100,000 people (total: 4,605)
> Population: 2,095,428

24. Texas
> Cumulative cases of COVID-19 as of Feb. 3: 8,477 per 100,000 people (2,433,110 total cases)
> COVID-19 related deaths as of Feb. 3: 130 per 100,000 people (37,288 total deaths)
> Avg. new daily cases in the last week: 69.9 per 100,000 people (total: 140,378)
> Population: 28,701,845
These are all the counties in Texas where COVID-19 is slowing (and where it’s still getting worse).

23. Louisiana
> Cumulative cases of COVID-19 as of Feb. 3: 8,718 per 100,000 people (406,235 total cases)
> COVID-19 related deaths as of Feb. 3: 193 per 100,000 people (9,006 total deaths)
> Avg. new daily cases in the last week: 42.4 per 100,000 people (total: 13,819)
> Population: 4,659,978

22. Georgia
> Cumulative cases of COVID-19 as of Feb. 3: 8,768 per 100,000 people (922,364 total cases)
> COVID-19 related deaths as of Feb. 3: 139 per 100,000 people (14,587 total deaths)
> Avg. new daily cases in the last week: 49.9 per 100,000 people (total: 36,759)
> Population: 10,519,475

21. Illinois
> Cumulative cases of COVID-19 as of Feb. 3: 8,795 per 100,000 people (1,120,528 total cases)
> COVID-19 related deaths as of Feb. 3: 166 per 100,000 people (21,146 total deaths)
> Avg. new daily cases in the last week: 18.4 per 100,000 people (total: 16,432)
> Population: 12,741,080

20. South Carolina
> Cumulative cases of COVID-19 as of Feb. 3: 8,867 per 100,000 people (450,794 total cases)
> COVID-19 related deaths as of Feb. 3: 145 per 100,000 people (7,394 total deaths)
> Avg. new daily cases in the last week: 66.2 per 100,000 people (total: 23,563)
> Population: 5,084,127

19. Montana
> Cumulative cases of COVID-19 as of Feb. 3: 8,925 per 100,000 people (94,810 total cases)
> COVID-19 related deaths as of Feb. 3: 123 per 100,000 people (1,303 total deaths)
> Avg. new daily cases in the last week: 30.6 per 100,000 people (total: 2,279)
> Population: 1,062,305

18. Wyoming
> Cumulative cases of COVID-19 as of Feb. 3: 9,050 per 100,000 people (52,288 total cases)
> COVID-19 related deaths as of Feb. 3: 108 per 100,000 people (624 total deaths)
> Avg. new daily cases in the last week: 22.7 per 100,000 people (total: 920)
> Population: 577,737

17. Nevada
> Cumulative cases of COVID-19 as of Feb. 3: 9,251 per 100,000 people (280,707 total cases)
> COVID-19 related deaths as of Feb. 3: 144 per 100,000 people (4,373 total deaths)
> Avg. new daily cases in the last week: 32.2 per 100,000 people (total: 6,834)
> Population: 3,034,392
These are all the counties in Nevada where COVID-19 is slowing (and where it’s still getting worse).

16. Mississippi
> Cumulative cases of COVID-19 as of Feb. 3: 9,286 per 100,000 people (277,322 total cases)
> COVID-19 related deaths as of Feb. 3: 206 per 100,000 people (6,158 total deaths)
> Avg. new daily cases in the last week: 41.4 per 100,000 people (total: 8,650)
> Population: 2,986,530

15. Idaho
> Cumulative cases of COVID-19 as of Feb. 3: 9,358 per 100,000 people (164,163 total cases)
> COVID-19 related deaths as of Feb. 3: 100 per 100,000 people (1,748 total deaths)
> Avg. new daily cases in the last week: 24 per 100,000 people (total: 2,951)
> Population: 1,754,208
These are all the counties in Idaho where COVID-19 is slowing (and where it’s still getting worse).

14. Wisconsin
> Cumulative cases of COVID-19 as of Feb. 3: 9,382 per 100,000 people (545,437 total cases)
> COVID-19 related deaths as of Feb. 3: 102 per 100,000 people (5,951 total deaths)
> Avg. new daily cases in the last week: 21.8 per 100,000 people (total: 8,891)
> Population: 5,813,568

13. Indiana
> Cumulative cases of COVID-19 as of Feb. 3: 9,434 per 100,000 people (631,331 total cases)
> COVID-19 related deaths as of Feb. 3: 145 per 100,000 people (9,713 total deaths)
> Avg. new daily cases in the last week: 30.2 per 100,000 people (total: 14,155)
> Population: 6,691,878

12. Alabama
> Cumulative cases of COVID-19 as of Feb. 3: 9,514 per 100,000 people (465,056 total cases)
> COVID-19 related deaths as of Feb. 3: 168 per 100,000 people (8,203 total deaths)
> Avg. new daily cases in the last week: 46.7 per 100,000 people (total: 15,970)
> Population: 4,887,871

11. Kansas
> Cumulative cases of COVID-19 as of Feb. 3: 9,580 per 100,000 people (278,915 total cases)
> COVID-19 related deaths as of Feb. 3: 134 per 100,000 people (3,895 total deaths)
> Avg. new daily cases in the last week: 31.4 per 100,000 people (total: 6,398)
> Population: 2,911,510
These are all the counties in Kansas where COVID-19 is slowing (and where it’s still getting worse).

10. Nebraska
> Cumulative cases of COVID-19 as of Feb. 3: 9,954 per 100,000 people (192,042 total cases)
> COVID-19 related deaths as of Feb. 3: 100 per 100,000 people (1,931 total deaths)
> Avg. new daily cases in the last week: 29 per 100,000 people (total: 3,920)
> Population: 1,929,268

9. Arkansas
> Cumulative cases of COVID-19 as of Feb. 3: 9,968 per 100,000 people (300,430 total cases)
> COVID-19 related deaths as of Feb. 3: 165 per 100,000 people (4,985 total deaths)
> Avg. new daily cases in the last week: 54.3 per 100,000 people (total: 11,466)
> Population: 3,013,825

8. Oklahoma
> Cumulative cases of COVID-19 as of Feb. 3: 9,999 per 100,000 people (394,283 total cases)
> COVID-19 related deaths as of Feb. 3: 93 per 100,000 people (3,654 total deaths)
> Avg. new daily cases in the last week: 55 per 100,000 people (total: 15,173)
> Population: 3,943,079

7. Iowa
> Cumulative cases of COVID-19 as of Feb. 3: 10,188 per 100,000 people (321,536 total cases)
> COVID-19 related deaths as of Feb. 3: 158 per 100,000 people (4,975 total deaths)
> Avg. new daily cases in the last week: 28.8 per 100,000 people (total: 6,366)
> Population: 3,156,145
These are all the counties in Iowa where COVID-19 is slowing (and where it’s still getting worse).

6. Arizona
> Cumulative cases of COVID-19 as of Feb. 3: 10,700 per 100,000 people (767,379 total cases)
> COVID-19 related deaths as of Feb. 3: 189 per 100,000 people (13,576 total deaths)
> Avg. new daily cases in the last week: 57.4 per 100,000 people (total: 28,818)
> Population: 7,171,646

5. Tennessee
> Cumulative cases of COVID-19 as of Feb. 3: 10,830 per 100,000 people (733,216 total cases)
> COVID-19 related deaths as of Feb. 3: 148 per 100,000 people (10,033 total deaths)
> Avg. new daily cases in the last week: 36.7 per 100,000 people (total: 17,410)
> Population: 6,770,010

4. South Dakota
> Cumulative cases of COVID-19 as of Feb. 3: 10,994 per 100,000 people (96,989 total cases)
> COVID-19 related deaths as of Feb. 3: 202 per 100,000 people (1,782 total deaths)
> Avg. new daily cases in the last week: 12.9 per 100,000 people (total: 799)
> Population: 882,235

3. Rhode Island
> Cumulative cases of COVID-19 as of Feb. 3: 11,038 per 100,000 people (116,704 total cases)
> COVID-19 related deaths as of Feb. 3: 208 per 100,000 people (2,198 total deaths)
> Avg. new daily cases in the last week: 49.9 per 100,000 people (total: 3,695)
> Population: 1,057,315

2. Utah
> Cumulative cases of COVID-19 as of Feb. 3: 11,072 per 100,000 people (350,000 total cases)
> COVID-19 related deaths as of Feb. 3: 54 per 100,000 people (1,697 total deaths)
> Avg. new daily cases in the last week: 42.1 per 100,000 people (total: 9,316)
> Population: 3,161,105
These are all the counties in Utah where COVID-19 is slowing (and where it’s still getting worse).

1. North Dakota
> Cumulative cases of COVID-19 as of Feb. 3: 12,885 per 100,000 people (97,936 total cases)
> COVID-19 related deaths as of Feb. 3: 187 per 100,000 people (1,422 total deaths)
> Avg. new daily cases in the last week: 14.6 per 100,000 people (total: 776)
> Population: 760,077
Click here to see all coronavirus data for every state.
Essential Tips for Investing: Sponsored
A financial advisor can help you understand the advantages and disadvantages of investment properties. Finding a qualified financial advisor doesn’t have to be hard. SmartAsset’s free tool matches you with up to three financial advisors who serve your area, and you can interview your advisor matches at no cost to decide which one is right for you. If you’re ready to find an advisor who can help you achieve your financial goals, get started now.
Investing in real estate can diversify your portfolio. But expanding your horizons may add additional costs. If you’re an investor looking to minimize expenses, consider checking out online brokerages. They often offer low investment fees, helping you maximize your profit.
Thank you for reading! Have some feedback for us?
Contact the 24/7 Wall St. editorial team.


