Vaccine distribution is well underway across the United States. Still, the novel coronavirus continues to spread and claim American lives. In the past week alone, there were an average of 3,011 new deaths attributed to the virus every day.
Since the first COVID-19-related death was reported in the United States on Feb. 29, 2020, there have been a total of 451,778 COVID-19 deaths nationwide, equal to about 138 for every 100,000 Americans.
Of course, deaths attributable to the virus are not evenly spread across the country. While there are still counties and county equivalents that have not reported a single COVID-19 death, nearly every state has at least one county where the number of deaths attributable to the virus per capita exceeds the national rate — sometimes by orders of magnitude. There are 17 states home to at least one county where COVID-19 deaths per capita are at least three times higher than they are nationwide. In one county in South Dakota, there have been a total of 789 coronavirus deaths for every 100,000 people.
Counties and county equivalents where COVID-19 deaths are highly concentrated are often home to larger populations of individuals at increased risk of severe illness if they are infected. One such group is retirement-age Americans. Americans 65 and older are at least 90 times more likely to die from the virus, if infected, than those in the 18 to 29 age range. The vast majority of the places on this list are home to a larger concentration of 65 and older residents than the state as a whole.
In addition to more vulnerable populations, the places on this list also tend to have a higher than average per capita COVID-19 cases. In 40 states, the county or county equivalent with the most COVID-19 deaths per 100,000 also has a higher number of confirmed cases per 100,000 than the state as a whole.
It is important to note that neither Kansas nor Rhode Island report COVID-19 fatalities at the county level, and as a result, these states were excluded from analysis.
All COVID-19 data used in this story is current as of Feb. 8, 2021.

Alabama: Lowndes County
> COVID-19 deaths in Lowndes: 410 per 100,000 people (total: 42)
> COVID-19 deaths in Alabama: 174 per 100,000 people (total: 8,523)
> COVID-19 cases in Lowndes: 12,417 per 100,000 people (total: 1,271)
> COVID-19 cases in Alabama: 9,684 per 100,000 people (total: 473,348)
> 65 and older population: 18.4% in Lowndes, 16.5% in Alabama

Alaska: Bethel Census Area
> COVID-19 deaths in Bethel: 94 per 100,000 people (total: 17)
> COVID-19 deaths in Alaska: 38 per 100,000 people (total: 277)
> COVID-19 cases in Bethel: 9,407 per 100,000 people (total: 1,697)
> COVID-19 cases in Alaska: 7,562 per 100,000 people (total: 55,768)
> 65 and older population: 7.2% in Bethel, 11.2% in Alaska
These are all the counties in Alaska where COVID-19 is slowing (and where it’s still getting worse).
Arizona: Apache County
> COVID-19 deaths in Apache: 456 per 100,000 people (total: 326)
> COVID-19 deaths in Arizona: 196 per 100,000 people (total: 14,055)
> COVID-19 cases in Apache: 13,783 per 100,000 people (total: 9,858)
> COVID-19 cases in Arizona: 10,916 per 100,000 people (total: 782,887)
> 65 and older population: 15.0% in Apache, 17.1% in Arizona

Arkansas: Fulton County
> COVID-19 deaths in Fulton: 527 per 100,000 people (total: 64)
> COVID-19 deaths in Arkansas: 169 per 100,000 people (total: 5,106)
> COVID-19 cases in Fulton: 11,055 per 100,000 people (total: 1,342)
> COVID-19 cases in Arkansas: 10,199 per 100,000 people (total: 307,373)
> 65 and older population: 25.5% in Fulton, 16.6% in Arkansas

California: Imperial County
> COVID-19 deaths in Imperial: 311 per 100,000 people (total: 560)
> COVID-19 deaths in California: 112 per 100,000 people (total: 44,150)
> COVID-19 cases in Imperial: 14,715 per 100,000 people (total: 26,518)
> COVID-19 cases in California: 8,460 per 100,000 people (total: 3,346,340)
> 65 and older population: 12.6% in Imperial, 14.0% in California

Colorado: Bent County
> COVID-19 deaths in Bent: 344 per 100,000 people (total: 20)
> COVID-19 deaths in Colorado: 101 per 100,000 people (total: 5,733)
> COVID-19 cases in Bent: 22,844 per 100,000 people (total: 1,327)
> COVID-19 cases in Colorado: 7,133 per 100,000 people (total: 406,276)
> 65 and older population: 17.9% in Bent, 13.8% in Colorado

Connecticut: Hartford County
> COVID-19 deaths in Hartford: 246 per 100,000 people (total: 2,199)
> COVID-19 deaths in Connecticut: 204 per 100,000 people (total: 7,282)
> COVID-19 cases in Hartford: 7,439 per 100,000 people (total: 66,561)
> COVID-19 cases in Connecticut: 7,382 per 100,000 people (total: 263,739)
> 65 and older population: 16.8% in Hartford, 16.8% in Connecticut

Delaware: Sussex County
> COVID-19 deaths in Sussex: 174 per 100,000 people (total: 383)
> COVID-19 deaths in Delaware: 125 per 100,000 people (total: 1,208)
> COVID-19 cases in Sussex: 9,767 per 100,000 people (total: 21,442)
> COVID-19 cases in Delaware: 8,368 per 100,000 people (total: 80,931)
> 65 and older population: 27.0% in Sussex, 18.2% in Delaware
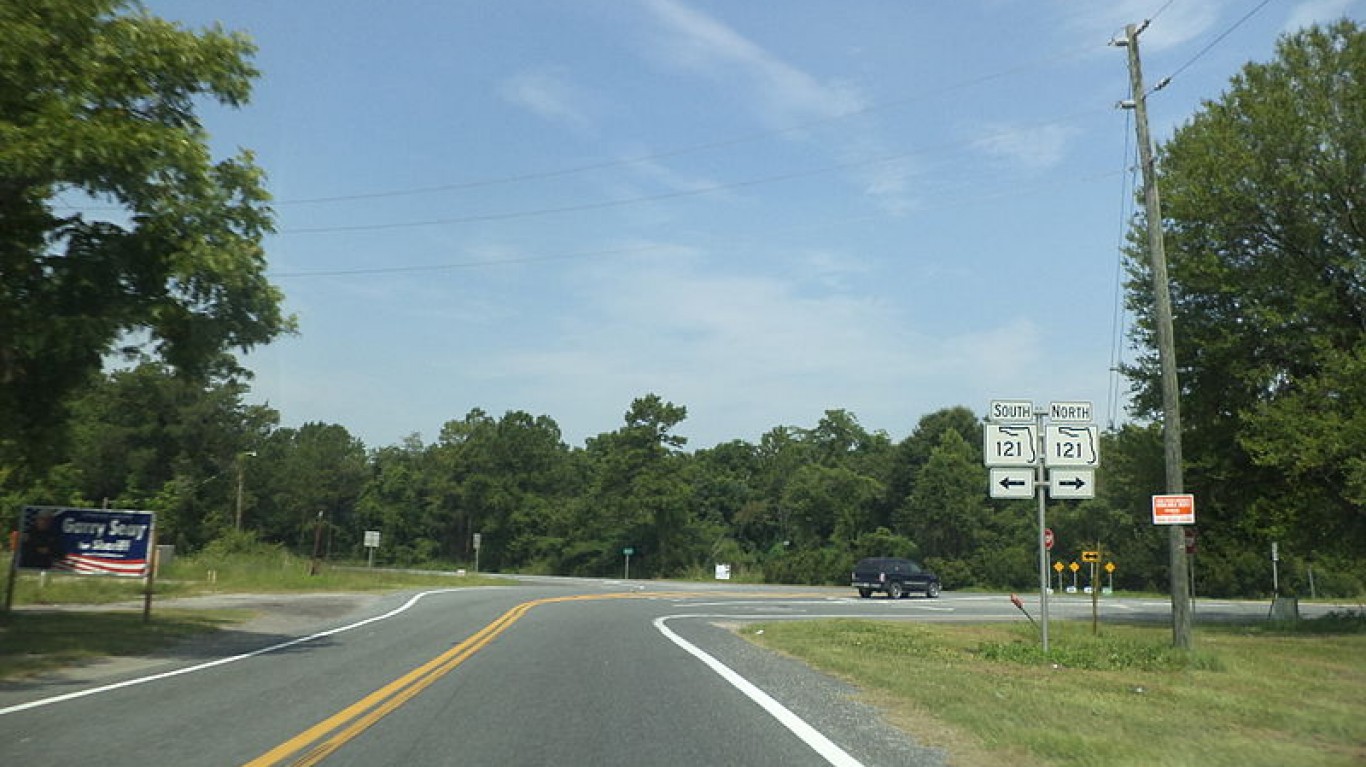
Florida: Union County
> COVID-19 deaths in Union: 459 per 100,000 people (total: 70)
> COVID-19 deaths in Florida: 133 per 100,000 people (total: 28,280)
> COVID-19 cases in Union: 11,123 per 100,000 people (total: 1,695)
> COVID-19 cases in Florida: 8,375 per 100,000 people (total: 1,783,720)
> 65 and older population: 15.0% in Union, 20.1% in Florida
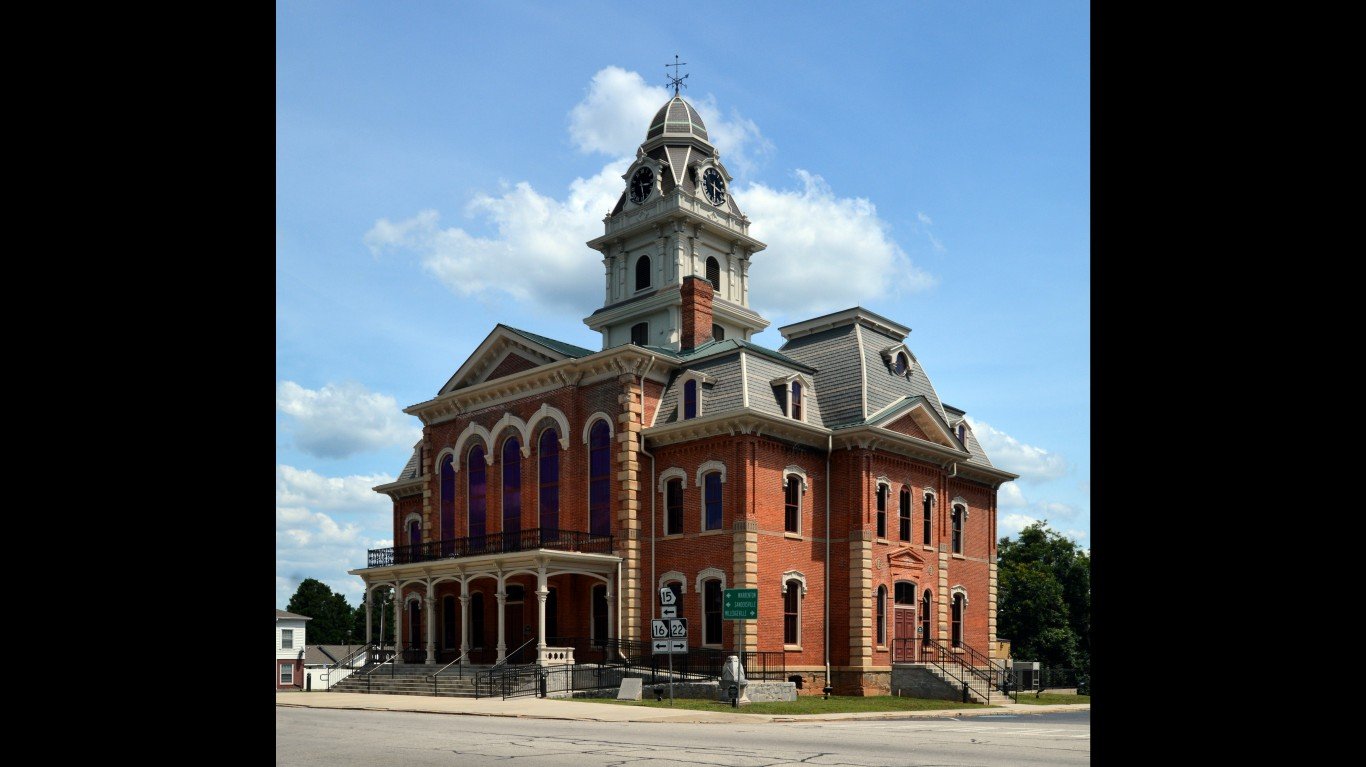
Georgia: Hancock County
> COVID-19 deaths in Hancock: 644 per 100,000 people (total: 55)
> COVID-19 deaths in Georgia: 144 per 100,000 people (total: 15,130)
> COVID-19 cases in Hancock: 9,818 per 100,000 people (total: 838)
> COVID-19 cases in Georgia: 8,971 per 100,000 people (total: 943,695)
> 65 and older population: 22.4% in Hancock, 13.5% in Georgia

Hawaii: Honolulu County
> COVID-19 deaths in Honolulu: 34 per 100,000 people (total: 335)
> COVID-19 deaths in Hawaii: 29 per 100,000 people (total: 418)
> COVID-19 cases in Honolulu: 2,163 per 100,000 people (total: 21,361)
> COVID-19 cases in Hawaii: 1,866 per 100,000 people (total: 26,500)
> 65 and older population: 17.3% in Honolulu, 17.8% in Hawaii
These are all the counties in Hawaii where COVID-19 is slowing (and where it’s still getting worse).

Idaho: Shoshone County
> COVID-19 deaths in Shoshone: 247 per 100,000 people (total: 31)
> COVID-19 deaths in Idaho: 101 per 100,000 people (total: 1,776)
> COVID-19 cases in Shoshone: 7,832 per 100,000 people (total: 981)
> COVID-19 cases in Idaho: 9,443 per 100,000 people (total: 165,658)
> 65 and older population: 22.3% in Shoshone, 15.4% in Idaho
These are all the counties in Idaho where COVID-19 is slowing (and where it’s still getting worse).
Illinois: Stark County
> COVID-19 deaths in Stark: 382 per 100,000 people (total: 21)
> COVID-19 deaths in Illinois: 166 per 100,000 people (total: 21,146)
> COVID-19 cases in Stark: 9,127 per 100,000 people (total: 502)
> COVID-19 cases in Illinois: 8,795 per 100,000 people (total: 1,120,528)
> 65 and older population: 21.9% in Stark, 15.2% in Illinois

Indiana: Decatur County
> COVID-19 deaths in Decatur: 331 per 100,000 people (total: 88)
> COVID-19 deaths in Indiana: 171 per 100,000 people (total: 11,459)
> COVID-19 cases in Decatur: 9,958 per 100,000 people (total: 2,644)
> COVID-19 cases in Indiana: 9,575 per 100,000 people (total: 640,744)
> 65 and older population: 16.5% in Decatur, 15.4% in Indiana

Iowa: Harrison County
> COVID-19 deaths in Harrison: 474 per 100,000 people (total: 67)
> COVID-19 deaths in Iowa: 162 per 100,000 people (total: 5,110)
> COVID-19 cases in Harrison: 11,568 per 100,000 people (total: 1,636)
> COVID-19 cases in Iowa: 10,287 per 100,000 people (total: 324,666)
> 65 and older population: 19.4% in Harrison, 16.7% in Iowa
These are all the counties in Iowa where COVID-19 is slowing (and where it’s still getting worse).

Kentucky: Robertson County
> COVID-19 deaths in Robertson: 560 per 100,000 people (total: 12)
> COVID-19 deaths in Kentucky: 92 per 100,000 people (total: 4,091)
> COVID-19 cases in Robertson: 8,493 per 100,000 people (total: 182)
> COVID-19 cases in Kentucky: 8,477 per 100,000 people (total: 378,793)
> 65 and older population: 21.5% in Robertson, 16.0% in Kentucky

Louisiana: East Feliciana Parish
> COVID-19 deaths in East Feliciana: 528 per 100,000 people (total: 103)
> COVID-19 deaths in Louisiana: 196 per 100,000 people (total: 9,142)
> COVID-19 cases in East Feliciana: 14,821 per 100,000 people (total: 2,890)
> COVID-19 cases in Louisiana: 8,862 per 100,000 people (total: 412,989)
> 65 and older population: 17.1% in East Feliciana, 15.0% in Louisiana

Maine: Oxford County
> COVID-19 deaths in Oxford: 70 per 100,000 people (total: 40)
> COVID-19 deaths in Maine: 48 per 100,000 people (total: 636)
> COVID-19 cases in Oxford: 3,566 per 100,000 people (total: 2,044)
> COVID-19 cases in Maine: 3,095 per 100,000 people (total: 41,419)
> 65 and older population: 21.2% in Oxford, 20.0% in Maine
These are all the counties in Maine where COVID-19 is slowing (and where it’s still getting worse).
Maryland: Allegany County
> COVID-19 deaths in Allegany: 265 per 100,000 people (total: 191)
> COVID-19 deaths in Maryland: 122 per 100,000 people (total: 7,372)
> COVID-19 cases in Allegany: 8,776 per 100,000 people (total: 6,317)
> COVID-19 cases in Maryland: 6,033 per 100,000 people (total: 364,553)
> 65 and older population: 19.8% in Allegany, 15.0% in Maryland

Massachusetts: Hampden County
> COVID-19 deaths in Hampden: 264 per 100,000 people (total: 1,238)
> COVID-19 deaths in Massachusetts: 218 per 100,000 people (total: 15,054)
> COVID-19 cases in Hampden: 8,263 per 100,000 people (total: 38,761)
> COVID-19 cases in Massachusetts: 7,900 per 100,000 people (total: 545,303)
> 65 and older population: 16.5% in Hampden, 16.2% in Massachusetts

Michigan: Iron County
> COVID-19 deaths in Iron: 428 per 100,000 people (total: 48)
> COVID-19 deaths in Michigan: 159 per 100,000 people (total: 15,863)
> COVID-19 cases in Iron: 8,214 per 100,000 people (total: 921)
> COVID-19 cases in Michigan: 6,231 per 100,000 people (total: 622,813)
> 65 and older population: 30.0% in Iron, 16.7% in Michigan
Minnesota: Kittson County
> COVID-19 deaths in Kittson: 484 per 100,000 people (total: 21)
> COVID-19 deaths in Minnesota: 112 per 100,000 people (total: 6,302)
> COVID-19 cases in Kittson: 8,946 per 100,000 people (total: 388)
> COVID-19 cases in Minnesota: 8,353 per 100,000 people (total: 468,682)
> 65 and older population: 23.9% in Kittson, 15.4% in Minnesota

Mississippi: Neshoba County
> COVID-19 deaths in Neshoba: 558 per 100,000 people (total: 164)
> COVID-19 deaths in Mississippi: 210 per 100,000 people (total: 6,270)
> COVID-19 cases in Neshoba: 12,357 per 100,000 people (total: 3,630)
> COVID-19 cases in Mississippi: 9,453 per 100,000 people (total: 282,313)
> 65 and older population: 15.7% in Neshoba, 15.4% in Mississippi
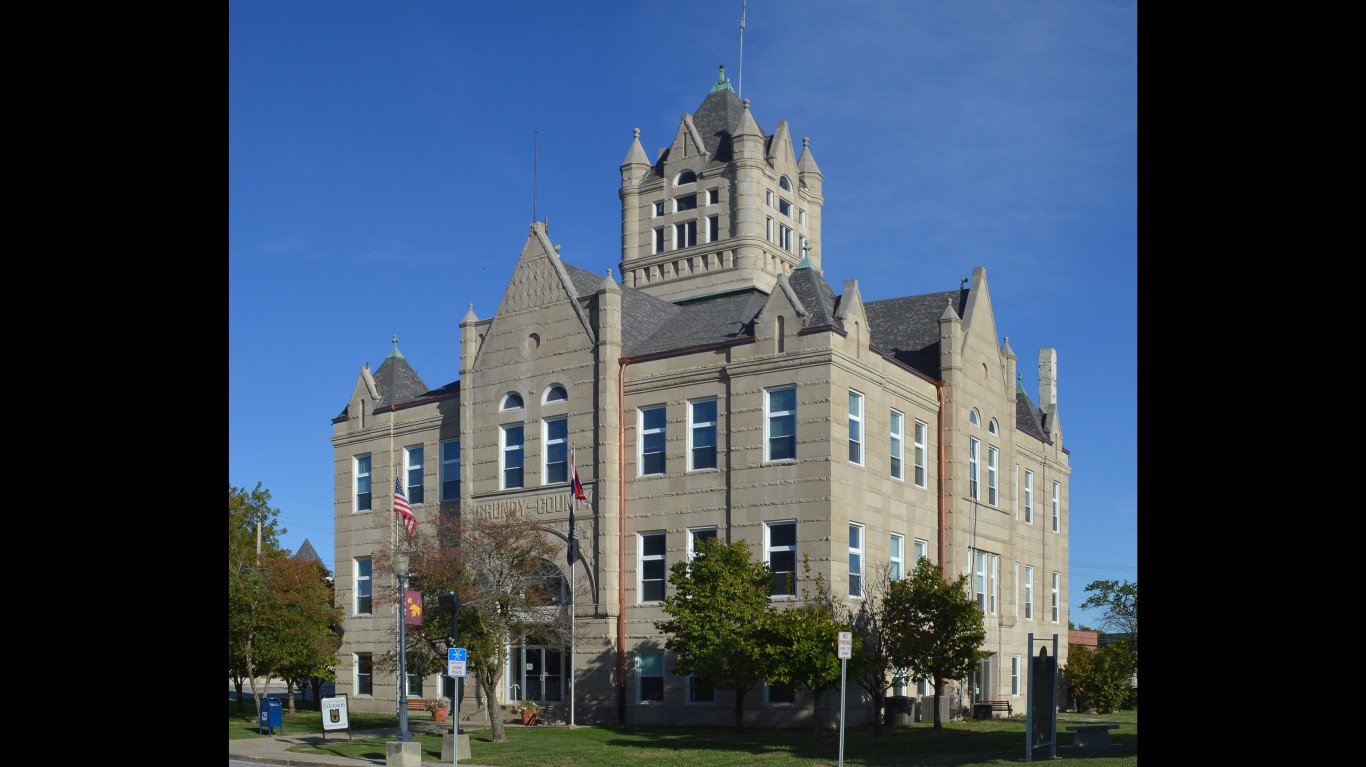
Missouri: Grundy County
> COVID-19 deaths in Grundy: 319 per 100,000 people (total: 32)
> COVID-19 deaths in Missouri: 117 per 100,000 people (total: 7,143)
> COVID-19 cases in Grundy: 8,108 per 100,000 people (total: 814)
> COVID-19 cases in Missouri: 7,617 per 100,000 people (total: 466,664)
> 65 and older population: 21.7% in Grundy, 16.5% in Missouri

Montana: Big Horn County
> COVID-19 deaths in Big Horn: 508 per 100,000 people (total: 68)
> COVID-19 deaths in Montana: 124 per 100,000 people (total: 1,314)
> COVID-19 cases in Big Horn: 17,285 per 100,000 people (total: 2,312)
> COVID-19 cases in Montana: 9,029 per 100,000 people (total: 95,914)
> 65 and older population: 12.1% in Big Horn, 18.2% in Montana
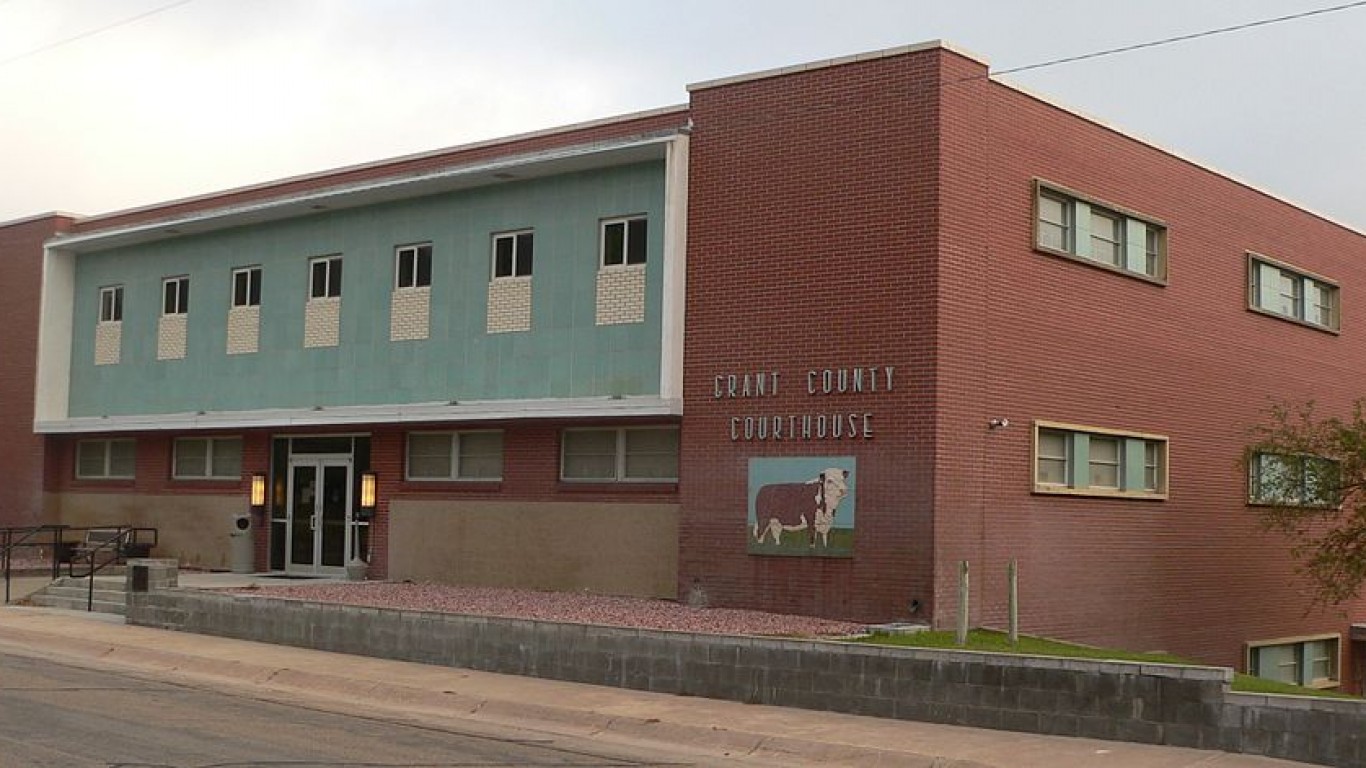
Nebraska: Grant County
> COVID-19 deaths in Grant: 557 per 100,000 people (total: 4)
> COVID-19 deaths in Nebraska: 102 per 100,000 people (total: 1,968)
> COVID-19 cases in Grant: 4,039 per 100,000 people (total: 29)
> COVID-19 cases in Nebraska: 10,047 per 100,000 people (total: 193,826)
> 65 and older population: 21.1% in Grant, 15.4% in Nebraska

Nevada: Pershing County
> COVID-19 deaths in Pershing: 287 per 100,000 people (total: 19)
> COVID-19 deaths in Nevada: 149 per 100,000 people (total: 4,522)
> COVID-19 cases in Pershing: 13,886 per 100,000 people (total: 918)
> COVID-19 cases in Nevada: 9,379 per 100,000 people (total: 284,590)
> 65 and older population: 15.7% in Pershing, 15.4% in Nevada
These are all the counties in Nevada where COVID-19 is slowing (and where it’s still getting worse).

New Hampshire: Belknap County
> COVID-19 deaths in Belknap: 148 per 100,000 people (total: 90)
> COVID-19 deaths in New Hampshire: 81 per 100,000 people (total: 1,104)
> COVID-19 cases in Belknap: 4,830 per 100,000 people (total: 2,929)
> COVID-19 cases in New Hampshire: 5,041 per 100,000 people (total: 68,379)
> 65 and older population: 21.4% in Belknap, 17.5% in New Hampshire
New Jersey: Essex County
> COVID-19 deaths in Essex: 324 per 100,000 people (total: 2,574)
> COVID-19 deaths in New Jersey: 247 per 100,000 people (total: 22,011)
> COVID-19 cases in Essex: 8,521 per 100,000 people (total: 67,620)
> COVID-19 cases in New Jersey: 8,135 per 100,000 people (total: 724,679)
> 65 and older population: 13.4% in Essex, 15.9% in New Jersey

New Mexico: McKinley County
> COVID-19 deaths in McKinley: 582 per 100,000 people (total: 424)
> COVID-19 deaths in New Mexico: 163 per 100,000 people (total: 3,412)
> COVID-19 cases in McKinley: 16,125 per 100,000 people (total: 11,747)
> COVID-19 cases in New Mexico: 8,488 per 100,000 people (total: 177,867)
> 65 and older population: 11.9% in McKinley, 16.9% in New Mexico

New York: Bronx County
> COVID-19 deaths in Bronx: 269 per 100,000 people (total: 3,867)
> COVID-19 deaths in New York: 186 per 100,000 people (total: 36,339)
> COVID-19 cases in Bronx: 8,491 per 100,000 people (total: 122,084)
> COVID-19 cases in New York: 7,569 per 100,000 people (total: 1,479,220)
> 65 and older population: 12.5% in Bronx, 16.1% in New York

North Carolina: Rutherford County
> COVID-19 deaths in Rutherford: 280 per 100,000 people (total: 186)
> COVID-19 deaths in North Carolina: 96 per 100,000 people (total: 9,991)
> COVID-19 cases in Rutherford: 9,666 per 100,000 people (total: 6,431)
> COVID-19 cases in North Carolina: 7,697 per 100,000 people (total: 799,279)
> 65 and older population: 21.1% in Rutherford, 15.9% in North Carolina

North Dakota: Dickey County
> COVID-19 deaths in Dickey: 644 per 100,000 people (total: 32)
> COVID-19 deaths in North Dakota: 188 per 100,000 people (total: 1,428)
> COVID-19 cases in Dickey: 14,628 per 100,000 people (total: 727)
> COVID-19 cases in North Dakota: 12,918 per 100,000 people (total: 98,184)
> 65 and older population: 20.4% in Dickey, 14.9% in North Dakota
Ohio: Noble County
> COVID-19 deaths in Noble: 284 per 100,000 people (total: 41)
> COVID-19 deaths in Ohio: 100 per 100,000 people (total: 11,695)
> COVID-19 cases in Noble: 8,641 per 100,000 people (total: 1,248)
> COVID-19 cases in Ohio: 7,889 per 100,000 people (total: 922,143)
> 65 and older population: 26.7% in Noble, 16.7% in Ohio
These are all the counties in Ohio where COVID-19 is slowing (and where it’s still getting worse).

Oklahoma: Greer County
> COVID-19 deaths in Greer: 252 per 100,000 people (total: 15)
> COVID-19 deaths in Oklahoma: 97 per 100,000 people (total: 3,817)
> COVID-19 cases in Greer: 8,127 per 100,000 people (total: 483)
> COVID-19 cases in Oklahoma: 10,271 per 100,000 people (total: 404,994)
> 65 and older population: 17.5% in Greer, 15.3% in Oklahoma

Oregon: Malheur County
> COVID-19 deaths in Malheur: 184 per 100,000 people (total: 56)
> COVID-19 deaths in Oregon: 48 per 100,000 people (total: 2,024)
> COVID-19 cases in Malheur: 10,838 per 100,000 people (total: 3,298)
> COVID-19 cases in Oregon: 3,518 per 100,000 people (total: 147,419)
> 65 and older population: 16.4% in Malheur, 17.2% in Oregon
These are all the counties in Oregon where COVID-19 is slowing (and where it’s still getting worse).
Pennsylvania: Mifflin County
> COVID-19 deaths in Mifflin: 349 per 100,000 people (total: 162)
> COVID-19 deaths in Pennsylvania: 175 per 100,000 people (total: 22,471)
> COVID-19 cases in Mifflin: 9,525 per 100,000 people (total: 4,416)
> COVID-19 cases in Pennsylvania: 6,815 per 100,000 people (total: 872,825)
> 65 and older population: 21.1% in Mifflin, 17.8% in Pennsylvania

South Carolina: Bamberg County
> COVID-19 deaths in Bamberg: 315 per 100,000 people (total: 46)
> COVID-19 deaths in South Carolina: 151 per 100,000 people (total: 7,690)
> COVID-19 cases in Bamberg: 9,027 per 100,000 people (total: 1,318)
> COVID-19 cases in South Carolina: 9,213 per 100,000 people (total: 468,403)
> 65 and older population: 21.0% in Bamberg, 17.2% in South Carolina

South Dakota: Jerauld County
> COVID-19 deaths in Jerauld: 789 per 100,000 people (total: 16)
> COVID-19 deaths in South Dakota: 205 per 100,000 people (total: 1,809)
> COVID-19 cases in Jerauld: 13,208 per 100,000 people (total: 268)
> COVID-19 cases in South Dakota: 11,046 per 100,000 people (total: 97,449)
> 65 and older population: 29.6% in Jerauld, 16.3% in South Dakota

Tennessee: Pickett County
> COVID-19 deaths in Pickett: 413 per 100,000 people (total: 21)
> COVID-19 deaths in Tennessee: 156 per 100,000 people (total: 10,566)
> COVID-19 cases in Pickett: 14,013 per 100,000 people (total: 713)
> COVID-19 cases in Tennessee: 11,017 per 100,000 people (total: 745,826)
> 65 and older population: 26.9% in Pickett, 16.0% in Tennessee

Texas: Motley County
> COVID-19 deaths in Motley: 606 per 100,000 people (total: 7)
> COVID-19 deaths in Texas: 135 per 100,000 people (total: 38,700)
> COVID-19 cases in Motley: 6,920 per 100,000 people (total: 80)
> COVID-19 cases in Texas: 8,680 per 100,000 people (total: 2,491,227)
> 65 and older population: 31.4% in Motley, 12.3% in Texas
These are all the counties in Texas where COVID-19 is slowing (and where it’s still getting worse).

Utah: San Juan County
> COVID-19 deaths in San Juan: 236 per 100,000 people (total: 36)
> COVID-19 deaths in Utah: 55 per 100,000 people (total: 1,738)
> COVID-19 cases in San Juan: 11,583 per 100,000 people (total: 1,770)
> COVID-19 cases in Utah: 11,234 per 100,000 people (total: 355,122)
> 65 and older population: 13.7% in San Juan, 10.8% in Utah
These are all the counties in Utah where COVID-19 is slowing (and where it’s still getting worse).
Vermont: Franklin County
> COVID-19 deaths in Franklin: 71 per 100,000 people (total: 35)
> COVID-19 deaths in Vermont: 29 per 100,000 people (total: 183)
> COVID-19 cases in Franklin: 1,889 per 100,000 people (total: 926)
> COVID-19 cases in Vermont: 2,083 per 100,000 people (total: 13,046)
> 65 and older population: 15.6% in Franklin, 18.8% in Vermont

Virginia: Emporia
> COVID-19 deaths in Emporia: 650 per 100,000 people (total: 35)
> COVID-19 deaths in Virginia: 80 per 100,000 people (total: 6,820)
> COVID-19 cases in Emporia: 11,095 per 100,000 people (total: 597)
> COVID-19 cases in Virginia: 6,232 per 100,000 people (total: 530,825)
> 65 and older population: 16.8% in Emporia, 15.0% in Virginia

Washington: Garfield County
> COVID-19 deaths in Garfield: 180 per 100,000 people (total: 4)
> COVID-19 deaths in Washington: 59 per 100,000 people (total: 4,451)
> COVID-19 cases in Garfield: 4,991 per 100,000 people (total: 111)
> COVID-19 cases in Washington: 4,289 per 100,000 people (total: 323,214)
> 65 and older population: 24.7% in Garfield, 15.1% in Washington

West Virginia: Hancock County
> COVID-19 deaths in Hancock: 280 per 100,000 people (total: 83)
> COVID-19 deaths in West Virginia: 118 per 100,000 people (total: 2,131)
> COVID-19 cases in Hancock: 8,541 per 100,000 people (total: 2,535)
> COVID-19 cases in West Virginia: 6,928 per 100,000 people (total: 125,106)
> 65 and older population: 22.6% in Hancock, 19.4% in West Virginia

Wisconsin: Iron County
> COVID-19 deaths in Iron: 332 per 100,000 people (total: 19)
> COVID-19 deaths in Wisconsin: 104 per 100,000 people (total: 6,055)
> COVID-19 cases in Iron: 8,556 per 100,000 people (total: 489)
> COVID-19 cases in Wisconsin: 9,467 per 100,000 people (total: 550,369)
> 65 and older population: 30.1% in Iron, 16.5% in Wisconsin
Wyoming: Washakie County
> COVID-19 deaths in Washakie: 320 per 100,000 people (total: 26)
> COVID-19 deaths in Wyoming: 108 per 100,000 people (total: 624)
> COVID-19 cases in Washakie: 10,702 per 100,000 people (total: 870)
> COVID-19 cases in Wyoming: 9,136 per 100,000 people (total: 52,784)
> 65 and older population: 21.1% in Washakie, 15.7% in Wyoming
Click here to see all coronavirus data for every state.
Contact [email protected] for any questions or corrections.