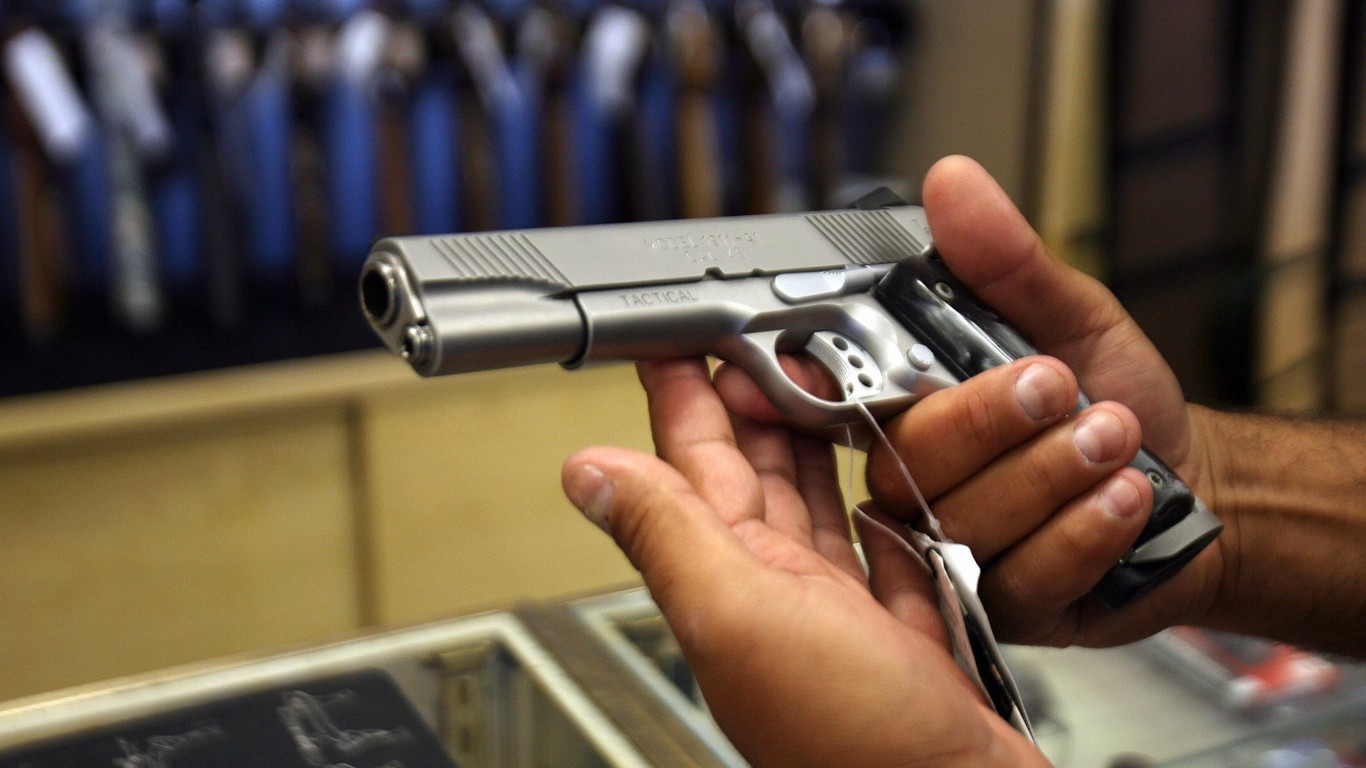
Based on the FBI’s background check database, U.S. gun sales in March totaled 4.6 million, 25% more than in March of last year — which itself was up by 42.4% from March 2019. This was one of the largest totals for any month since the government began recording background checks in November 1998.
The year-over-year increase in March should not be taken as unusual, nor should the 40% rise in gun sales from 2019 to 2020 — from 28,369,750 to 39,695,315 — be viewed as an anomaly. The number of gun sales has grown most years since 1999, the first complete year of FBI records. Sales were 9,138,123 that year. They first topped 10 million in 2006, 15 million in 2011, 20 million in 2013, and 25 million in 2016.
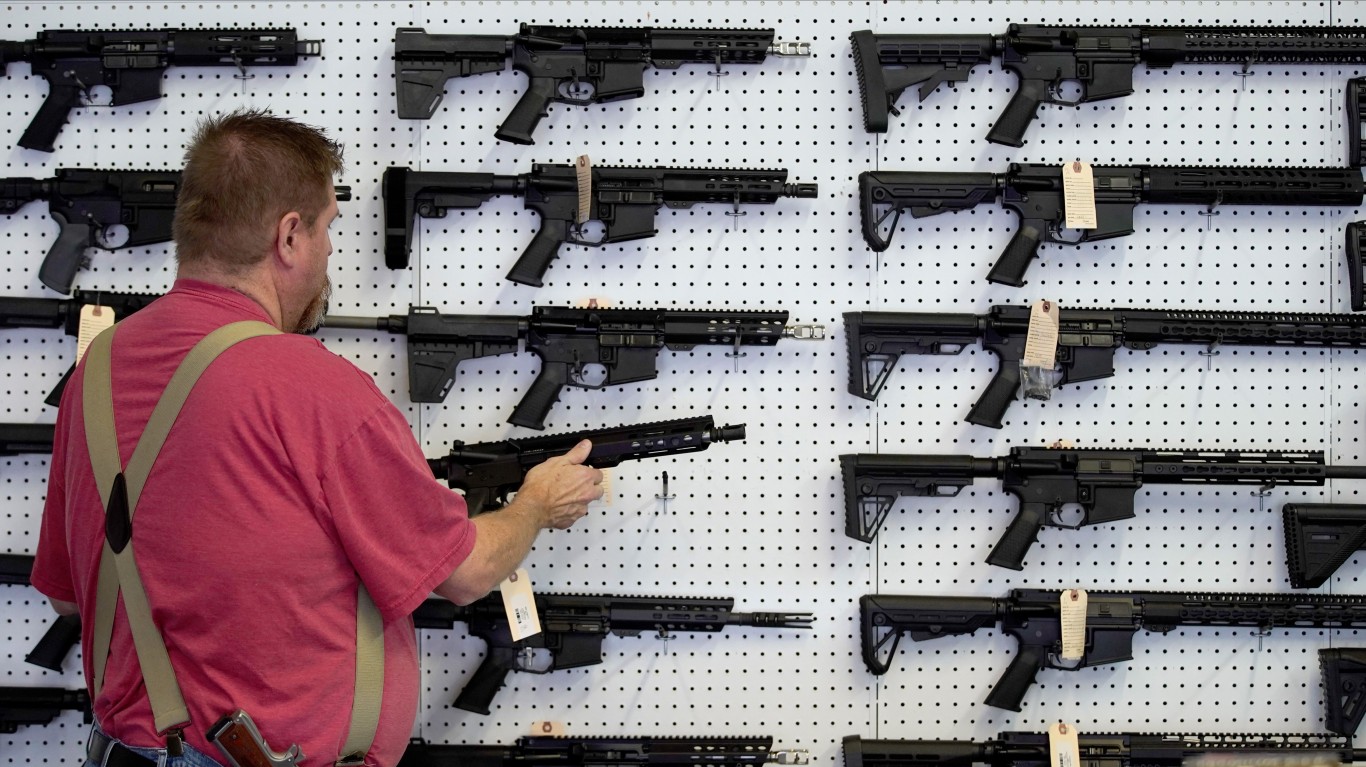
Why have gun sales risen so much? According to CNN, it is not unusual for gun sales to spike when a Democrat wins the White House. The election and re-election of Barack Obama in 2008 and 2012 were both followed by gun sale surges. In contrast, sales grew only slightly after George W. Bush won his second term in 2004, and actually decreased after the 2016 election of Donald Trump.
That doesn’t explain the spike of nearly 37% between February and March of this year, though. Firearms trade group the National Shooting Sports Foundation said it was likely in response to a series of mass shootings that took place across the country that month in places like Atlanta; Boulder, Colorado; and Essex, Maryland. (These are the most dangerous cities in America.)
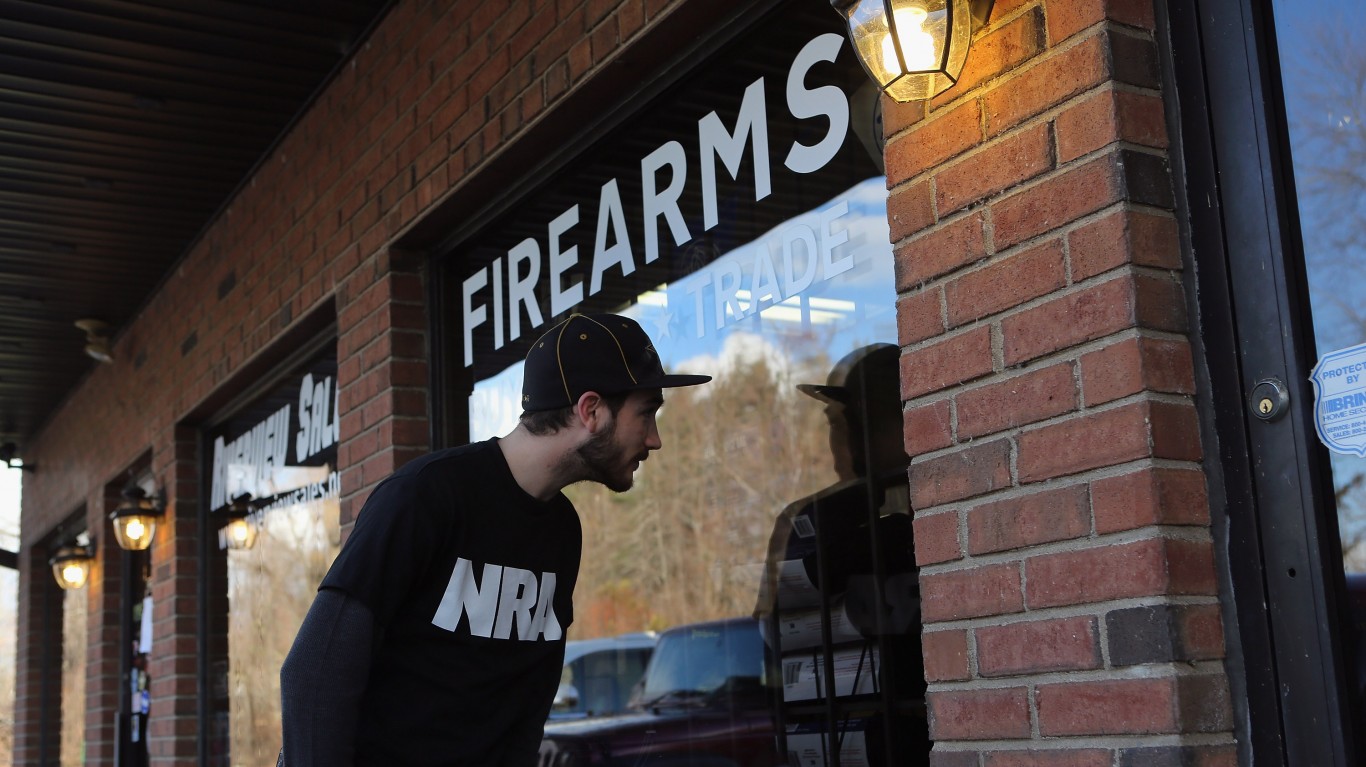
Many Americans purchase firearms in the wake of events like these, perhaps because they fear losing access to them as anti-gun activists and some politicians renew their calls to impose new restrictions of the sale of such weapons.
Increases in gun sales have always varied substantially from state to state. In March, Illinois recorded the highest number, at 1,427,917, up from 902,020 the month before. That accounts for over 30% of March gun sales nationally, though the state has slightly less than 4% of the U.S. population.
On the other hand, sales in the state that recorded the second most gun sales in March, Kentucky, actually decreased from February, from 378,449 to just over 330,000. That still represents about 7% of the national total, however, for a state with only 1.3% of the U.S. population. These are the states where people are buying the most guns.
Click here to see how many guns were sold in every state.
The FBI warns that a one-to-one correlation can’t be made between background checks and actual sales, due to varying state laws and selling scenarios. However, the data it publishes monthly through the National Instant Criminal Background Check System (NCIS) is considered the best available means of estimating purchases. 24/7 Wall St. reviewed that data to determine how many guns were bought in every state between Mar. 1 and Mar. 31, 2021.
At the current pace, gun sales in America will reach over 49 million this year. It is too early to say whether the March trend will continue. However, it is nearly assured that 2021 will set another annual record.

50. Hawaii
> Firearm background checks in Mar 2021: 125.01 per 100,000 (1,770 total)
> Firearm background checks in Mar 2020: 130.17 per 100,000 (1,843 total)
> YoY change in background checks: -3.96% (17th largest decrease)
> Firearm background checks in 2020: 1,419.76 per 100,000 (20,102 total)
> Population: 1,415,872
[in-text-ad]

49. Rhode Island
> Firearm background checks in Mar 2021: 467.92 per 100,000 (4,957 total)
> Firearm background checks in Mar 2020: 582.33 per 100,000 (6,169 total)
> YoY change in background checks: -19.65% (3rd largest decrease)
> Firearm background checks in 2020: 4,849.06 per 100,000 (51,369 total)
> Population: 1,059,361
[recirclink id=828031]

48. Vermont
> Firearm background checks in Mar 2021: 946.97 per 100,000 (5,909 total)
> Firearm background checks in Mar 2020: 1,125.50 per 100,000 (7,023 total)
> YoY change in background checks: -15.86% (6th largest decrease)
> Firearm background checks in 2020: 9,289.43 per 100,000 (57,965 total)
> Population: 623,989

47. Delaware
> Firearm background checks in Mar 2021: 747.61 per 100,000 (7,280 total)
> Firearm background checks in Mar 2020: 834.19 per 100,000 (8,123 total)
> YoY change in background checks: -10.38% (11th largest decrease)
> Firearm background checks in 2020: 7,913.31 per 100,000 (77,057 total)
> Population: 973,764
[in-text-ad-2]

46. North Dakota
> Firearm background checks in Mar 2021: 1,207.25 per 100,000 (9,200 total)
> Firearm background checks in Mar 2020: 1,198.85 per 100,000 (9,136 total)
> YoY change in background checks: +0.70% (28th largest increase)
> Firearm background checks in 2020: 11,214.97 per 100,000 (85,465 total)
> Population: 762,062

45. Wyoming
> Firearm background checks in Mar 2021: 1,615.18 per 100,000 (9,348 total)
> Firearm background checks in Mar 2020: 1,528.62 per 100,000 (8,847 total)
> YoY change in background checks: +5.66% (22nd largest increase)
> Firearm background checks in 2020: 15,789.65 per 100,000 (91,384 total)
> Population: 578,759
[in-text-ad]

44. Alaska
> Firearm background checks in Mar 2021: 1,390.21 per 100,000 (10,170 total)
> Firearm background checks in Mar 2020: 1,358.63 per 100,000 (9,939 total)
> YoY change in background checks: +2.32% (26th largest increase)
> Firearm background checks in 2020: 13,526.44 per 100,000 (98,952 total)
> Population: 731,545
[recirclink id=647909]

43. Nebraska
> Firearm background checks in Mar 2021: 561.41 per 100,000 (10,860 total)
> Firearm background checks in Mar 2020: 576.61 per 100,000 (11,154 total)
> YoY change in background checks: -2.64% (19th largest decrease)
> Firearm background checks in 2020: 5,402.74 per 100,000 (104,511 total)
> Population: 1,934,408

42. South Dakota
> Firearm background checks in Mar 2021: 1,405.06 per 100,000 (12,430 total)
> Firearm background checks in Mar 2020: 1,280.95 per 100,000 (11,332 total)
> YoY change in background checks: +9.69% (15th largest increase)
> Firearm background checks in 2020: 13,050.00 per 100,000 (115,448 total)
> Population: 884,659
[in-text-ad-2]

41. Maine
> Firearm background checks in Mar 2021: 1,081.38 per 100,000 (14,536 total)
> Firearm background checks in Mar 2020: 1,088.15 per 100,000 (14,627 total)
> YoY change in background checks: -0.62% (22nd largest decrease)
> Firearm background checks in 2020: 10,202.93 per 100,000 (137,149 total)
> Population: 1,344,212

40. New Hampshire
> Firearm background checks in Mar 2021: 1,263.95 per 100,000 (17,186 total)
> Firearm background checks in Mar 2020: 1,652.26 per 100,000 (22,466 total)
> YoY change in background checks: -23.50% (largest decrease)
> Firearm background checks in 2020: 12,845.52 per 100,000 (174,662 total)
> Population: 1,359,711
[in-text-ad]

39. Montana
> Firearm background checks in Mar 2021: 1,714.95 per 100,000 (18,329 total)
> Firearm background checks in Mar 2020: 1,579.84 per 100,000 (16,885 total)
> YoY change in background checks: +8.55% (18th largest increase)
> Firearm background checks in 2020: 16,158.17 per 100,000 (172,695 total)
> Population: 1,068,778
[recirclink id=839643]

38. Nevada
> Firearm background checks in Mar 2021: 685.06 per 100,000 (21,101 total)
> Firearm background checks in Mar 2020: 721.91 per 100,000 (22,236 total)
> YoY change in background checks: -5.10% (16th largest decrease)
> Firearm background checks in 2020: 7,121.36 per 100,000 (219,349 total)
> Population: 3,080,156

37. New Mexico
> Firearm background checks in Mar 2021: 1,098.04 per 100,000 (23,024 total)
> Firearm background checks in Mar 2020: 1,171.82 per 100,000 (24,571 total)
> YoY change in background checks: -6.30% (15th largest decrease)
> Firearm background checks in 2020: 9,836.38 per 100,000 (206,252 total)
> Population: 2,096,829
[in-text-ad-2]

36. New Jersey
> Firearm background checks in Mar 2021: 276.54 per 100,000 (24,563 total)
> Firearm background checks in Mar 2020: 122.97 per 100,000 (10,922 total)
> YoY change in background checks: +124.89% (largest increase)
> Firearm background checks in 2020: 2,002.90 per 100,000 (177,901 total)
> Population: 8,882,190

35. Kansas
> Firearm background checks in Mar 2021: 923.86 per 100,000 (26,915 total)
> Firearm background checks in Mar 2020: 1,023.44 per 100,000 (29,816 total)
> YoY change in background checks: -9.73% (13th largest decrease)
> Firearm background checks in 2020: 8,567.18 per 100,000 (249,589 total)
> Population: 2,913,314
[in-text-ad]

34. West Virginia
> Firearm background checks in Mar 2021: 1,530.34 per 100,000 (27,426 total)
> Firearm background checks in Mar 2020: 1,470.08 per 100,000 (26,346 total)
> YoY change in background checks: +4.10% (25th largest increase)
> Firearm background checks in 2020: 14,826.07 per 100,000 (265,705 total)
> Population: 1,792,147
[recirclink id=800410]

33. Connecticut
> Firearm background checks in Mar 2021: 785.94 per 100,000 (28,021 total)
> Firearm background checks in Mar 2020: 648.00 per 100,000 (23,103 total)
> YoY change in background checks: +21.29% (7th largest increase)
> Firearm background checks in 2020: 6,148.93 per 100,000 (219,227 total)
> Population: 3,565,287

32. Massachusetts
> Firearm background checks in Mar 2021: 409.97 per 100,000 (28,257 total)
> Firearm background checks in Mar 2020: 342.10 per 100,000 (23,579 total)
> YoY change in background checks: +19.84% (8th largest increase)
> Firearm background checks in 2020: 3,809.69 per 100,000 (262,583 total)
> Population: 6,892,503
[in-text-ad-2]

31. Maryland
> Firearm background checks in Mar 2021: 508.69 per 100,000 (30,754 total)
> Firearm background checks in Mar 2020: 486.53 per 100,000 (29,414 total)
> YoY change in background checks: +4.56% (23rd largest increase)
> Firearm background checks in 2020: 5,004.61 per 100,000 (302,563 total)
> Population: 6,045,680

30. Iowa
> Firearm background checks in Mar 2021: 1,041.82 per 100,000 (32,870 total)
> Firearm background checks in Mar 2020: 781.35 per 100,000 (24,652 total)
> YoY change in background checks: +33.34% (5th largest increase)
> Firearm background checks in 2020: 8,577.12 per 100,000 (270,614 total)
> Population: 3,155,070
[in-text-ad]

29. Arkansas
> Firearm background checks in Mar 2021: 1,131.09 per 100,000 (34,134 total)
> Firearm background checks in Mar 2020: 1,048.81 per 100,000 (31,651 total)
> YoY change in background checks: +7.84% (20th largest increase)
> Firearm background checks in 2020: 10,760.84 per 100,000 (324,741 total)
> Population: 3,017,804
[recirclink id=828031]

28. Idaho
> Firearm background checks in Mar 2021: 1,949.51 per 100,000 (34,839 total)
> Firearm background checks in Mar 2020: 1,734.07 per 100,000 (30,989 total)
> YoY change in background checks: +12.42% (12th largest increase)
> Firearm background checks in 2020: 15,740.00 per 100,000 (281,284 total)
> Population: 1,787,065

27. Mississippi
> Firearm background checks in Mar 2021: 1,277.86 per 100,000 (38,031 total)
> Firearm background checks in Mar 2020: 1,128.40 per 100,000 (33,583 total)
> YoY change in background checks: +13.24% (10th largest increase)
> Firearm background checks in 2020: 12,325.63 per 100,000 (366,829 total)
> Population: 2,976,149
[in-text-ad-2]

26. Louisiana
> Firearm background checks in Mar 2021: 1,003.12 per 100,000 (46,633 total)
> Firearm background checks in Mar 2020: 903.78 per 100,000 (42,015 total)
> YoY change in background checks: +10.99% (14th largest increase)
> Firearm background checks in 2020: 9,261.26 per 100,000 (430,537 total)
> Population: 4,648,794
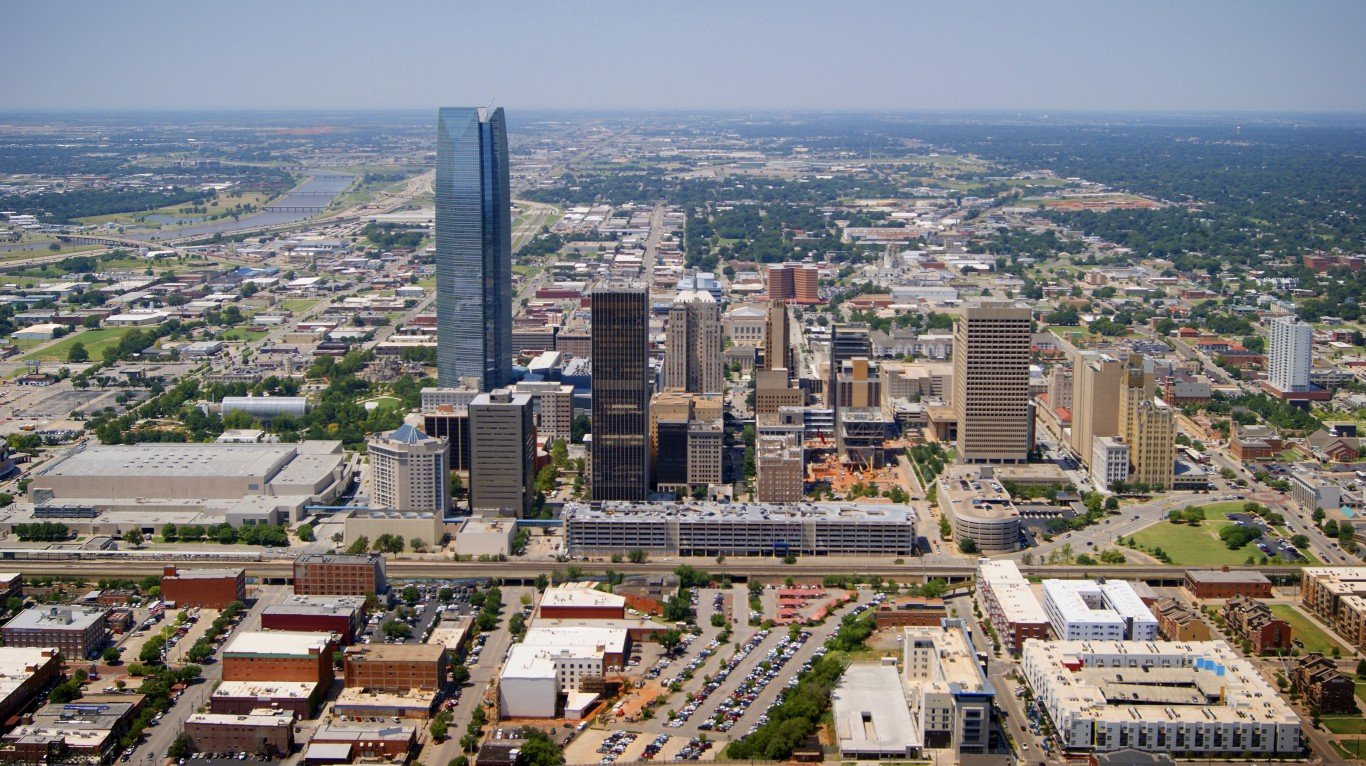
25. Oklahoma
> Firearm background checks in Mar 2021: 1,227.40 per 100,000 (48,568 total)
> Firearm background checks in Mar 2020: 1,268.50 per 100,000 (50,194 total)
> YoY change in background checks: -3.24% (18th largest decrease)
> Firearm background checks in 2020: 11,885.00 per 100,000 (470,286 total)
> Population: 3,956,971
[in-text-ad]

24. New York
> Firearm background checks in Mar 2021: 252.69 per 100,000 (49,158 total)
> Firearm background checks in Mar 2020: 307.33 per 100,000 (59,787 total)
> YoY change in background checks: -17.78% (5th largest decrease)
> Firearm background checks in 2020: 2,611.04 per 100,000 (507,940 total)
> Population: 19,453,561
[recirclink id=647909]

23. Oregon
> Firearm background checks in Mar 2021: 1,179.59 per 100,000 (49,752 total)
> Firearm background checks in Mar 2020: 1,401.58 per 100,000 (59,115 total)
> YoY change in background checks: -15.84% (7th largest decrease)
> Firearm background checks in 2020: 12,236.32 per 100,000 (516,096 total)
> Population: 4,217,737
22. South Carolina
> Firearm background checks in Mar 2021: 1,083.24 per 100,000 (55,773 total)
> Firearm background checks in Mar 2020: 989.63 per 100,000 (50,953 total)
> YoY change in background checks: +9.46% (16th largest increase)
> Firearm background checks in 2020: 10,311.90 per 100,000 (530,930 total)
> Population: 5,148,714
[in-text-ad-2]

21. Arizona
> Firearm background checks in Mar 2021: 904.07 per 100,000 (65,805 total)
> Firearm background checks in Mar 2020: 1,137.16 per 100,000 (82,771 total)
> YoY change in background checks: -20.50% (2nd largest decrease)
> Firearm background checks in 2020: 9,142.52 per 100,000 (665,458 total)
> Population: 7,278,717

20. Colorado
> Firearm background checks in Mar 2021: 1,211.32 per 100,000 (69,757 total)
> Firearm background checks in Mar 2020: 1,342.40 per 100,000 (77,305 total)
> YoY change in background checks: -9.76% (12th largest decrease)
> Firearm background checks in 2020: 11,816.95 per 100,000 (680,507 total)
> Population: 5,758,736
[in-text-ad]

19. Virginia
> Firearm background checks in Mar 2021: 848.67 per 100,000 (72,438 total)
> Firearm background checks in Mar 2020: 980.32 per 100,000 (83,675 total)
> YoY change in background checks: -13.43% (9th largest decrease)
> Firearm background checks in 2020: 9,648.07 per 100,000 (823,513 total)
> Population: 8,535,519
[recirclink id=839643]
18. Washington
> Firearm background checks in Mar 2021: 983.07 per 100,000 (74,860 total)
> Firearm background checks in Mar 2020: 991.86 per 100,000 (75,529 total)
> YoY change in background checks: -0.89% (21st largest decrease)
> Firearm background checks in 2020: 10,262.40 per 100,000 (781,471 total)
> Population: 7,614,893

17. Wisconsin
> Firearm background checks in Mar 2021: 1,320.50 per 100,000 (76,885 total)
> Firearm background checks in Mar 2020: 1,336.40 per 100,000 (77,811 total)
> YoY change in background checks: -1.19% (20th largest decrease)
> Firearm background checks in 2020: 12,565.50 per 100,000 (731,618 total)
> Population: 5,822,434
[in-text-ad-2]

16. Missouri
> Firearm background checks in Mar 2021: 1,264.65 per 100,000 (77,617 total)
> Firearm background checks in Mar 2020: 1,242.57 per 100,000 (76,262 total)
> YoY change in background checks: +1.78% (27th largest increase)
> Firearm background checks in 2020: 11,538.77 per 100,000 (708,184 total)
> Population: 6,137,428

15. North Carolina
> Firearm background checks in Mar 2021: 858.97 per 100,000 (90,090 total)
> Firearm background checks in Mar 2020: 792.11 per 100,000 (83,077 total)
> YoY change in background checks: +8.44% (19th largest increase)
> Firearm background checks in 2020: 8,488.53 per 100,000 (890,284 total)
> Population: 10,488,084
[in-text-ad]

14. Tennessee
> Firearm background checks in Mar 2021: 1,376.14 per 100,000 (93,979 total)
> Firearm background checks in Mar 2020: 1,295.30 per 100,000 (88,458 total)
> YoY change in background checks: +6.24% (21st largest increase)
> Firearm background checks in 2020: 14,419.90 per 100,000 (984,760 total)
> Population: 6,829,174
[recirclink id=800410]

13. Georgia
> Firearm background checks in Mar 2021: 898.98 per 100,000 (95,449 total)
> Firearm background checks in Mar 2020: 796.81 per 100,000 (84,601 total)
> YoY change in background checks: +12.82% (11th largest increase)
> Firearm background checks in 2020: 8,514.64 per 100,000 (904,035 total)
> Population: 10,617,423

12. Ohio
> Firearm background checks in Mar 2021: 842.44 per 100,000 (98,474 total)
> Firearm background checks in Mar 2020: 976.00 per 100,000 (114,086 total)
> YoY change in background checks: -13.68% (8th largest decrease)
> Firearm background checks in 2020: 8,356.08 per 100,000 (976,751 total)
> Population: 11,689,100
[in-text-ad-2]

11. Minnesota
> Firearm background checks in Mar 2021: 1,865.80 per 100,000 (105,224 total)
> Firearm background checks in Mar 2020: 1,713.84 per 100,000 (96,654 total)
> YoY change in background checks: +8.87% (17th largest increase)
> Firearm background checks in 2020: 16,993.86 per 100,000 (958,391 total)
> Population: 5,639,632

10. Alabama
> Firearm background checks in Mar 2021: 2,191.92 per 100,000 (107,474 total)
> Firearm background checks in Mar 2020: 1,889.63 per 100,000 (92,652 total)
> YoY change in background checks: +16.00% (9th largest increase)
> Firearm background checks in 2020: 22,138.16 per 100,000 (1,085,475 total)
> Population: 4,903,185
[in-text-ad]

9. Michigan
> Firearm background checks in Mar 2021: 1,122.13 per 100,000 (112,066 total)
> Firearm background checks in Mar 2020: 1,076.33 per 100,000 (107,492 total)
> YoY change in background checks: +4.26% (24th largest increase)
> Firearm background checks in 2020: 10,699.17 per 100,000 (1,068,511 total)
> Population: 9,986,857
[recirclink id=828031]

8. Utah
> Firearm background checks in Mar 2021: 3,511.34 per 100,000 (112,572 total)
> Firearm background checks in Mar 2020: 3,162.30 per 100,000 (101,382 total)
> YoY change in background checks: +11.04% (13th largest increase)
> Firearm background checks in 2020: 37,953.49 per 100,000 (1,216,773 total)
> Population: 3,205,958

7. California
> Firearm background checks in Mar 2021: 363.79 per 100,000 (143,742 total)
> Firearm background checks in Mar 2020: 416.32 per 100,000 (164,497 total)
> YoY change in background checks: -12.62% (10th largest decrease)
> Firearm background checks in 2020: 4,052.05 per 100,000 (1,601,054 total)
> Population: 39,512,223
[in-text-ad-2]

6. Pennsylvania
> Firearm background checks in Mar 2021: 1,205.29 per 100,000 (154,301 total)
> Firearm background checks in Mar 2020: 976.51 per 100,000 (125,013 total)
> YoY change in background checks: +23.43% (6th largest increase)
> Firearm background checks in 2020: 11,349.18 per 100,000 (1,452,921 total)
> Population: 12,801,989

5. Florida
> Firearm background checks in Mar 2021: 829.92 per 100,000 (178,247 total)
> Firearm background checks in Mar 2020: 895.04 per 100,000 (192,234 total)
> YoY change in background checks: -7.28% (14th largest decrease)
> Firearm background checks in 2020: 8,903.19 per 100,000 (1,912,204 total)
> Population: 21,477,737
[in-text-ad]

4. Indiana
> Firearm background checks in Mar 2021: 3,073.04 per 100,000 (206,884 total)
> Firearm background checks in Mar 2020: 1,916.40 per 100,000 (129,016 total)
> YoY change in background checks: +60.36% (3rd largest increase)
> Firearm background checks in 2020: 28,751.10 per 100,000 (1,935,587 total)
> Population: 6,732,219
[recirclink id=647909]

3. Texas
> Firearm background checks in Mar 2021: 767.04 per 100,000 (222,409 total)
> Firearm background checks in Mar 2020: 945.69 per 100,000 (274,211 total)
> YoY change in background checks: -18.89% (4th largest decrease)
> Firearm background checks in 2020: 8,019.35 per 100,000 (2,325,281 total)
> Population: 28,995,881

2. Kentucky
> Firearm background checks in Mar 2021: 7,397.05 per 100,000 (330,476 total)
> Firearm background checks in Mar 2020: 5,266.84 per 100,000 (235,305 total)
> YoY change in background checks: +40.45% (4th largest increase)
> Firearm background checks in 2020: 74,545.79 per 100,000 (3,330,462 total)
> Population: 4,467,673
[in-text-ad-2]

1. Illinois
> Firearm background checks in Mar 2021: 11,268.44 per 100,000 (1,427,917 total)
> Firearm background checks in Mar 2020: 5,090.89 per 100,000 (645,109 total)
> YoY change in background checks: +121.35% (2nd largest increase)
> Firearm background checks in 2020: 58,831.84 per 100,000 (7,455,065 total)
> Population: 12,671,821
Contact [email protected] for any questions or corrections.