
A lot can change in a decade. A global financial crisis gave rise to organized protest movements in 2011. The emergence of the Black Lives Matter movement in 2013 continues to raise criticisms of long-established American institutions. A politically divided election in 2016 ended in two presidential impeachments.
Multiple unusually destructive hurricanes in 2012 and 2017 permanently changed coastal communities and brought the devastating effects of climate change into greater focus. And, during the year the 2020 Census was conducted, the COVID-19 pandemic radically altered communities across the country and around the world — to name only a few of the major events since the last decennial Census in 2010. (Here are the world’s most important events every year since 1920.)
To account for population shifts within the United States, the decennial Census provides new population counts and determines how many of the 435 seats in the U.S. House of Representatives each state is entitled to. (These 44 Republicans have made a career out of serving in the House of Representatives)
24/7 Wall St. reviewed the number of apportioned representatives per state from the U.S. Census Bureau’s 2020 Census Apportionment Results and ordered states based on the largest negative changes to the largest positive changes in seats compared to 2010.
Seven states lost seats and six states gained seats, while 37 states kept the same number of seats. We have also included the percent change in each state’s 2010 and 2020 populations.
Here are the states that gained (and lost) the most congressional seats.
To identify the states that gained (and lost) the most congressional seats, 24/7 Wall St. reviewed the number of representatives each state was apportioned from the U.S. Census Bureau’s 2020 Census Apportionment Results. We also reviewed the apportionment results for every state from 2010’s results. Resident population figures for 2010 and 2020 are for April 1.
The 2020 Census apportionment population includes the resident population of the 50 states, plus a count of U.S. military personnel and federal civilian employees living outside the United States (and their dependents living with them) who can be allocated to a home state. The population of the District of Columbia is not included in the apportionment population.
Computing apportionment is done using the equal proportion method. Each of the 50 states is given one seat out of the current total of 435. The next, or 51st seat, goes to the state with the highest priority value and becomes that state’s second seat. This continues until all 435 seats have been assigned to a state.

California
> Number of representatives based on 2020 Census: 52
> Change from 2010 apportionment: -1
> Population change 2010-2020: 6.1% — 24th largest increase
> Resident population, Apr 1, 2020 39,538,223 — the largest
> Resident population, Apr 1, 2010 37,253,956 — the largest
[in-text-ad]

Illinois
> Number of representatives based on 2020 Census: 17
> Change from 2010 apportionment: -1
> Population change 2010-2020: -0.1% — 3rd largest decline
> Resident population, Apr 1, 2020 12,812,508 — 6th largest
> Resident population, Apr 1, 2010 12,830,632 — 5th largest
[recirclink id=871092]

Michigan
> Number of representatives based on 2020 Census: 13
> Change from 2010 apportionment: -1
> Population change 2010-2020: 2.0% — 2nd smallest increase
> Resident population, Apr 1, 2020 10,077,331 — 10th largest
> Resident population, Apr 1, 2010 9,883,640 — 8th largest

New York
> Number of representatives based on 2020 Census: 26
> Change from 2010 apportionment: -1
> Population change 2010-2020: 4.2% — 16th smallest increase
> Resident population, Apr 1, 2020 20,201,249 — 4th largest
> Resident population, Apr 1, 2010 19,378,102 — 3rd largest
[in-text-ad-2]

Ohio
> Number of representatives based on 2020 Census: 15
> Change from 2010 apportionment: -1
> Population change 2010-2020: 2.3% — 3rd smallest increase
> Resident population, Apr 1, 2020 11,799,448 — 7th largest
> Resident population, Apr 1, 2010 11,536,504 — 7th largest

Pennsylvania
> Number of representatives based on 2020 Census: 17
> Change from 2010 apportionment: -1
> Population change 2010-2020: 2.4% — 5th smallest increase
> Resident population, Apr 1, 2020 13,002,700 — 5th largest
> Resident population, Apr 1, 2010 12,702,379 — 6th largest
[in-text-ad]

West Virginia
> Number of representatives based on 2020 Census: 2
> Change from 2010 apportionment: -1
> Population change 2010-2020: -3.2% — the largest decline
> Resident population, Apr 1, 2020 1,793,716 — 12th smallest
> Resident population, Apr 1, 2010 1,852,994 — 14th smallest
[recirclink id=865601]

Alabama
> Number of representatives based on 2020 Census: 7
> Change from 2010 apportionment: 0
> Population change 2010-2020: 5.1% — 21st smallest increase
> Resident population, Apr 1, 2020 5,024,279 — 24th largest
> Resident population, Apr 1, 2010 4,779,736 — 23rd largest
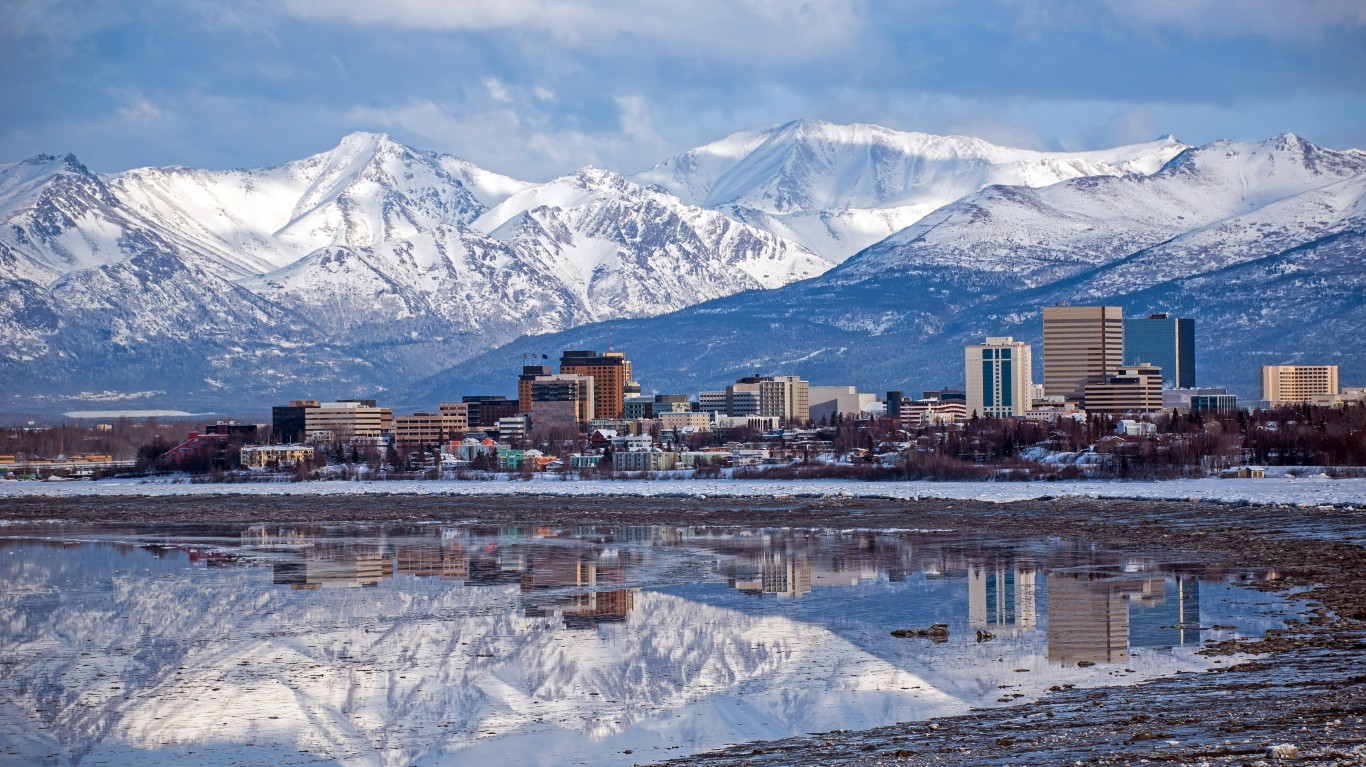
Alaska
> Number of representatives based on 2020 Census: 1
> Change from 2010 apportionment: 0
> Population change 2010-2020: 3.3% — 12th smallest increase
> Resident population, Apr 1, 2020 733,391 — 3rd smallest
> Resident population, Apr 1, 2010 710,231 — 4th smallest
[in-text-ad-2]

Arizona
> Number of representatives based on 2020 Census: 9
> Change from 2010 apportionment: 0
> Population change 2010-2020: 11.9% — 9th largest increase
> Resident population, Apr 1, 2020 7,151,502 — 14th largest
> Resident population, Apr 1, 2010 6,392,017 — 16th largest

Arkansas
> Number of representatives based on 2020 Census: 4
> Change from 2010 apportionment: 0
> Population change 2010-2020: 3.3% — 13th smallest increase
> Resident population, Apr 1, 2020 3,011,524 — 18th smallest
> Resident population, Apr 1, 2010 2,915,918 — 19th smallest
[in-text-ad]

Connecticut
> Number of representatives based on 2020 Census: 5
> Change from 2010 apportionment: 0
> Population change 2010-2020: 0.9% — the smallest increase
> Resident population, Apr 1, 2020 3,605,944 — 22nd smallest
> Resident population, Apr 1, 2010 3,574,097 — 22nd smallest
[recirclink id=866836]

Delaware
> Number of representatives based on 2020 Census: 1
> Change from 2010 apportionment: 0
> Population change 2010-2020: 10.2% — 13th largest increase
> Resident population, Apr 1, 2020 989,948 — 6th smallest
> Resident population, Apr 1, 2010 897,934 — 6th smallest

Georgia
> Number of representatives based on 2020 Census: 14
> Change from 2010 apportionment: 0
> Population change 2010-2020: 10.6% — 12th largest increase
> Resident population, Apr 1, 2020 10,711,908 — 8th largest
> Resident population, Apr 1, 2010 9,687,653 — 9th largest
[in-text-ad-2]

Hawaii
> Number of representatives based on 2020 Census: 2
> Change from 2010 apportionment: 0
> Population change 2010-2020: 7.0% — 23rd largest increase
> Resident population, Apr 1, 2020 1,455,271 — 11th smallest
> Resident population, Apr 1, 2010 1,360,301 — 11th smallest

Idaho
> Number of representatives based on 2020 Census: 2
> Change from 2010 apportionment: 0
> Population change 2010-2020: 17.3% — 2nd largest increase
> Resident population, Apr 1, 2020 1,839,106 — 13th smallest
> Resident population, Apr 1, 2010 1,567,582 — 12th smallest
[in-text-ad]

Indiana
> Number of representatives based on 2020 Census: 9
> Change from 2010 apportionment: 0
> Population change 2010-2020: 4.7% — 19th smallest increase
> Resident population, Apr 1, 2020 6,785,528 — 17th largest
> Resident population, Apr 1, 2010 6,483,802 — 15th largest
[recirclink id=868666]

Iowa
> Number of representatives based on 2020 Census: 4
> Change from 2010 apportionment: 0
> Population change 2010-2020: 4.7% — 20th smallest increase
> Resident population, Apr 1, 2020 3,190,369 — 20th smallest
> Resident population, Apr 1, 2010 3,046,355 — 21st smallest

Kansas
> Number of representatives based on 2020 Census: 4
> Change from 2010 apportionment: 0
> Population change 2010-2020: 3.0% — 11th smallest increase
> Resident population, Apr 1, 2020 2,937,880 — 16th smallest
> Resident population, Apr 1, 2010 2,853,118 — 18th smallest
[in-text-ad-2]

Kentucky
> Number of representatives based on 2020 Census: 6
> Change from 2010 apportionment: 0
> Population change 2010-2020: 3.8% — 15th smallest increase
> Resident population, Apr 1, 2020 4,505,836 — 25th smallest
> Resident population, Apr 1, 2010 4,339,367 — 25th smallest

Louisiana
> Number of representatives based on 2020 Census: 6
> Change from 2010 apportionment: 0
> Population change 2010-2020: 2.7% — 7th smallest increase
> Resident population, Apr 1, 2020 4,657,757 — 25th largest
> Resident population, Apr 1, 2010 4,533,372 — 25th largest
[in-text-ad]

Maine
> Number of representatives based on 2020 Census: 2
> Change from 2010 apportionment: 0
> Population change 2010-2020: 2.6% — 6th smallest increase
> Resident population, Apr 1, 2020 1,362,359 — 9th smallest
> Resident population, Apr 1, 2010 1,328,361 — 10th smallest
[recirclink id=871092]

Maryland
> Number of representatives based on 2020 Census: 8
> Change from 2010 apportionment: 0
> Population change 2010-2020: 7.0% — 22nd largest increase
> Resident population, Apr 1, 2020 6,177,224 — 18th largest
> Resident population, Apr 1, 2010 5,773,552 — 19th largest

Massachusetts
> Number of representatives based on 2020 Census: 9
> Change from 2010 apportionment: 0
> Population change 2010-2020: 7.4% — 21st largest increase
> Resident population, Apr 1, 2020 7,029,917 — 15th largest
> Resident population, Apr 1, 2010 6,547,629 — 14th largest
[in-text-ad-2]

Minnesota
> Number of representatives based on 2020 Census: 8
> Change from 2010 apportionment: 0
> Population change 2010-2020: 7.6% — 19th largest increase
> Resident population, Apr 1, 2020 5,706,494 — 22nd largest
> Resident population, Apr 1, 2010 5,303,925 — 21st largest

Mississippi
> Number of representatives based on 2020 Census: 4
> Change from 2010 apportionment: 0
> Population change 2010-2020: -0.2% — 2nd largest decline
> Resident population, Apr 1, 2020 2,961,279 — 17th smallest
> Resident population, Apr 1, 2010 2,967,297 — 20th smallest
[in-text-ad]

Missouri
> Number of representatives based on 2020 Census: 8
> Change from 2010 apportionment: 0
> Population change 2010-2020: 2.8% — 9th smallest increase
> Resident population, Apr 1, 2020 6,154,913 — 19th largest
> Resident population, Apr 1, 2010 5,988,927 — 18th largest
[recirclink id=865601]

Nebraska
> Number of representatives based on 2020 Census: 3
> Change from 2010 apportionment: 0
> Population change 2010-2020: 7.4% — 20th largest increase
> Resident population, Apr 1, 2020 1,961,504 — 14th smallest
> Resident population, Apr 1, 2010 1,826,341 — 13th smallest

Nevada
> Number of representatives based on 2020 Census: 4
> Change from 2010 apportionment: 0
> Population change 2010-2020: 15.0% — 5th largest increase
> Resident population, Apr 1, 2020 3,104,614 — 19th smallest
> Resident population, Apr 1, 2010 2,700,551 — 16th smallest
[in-text-ad-2]

New Hampshire
> Number of representatives based on 2020 Census: 2
> Change from 2010 apportionment: 0
> Population change 2010-2020: 4.6% — 18th smallest increase
> Resident population, Apr 1, 2020 1,377,529 — 10th smallest
> Resident population, Apr 1, 2010 1,316,470 — 9th smallest

New Jersey
> Number of representatives based on 2020 Census: 12
> Change from 2010 apportionment: 0
> Population change 2010-2020: 5.7% — 23rd smallest increase
> Resident population, Apr 1, 2020 9,288,994 — 11th largest
> Resident population, Apr 1, 2010 8,791,894 — 11th largest
[in-text-ad]

New Mexico
> Number of representatives based on 2020 Census: 3
> Change from 2010 apportionment: 0
> Population change 2010-2020: 2.8% — 10th smallest increase
> Resident population, Apr 1, 2020 2,117,522 — 15th smallest
> Resident population, Apr 1, 2010 2,059,179 — 15th smallest
[recirclink id=866836]

North Dakota
> Number of representatives based on 2020 Census: 1
> Change from 2010 apportionment: 0
> Population change 2010-2020: 15.8% — 4th largest increase
> Resident population, Apr 1, 2020 779,094 — 4th smallest
> Resident population, Apr 1, 2010 672,591 — 3rd smallest

Oklahoma
> Number of representatives based on 2020 Census: 5
> Change from 2010 apportionment: 0
> Population change 2010-2020: 5.5% — 22nd smallest increase
> Resident population, Apr 1, 2020 3,959,353 — 23rd smallest
> Resident population, Apr 1, 2010 3,751,351 — 23rd smallest
[in-text-ad-2]

Rhode Island
> Number of representatives based on 2020 Census: 2
> Change from 2010 apportionment: 0
> Population change 2010-2020: 4.3% — 17th smallest increase
> Resident population, Apr 1, 2020 1,097,379 — 8th smallest
> Resident population, Apr 1, 2010 1,052,567 — 8th smallest

South Carolina
> Number of representatives based on 2020 Census: 7
> Change from 2010 apportionment: 0
> Population change 2010-2020: 10.7% — 10th largest increase
> Resident population, Apr 1, 2020 5,118,425 — 23rd largest
> Resident population, Apr 1, 2010 4,625,364 — 24th largest
[in-text-ad]

South Dakota
> Number of representatives based on 2020 Census: 1
> Change from 2010 apportionment: 0
> Population change 2010-2020: 8.9% — 16th largest increase
> Resident population, Apr 1, 2020 886,667 — 5th smallest
> Resident population, Apr 1, 2010 814,180 — 5th smallest
[recirclink id=868666]

Tennessee
> Number of representatives based on 2020 Census: 9
> Change from 2010 apportionment: 0
> Population change 2010-2020: 8.9% — 17th largest increase
> Resident population, Apr 1, 2020 6,910,840 — 16th largest
> Resident population, Apr 1, 2010 6,346,105 — 17th largest

Utah
> Number of representatives based on 2020 Census: 4
> Change from 2010 apportionment: 0
> Population change 2010-2020: 18.4% — the largest increase
> Resident population, Apr 1, 2020 3,271,616 — 21st smallest
> Resident population, Apr 1, 2010 2,763,885 — 17th smallest
[in-text-ad-2]

Vermont
> Number of representatives based on 2020 Census: 1
> Change from 2010 apportionment: 0
> Population change 2010-2020: 2.8% — 8th smallest increase
> Resident population, Apr 1, 2020 643,077 — 2nd smallest
> Resident population, Apr 1, 2010 625,741 — 2nd smallest

Virginia
> Number of representatives based on 2020 Census: 11
> Change from 2010 apportionment: 0
> Population change 2010-2020: 7.9% — 18th largest increase
> Resident population, Apr 1, 2020 8,631,393 — 12th largest
> Resident population, Apr 1, 2010 8,001,024 — 12th largest
[in-text-ad]
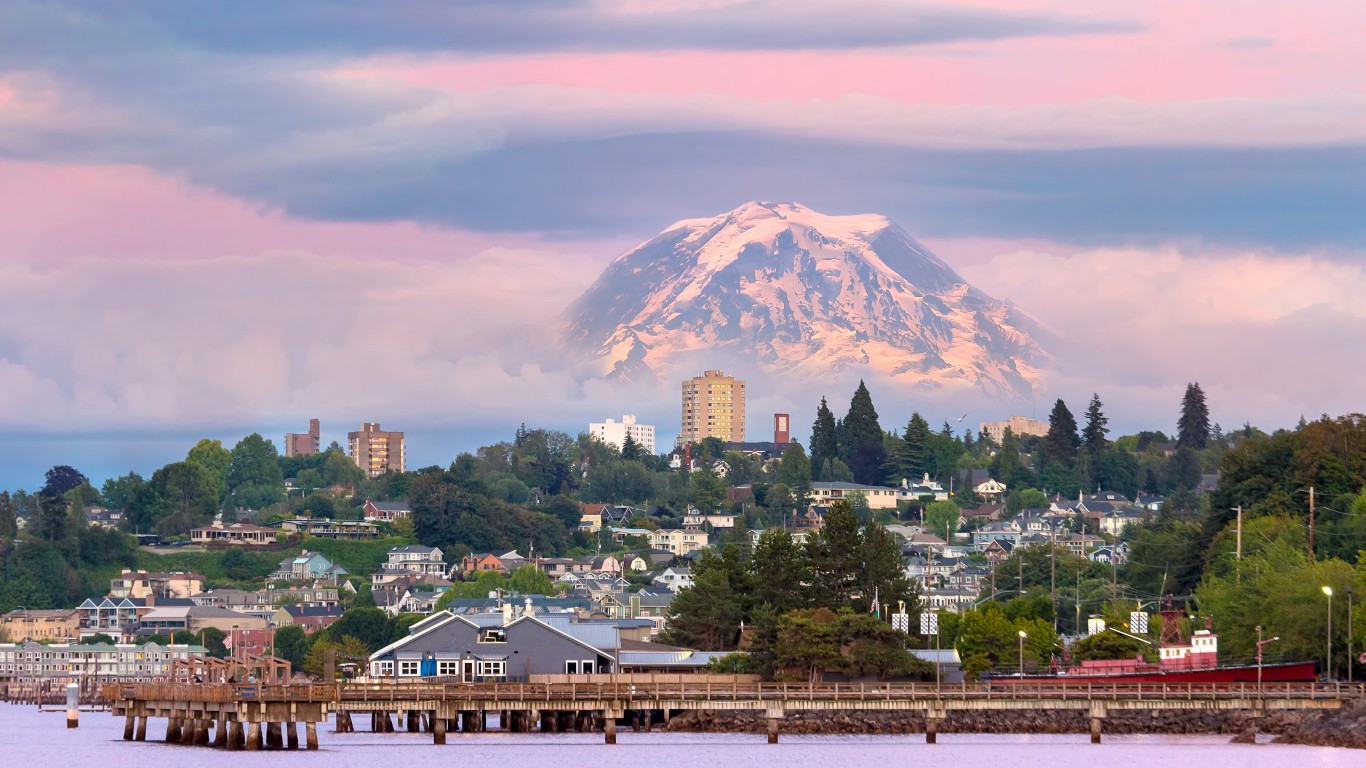
Washington
> Number of representatives based on 2020 Census: 10
> Change from 2010 apportionment: 0
> Population change 2010-2020: 14.6% — 7th largest increase
> Resident population, Apr 1, 2020 7,705,281 — 13th largest
> Resident population, Apr 1, 2010 6,724,540 — 13th largest
[recirclink id=871092]

Wisconsin
> Number of representatives based on 2020 Census: 8
> Change from 2010 apportionment: 0
> Population change 2010-2020: 3.6% — 14th smallest increase
> Resident population, Apr 1, 2020 5,893,718 — 20th largest
> Resident population, Apr 1, 2010 5,686,986 — 20th largest

Wyoming
> Number of representatives based on 2020 Census: 1
> Change from 2010 apportionment: 0
> Population change 2010-2020: 2.3% — 4th smallest increase
> Resident population, Apr 1, 2020 576,851 — the smallest
> Resident population, Apr 1, 2010 563,626 — the smallest
[in-text-ad-2]

Colorado
> Number of representatives based on 2020 Census: 8
> Change from 2010 apportionment: 1
> Population change 2010-2020: 14.8% — 6th largest increase
> Resident population, Apr 1, 2020 5,773,714 — 21st largest
> Resident population, Apr 1, 2010 5,029,196 — 22nd largest

Florida
> Number of representatives based on 2020 Census: 28
> Change from 2010 apportionment: 1
> Population change 2010-2020: 14.6% — 8th largest increase
> Resident population, Apr 1, 2020 21,538,187 — 3rd largest
> Resident population, Apr 1, 2010 18,801,310 — 4th largest
[in-text-ad]

Montana
> Number of representatives based on 2020 Census: 2
> Change from 2010 apportionment: 1
> Population change 2010-2020: 9.6% — 14th largest increase
> Resident population, Apr 1, 2020 1,084,225 — 7th smallest
> Resident population, Apr 1, 2010 989,415 — 7th smallest
[recirclink id=865601]

North Carolina
> Number of representatives based on 2020 Census: 14
> Change from 2010 apportionment: 1
> Population change 2010-2020: 9.5% — 15th largest increase
> Resident population, Apr 1, 2020 10,439,388 — 9th largest
> Resident population, Apr 1, 2010 9,535,483 — 10th largest

Oregon
> Number of representatives based on 2020 Census: 6
> Change from 2010 apportionment: 1
> Population change 2010-2020: 10.6% — 11th largest increase
> Resident population, Apr 1, 2020 4,237,256 — 24th smallest
> Resident population, Apr 1, 2010 3,831,074 — 24th smallest
[in-text-ad-2]

Texas
> Number of representatives based on 2020 Census: 38
> Change from 2010 apportionment: 2
> Population change 2010-2020: 15.9% — 3rd largest increase
> Resident population, Apr 1, 2020 29,145,505 — 2nd largest
> Resident population, Apr 1, 2010 25,145,561 — 2nd largest
Contact [email protected] for any questions or corrections.