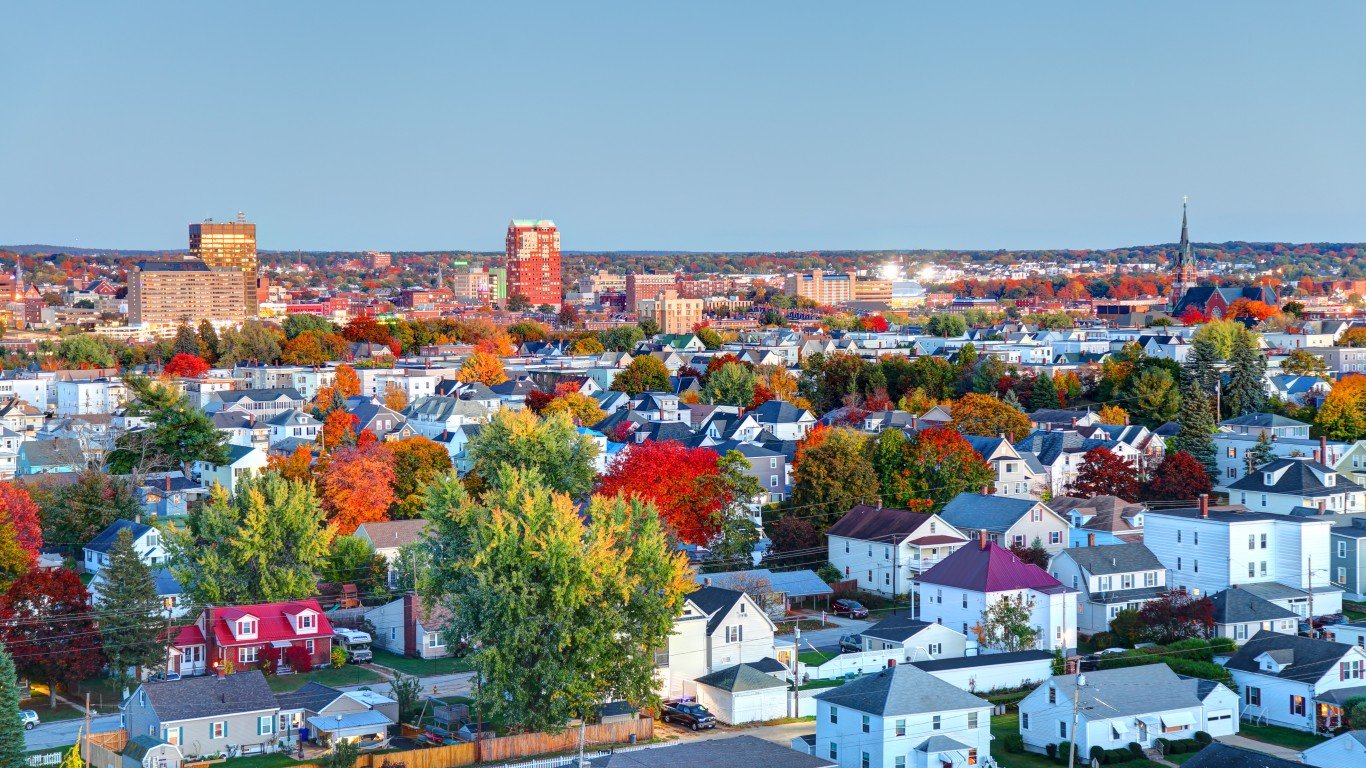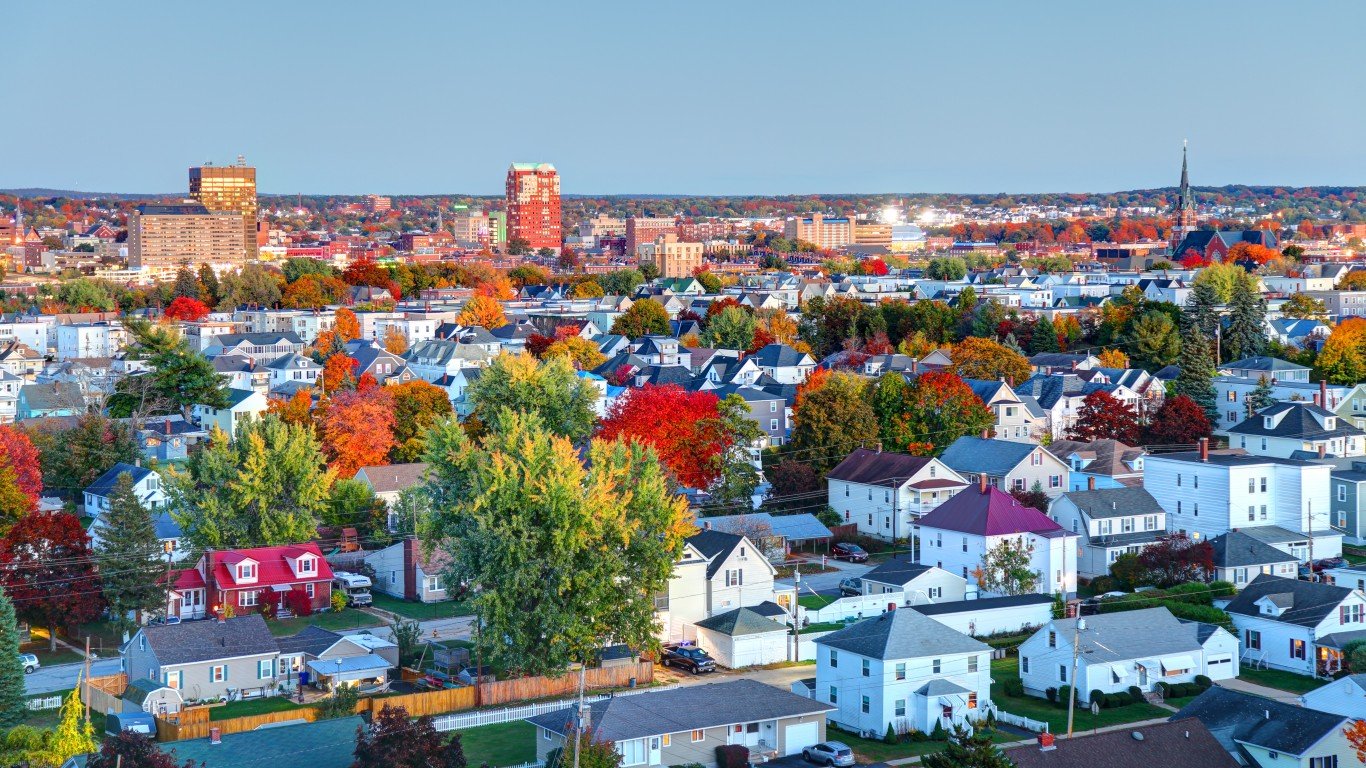
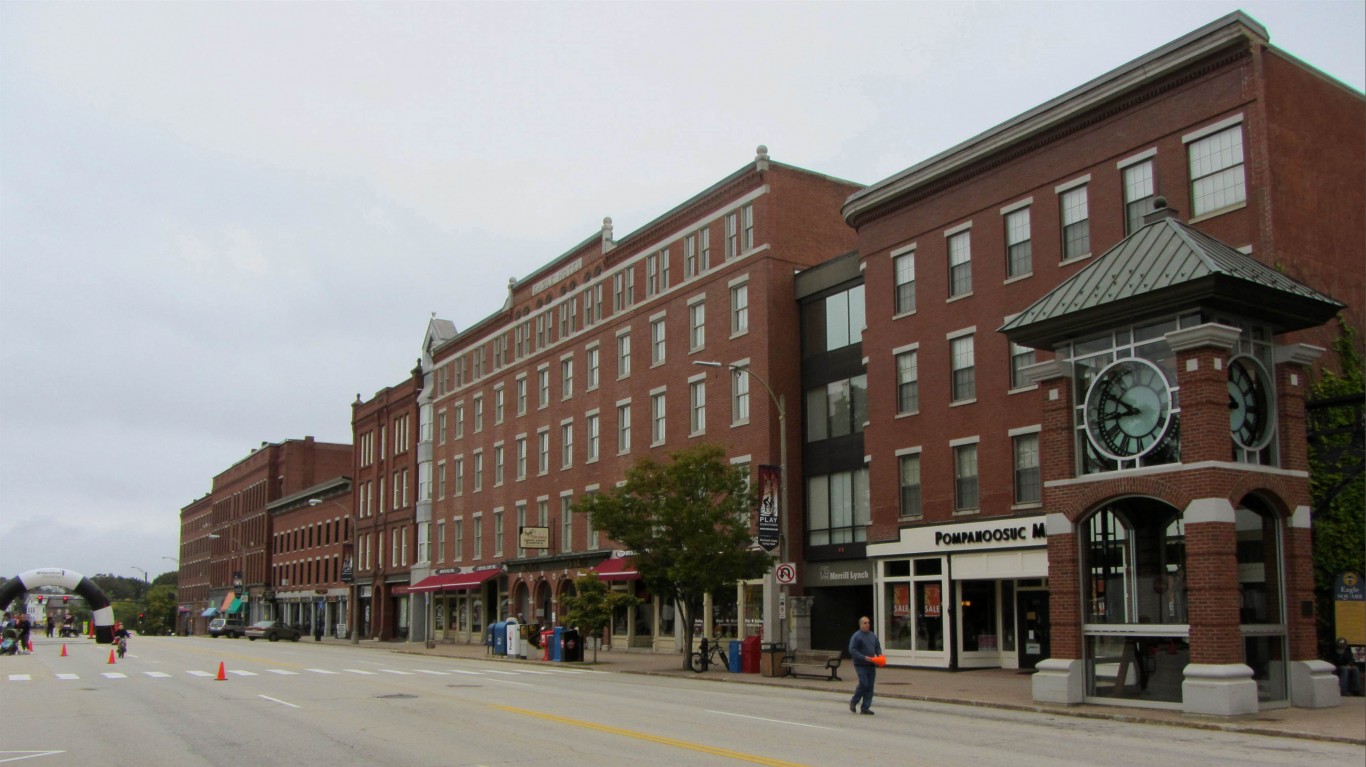
Home sales across much of the United States are on fire. Prices have recently risen at rates that top even the wild market of 2005 and 2006, just before the balloon burst and helped trigger the Great Recession. Currently, the hottest real estate market in the U.S. is Manchester, New Hampshire.
Some of the recent demand in hot markets has been driven by people who have moved out of big cities because of the COVID-19 pandemic. Some people expect to work from home permanently and would like to live in cities and towns with lifestyle advantages. Mortgage rates remain near multi-decade lows, and the incomes of many middle-class and upper-class Americans were not dented by last year’s economic downturn.
Realtor.com looked at home sales across cities for the month of April. The website’s economists picked the hottest markets. The proprietary ranking is based on how quickly homes sell and which metro’s listings have the most viewings on the website.
Realtor.com Chief Economist Danielle Hale pointed out that five of the top 10 markets are in the Midwest. This is, in part, because the selling season tends to be in the spring and summer in these markets and demand peaks during those months. However, the top two markets in April this year — Concord and Manchester — are both in New Hampshire.
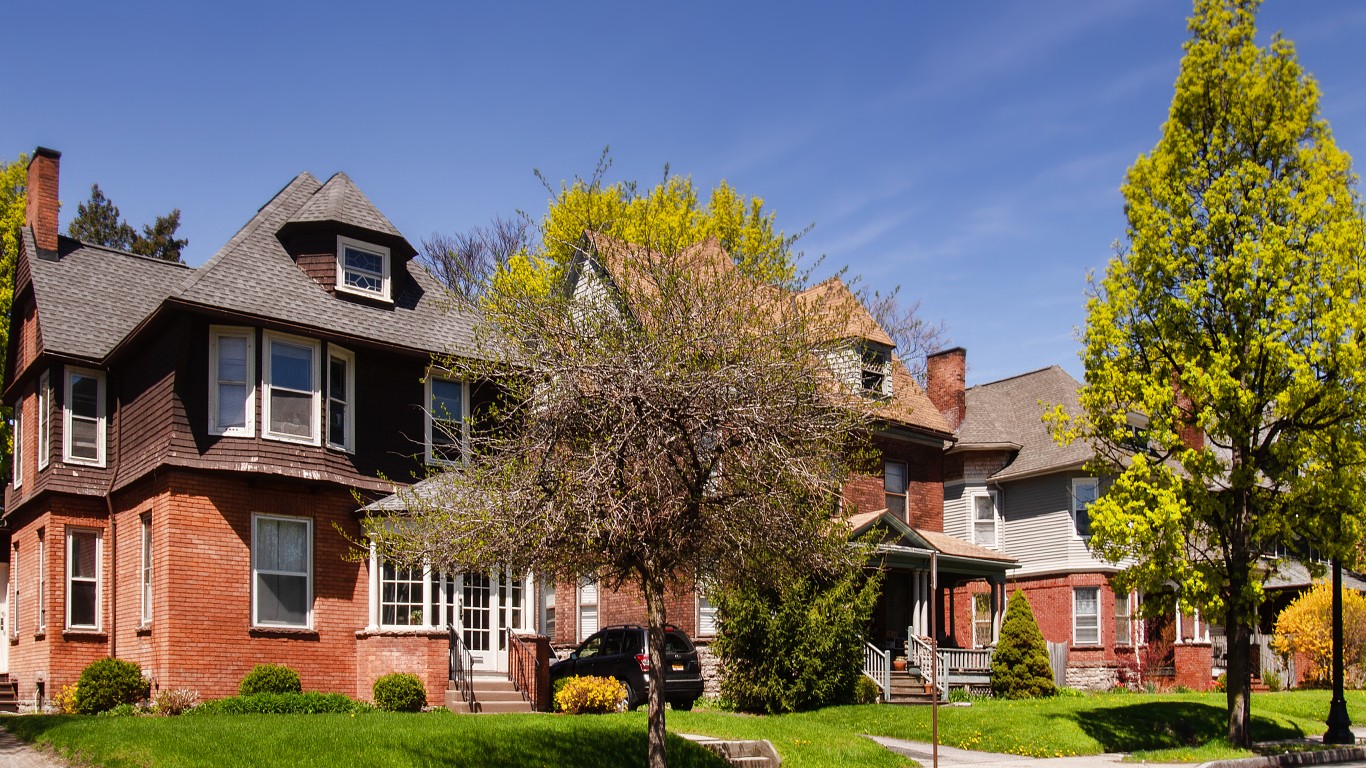
Some of these markets are not affluent. Rochester, New York, one of the old industrial cities that have posted a drop in population for years, ranks 10th. Yuba City, California, near Stockton, ranks 13th on the list. It has a low median household income compared to the national figure, as well as a poverty rate much higher than the U.S. rate.
These are the 20 hottest housing markets in America and their median listing prices.
To determine the hottest real estate markets in America, 24/7 Wall St. reviewed data from real estate information site Realtor.com, a subsidiary of News Corp. Real estate markets were ranked based on “how quickly homes sell and which metros’ listings are viewed the most,” as of April 2021, according to Realtor.com. Supplemental place-level data on population and median household income came from the U.S. Census Bureau’s 2019 American Community Survey and are five-year estimates.

20. Santa Cruz, CA
> 1-yr. rank change: +6 places
> Median listing price: $1,190,000
> Median household income: $77,921
> 5-yr. population change: +4.0%
[in-text-ad]

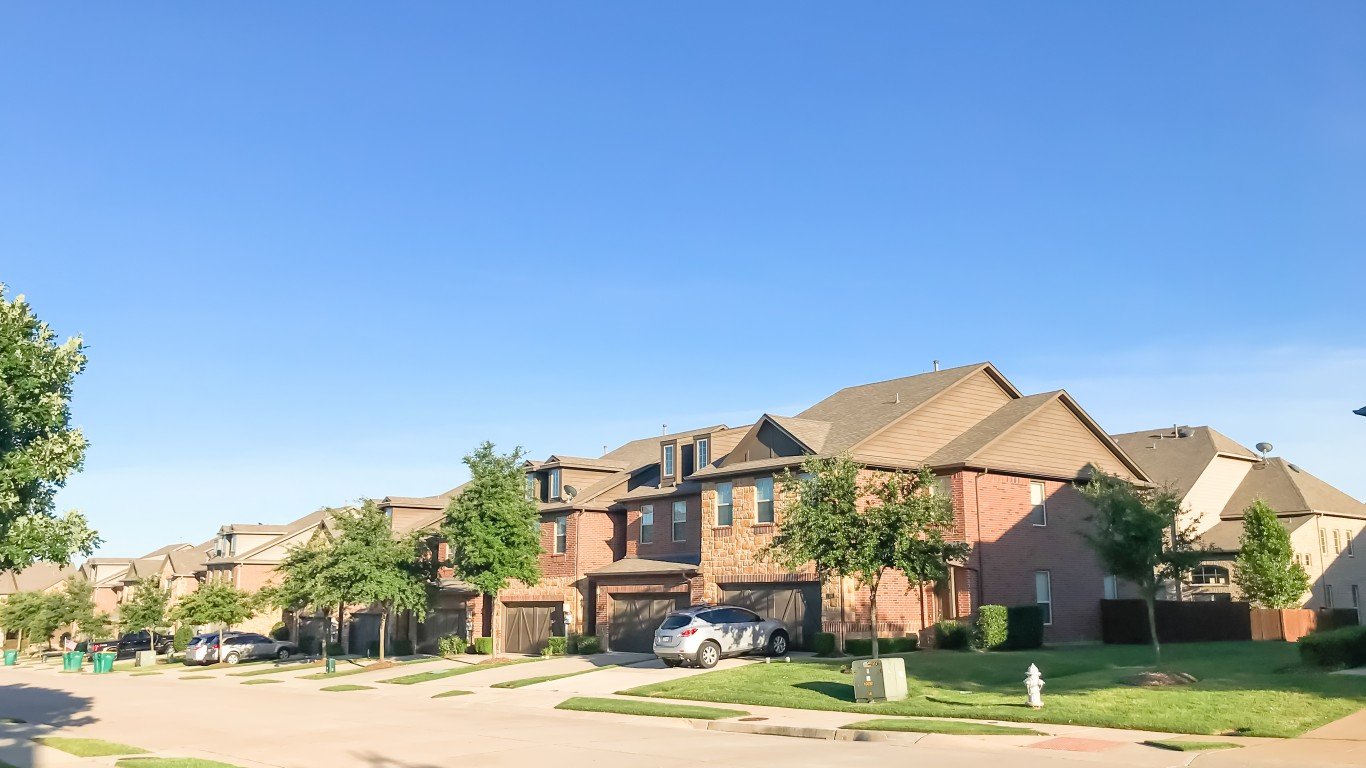
19. Stockton, CA
> 1-yr. rank change: -2 places
> Median listing price: $499,000
> Median household income: $54,614
> 5-yr. population change: +4.0%
[recirclink id=846277]

18. Colorado Springs, CO
> 1-yr. rank change: -17 places
> Median listing price: $494,000
> Median household income: $64,712
> 5-yr. population change: +7.2%
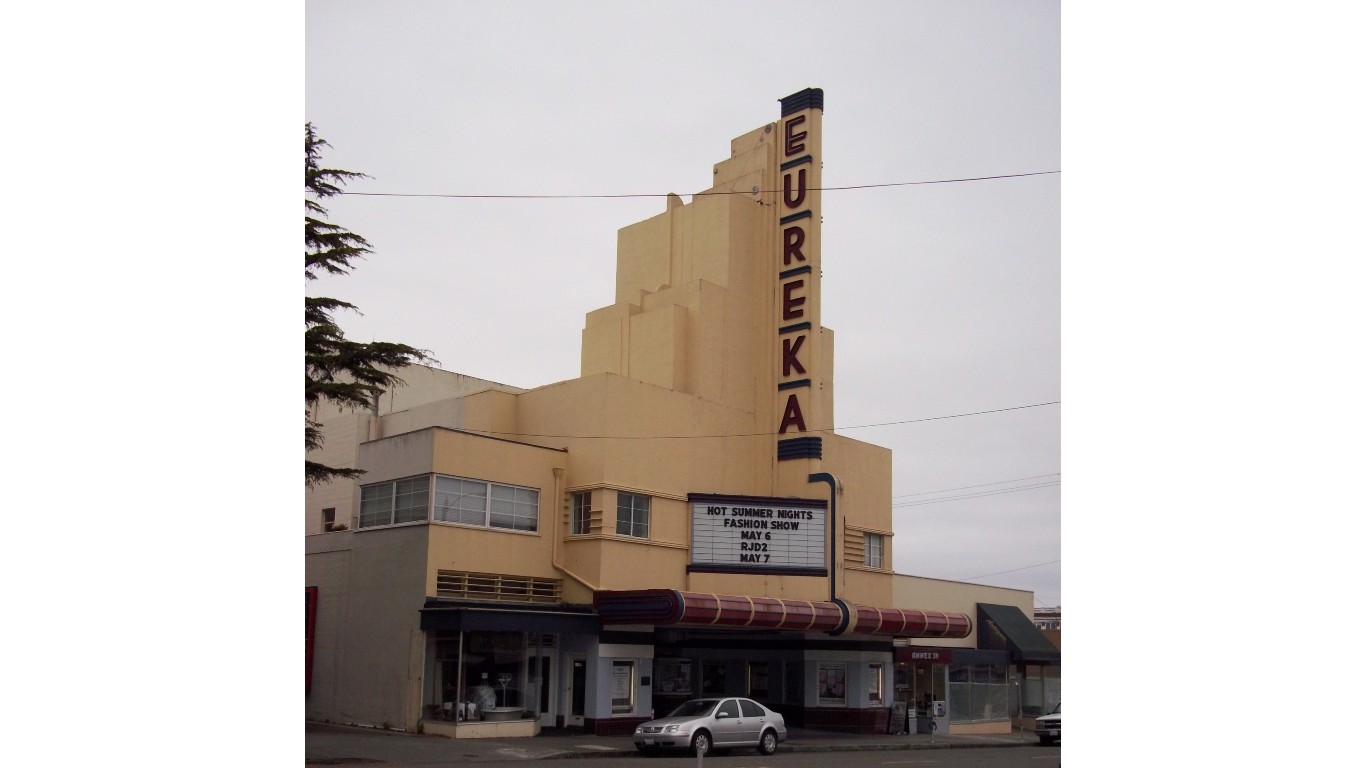
17. Eureka, CA
> 1-yr. rank change: +97 places
> Median listing price: $469,000
> Median household income: $42,890
> 5-yr. population change: -0.3%
[in-text-ad-2]

16. Madison, WI
> 1-yr. rank change: +17 places
> Median listing price: $392,000
> Median household income: $65,332
> 5-yr. population change: +6.3%

15. Springfield, MA
> 1-yr. rank change: +40 places
> Median listing price: $372,000
> Median household income: $39,432
> 5-yr. population change: +0.2%
[in-text-ad]

14. Jefferson City, MO
> 1-yr. rank change: +83 places
> Median listing price: $213,000
> Median household income: $52,253
> 5-yr. population change: -0.6%
[recirclink id=850163]

13. Yuba City, CA
> 1-yr. rank change: -1 place
> Median listing price: $400,000
> Median household income: $56,816
> 5-yr. population change: +2.1%

12. Worcester, MA
> 1-yr. rank change: +7 places
> Median listing price: $390,000
> Median household income: $48,139
> 5-yr. population change: +1.4%
[in-text-ad-2]

11. Springfield, OH
> 1-yr. rank change: +17 places
> Median listing price: $180,000
> Median household income: $39,332
> 5-yr. population change: -1.8%

10. Rochester, NY
> 1-yr. rank change: +16 places
> Median listing price: $264,000
> Median household income: $35,590
> 5-yr. population change: -1.7%
[in-text-ad]
9. Vallejo, CA
> 1-yr. rank change: -3 places
> Median listing price: $545,000
> Median household income: $69,405
> 5-yr. population change: +2.7%
[recirclink id=863766]

8. Portland, ME
> 1-yr. rank change: +58 places
> Median listing price: $462,000
> Median household income: $60,467
> 5-yr. population change: +0.4%

7. Topeka, KS
> 1-yr. rank change: Unchanged
> Median listing price: $157,000
> Median household income: $47,999
> 5-yr. population change: -1.0%
[in-text-ad-2]

6. Columbus, OH
> 1-yr. rank change: -1 place
> Median listing price: $315,000
> Median household income: $53,745
> 5-yr. population change: +8.2%

5. Elkhart, IN
> 1-yr. rank change: +35 places
> Median listing price: $150,000
> Median household income: $40,750
> 5-yr. population change: +1.4%
[in-text-ad]

4. Janesville, WI
> 1-yr. rank change: +19 places
> Median listing price: $258,000
> Median household income: $56,293
> 5-yr. population change: +0.9%
[recirclink id=875431]

3. Lafayette, IN
> 1-yr. rank change: +1 place
> Median listing price: $303,000
> Median household income: $46,374
> 5-yr. population change: +3.7%
2. Concord, NH
> 1-yr. rank change: +22 places
> Median listing price: $379,000
> Median household income: $66,719
> 5-yr. population change: +1.7%
[in-text-ad-2]

1. Manchester, NH
> 1-yr. rank change: +2 places
> Median listing price: $400,000
> Median household income: $60,711
> 5-yr. population change: +1.9%
Contact [email protected] for any questions or corrections.