Income inequality exploded as a hot button topic during the presidential campaign with both sides of the political spectrum fighting over how to fix the problem. Although it’s hard to agree on solutions, one fact most concede is that the gap between the rich and the poor in this country has dramatically widened in the recent decade.
According to the Census Bureau, the top 20% of the population earned nearly 52% of all income in the U.S. Those households had an average income of $254,449 in 2019. On the opposite track were the bottom 20% of households that earned 3.1% of U.S. income and annual earnings of $15,286.
The gap between income distribution among rich and poor has been steadily growing since the 1970s. Pew Research estimates between 1970 and 2000, median household income rose by 41 percent to $70,800, driven by an annual average growth rate of 1.2%. However, from 2000 to 2018, two recessions stymied that growth rate to a mere 0.2%. If not for those financial setbacks, the nation’s median income would have followed the same trajectory as 1970 to 2000 and reached $87,000 instead of the current $74,600.
Moreover, Pew also notes the percentage of middle-income households plunged from 61% in 1971 to 51% in 2019. Pew defines middle-income households as those bringing in a median income of $58,100 in 1970; $81,700 in 2000, $86,600 in 2018.
Those figures are national. Brushing a broad national stoke on income inequality fails to give a clear picture of how income disparity is a relative term in many ways. Household income — and more importantly, what it can buy — depends on your home state and its cost of living. What’s considered “rich” in a less affluent state might only buy you into the middle class in a high cost of living state like New York. Conversely, high earners in a state with a more affordable cost of living probably get more for their dollars.
In this list, New York State’s ratio of high income to low income earners factored out to 21.83 to 1, pushing it to the top. Median household income for the highest 20% bracket in the Empire State stood at $291,906, fifth highest in the nation. And that figure is growing as New York was one of 16 states where incomes are rising fastest.
If you live in Louisiana, a median income $100,000 less than that — $190,038 — kicks you to the top 20%. On the other hand, the poorest 20% earn $9,426, putting the state’s ratio of 20.16 to 1 at number two. That disparity in incomes is likely a reflection of why Louisiana is the worst state for business.
Click here to see the 25 states with the widest gaps between rich and poor.
To determine the states with the widest gaps between rich and poor, 24/7 Wall St. reviewed for each state the ratio of the richest 20% median income to the poorest 20% median income, using data from the U.S. Census Bureau’s American Community Survey.
Because ACS income data reflects pre-tax levels, the figures may overstate the degree of income inequality in the poorer quintiles.

25. Maryland
> Typical high income to typical low income: 14.82 to 1
> Median household income, highest 20%: $280,115 — 6th highest
> Median household income, lowest 20%: $18,902 — 3rd highest
> Richest 20% of residents’ share of income: 49.1% (2019) — 18th lowest
> Poorest 20% of residents’ share of income: 3.3% (2019) — 20th lowest
[in-text-ad]

24. Arkansas
> Typical high income to typical low income: 15.05 to 1
> Median household income, highest 20%: $173,941 — 3rd lowest
> Median household income, lowest 20%: $11,555 — 7th lowest
> Richest 20% of residents’ share of income: 51.0% (2019) — 13th highest
> Poorest 20% of residents’ share of income: 3.4% (2019) — 25th lowest
[recirclink id=715247]

23. Tennessee
> Typical high income to typical low income: 15.17 to 1
> Median household income, highest 20%: $199,456 — 21st lowest
> Median household income, lowest 20%: $13,144 — 10th lowest
> Richest 20% of residents’ share of income: 51.1% (2019) — 10th highest
> Poorest 20% of residents’ share of income: 3.4% (2019) — 24th lowest

22. Nevada
> Typical high income to typical low income: 15.27 to 1
> Median household income, highest 20%: $220,208 — 21st highest
> Median household income, lowest 20%: $14,425 — 21st lowest
> Richest 20% of residents’ share of income: 50.6% (2019) — 20th highest
> Poorest 20% of residents’ share of income: 3.3% (2019) — 21st lowest
[in-text-ad-2]

21. West Virginia
> Typical high income to typical low income: 15.33 to 1
> Median household income, highest 20%: $163,240 — the lowest
> Median household income, lowest 20%: $10,649 — 3rd lowest
> Richest 20% of residents’ share of income: 49.6% (2019) — 23rd lowest
> Poorest 20% of residents’ share of income: 3.2% (2019) — 15th lowest

20. North Carolina
> Typical high income to typical low income: 15.35 to 1
> Median household income, highest 20%: $204,129 — 25th lowest
> Median household income, lowest 20%: $13,301 — 12th lowest
> Richest 20% of residents’ share of income: 51.0% (2019) — 12th highest
> Poorest 20% of residents’ share of income: 3.3% (2019) — 22nd lowest
[in-text-ad]

19. Oklahoma
> Typical high income to typical low income: 15.36 to 1
> Median household income, highest 20%: $192,061 — 12th lowest
> Median household income, lowest 20%: $12,507 — 9th lowest
> Richest 20% of residents’ share of income: 50.9% (2019) — 17th highest
> Poorest 20% of residents’ share of income: 3.3% (2019) — 20th lowest
[recirclink id=848904]

18. Rhode Island
> Typical high income to typical low income: 15.44 to 1
> Median household income, highest 20%: $228,951 — 15th highest
> Median household income, lowest 20%: $14,829 — 25th highest
> Richest 20% of residents’ share of income: 49.5% (2019) — 20th lowest
> Poorest 20% of residents’ share of income: 3.2% (2019) — 14th lowest

17. Virginia
> Typical high income to typical low income: 15.47 to 1
> Median household income, highest 20%: $265,171 — 7th highest
> Median household income, lowest 20%: $17,138 — 10th highest
> Richest 20% of residents’ share of income: 50.5% (2019) — 22nd highest
> Poorest 20% of residents’ share of income: 3.3% (2019) — 18th lowest
[in-text-ad-2]

16. Florida
> Typical high income to typical low income: 15.50 to 1
> Median household income, highest 20%: $217,456 — 22nd highest
> Median household income, lowest 20%: $14,026 — 19th lowest
> Richest 20% of residents’ share of income: 51.9% (2019) — 6th highest
> Poorest 20% of residents’ share of income: 3.4% (2019) — 23rd lowest

15. Pennsylvania
> Typical high income to typical low income: 15.63 to 1
> Median household income, highest 20%: $223,499 — 19th highest
> Median household income, lowest 20%: $14,295 — 20th lowest
> Richest 20% of residents’ share of income: 50.9% (2019) — 15th highest
> Poorest 20% of residents’ share of income: 3.3% (2019) — 18th lowest
[in-text-ad]

14. Texas
> Typical high income to typical low income: 15.73 to 1
> Median household income, highest 20%: $228,924 — 16th highest
> Median household income, lowest 20%: $14,556 — 22nd lowest
> Richest 20% of residents’ share of income: 51.0% (2019) — 11th highest
> Poorest 20% of residents’ share of income: 3.3% (2019) — 16th lowest
[recirclink id=877651]

13. South Carolina
> Typical high income to typical low income: 16.13 to 1
> Median household income, highest 20%: $198,951 — 19th lowest
> Median household income, lowest 20%: $12,334 — 8th lowest
> Richest 20% of residents’ share of income: 50.9% (2019) — 16th highest
> Poorest 20% of residents’ share of income: 3.2% (2019) — 13th lowest

12. Kentucky
> Typical high income to typical low income: 16.15 to 1
> Median household income, highest 20%: $183,549 — 6th lowest
> Median household income, lowest 20%: $11,367 — 6th lowest
> Richest 20% of residents’ share of income: 50.8% (2019) — 18th highest
> Poorest 20% of residents’ share of income: 3.1% (2019) — 11th lowest
[in-text-ad-2]

11. Georgia
> Typical high income to typical low income: 16.27 to 1
> Median household income, highest 20%: $222,399 — 20th highest
> Median household income, lowest 20%: $13,668 — 15th lowest
> Richest 20% of residents’ share of income: 51.4% (2019) — 7th highest
> Poorest 20% of residents’ share of income: 3.2% (2019) — 13th lowest

10. Alabama
> Typical high income to typical low income: 16.53 to 1
> Median household income, highest 20%: $180,469 — 4th lowest
> Median household income, lowest 20%: $10,916 — 4th lowest
> Richest 20% of residents’ share of income: 50.5% (2019) — 21st highest
> Poorest 20% of residents’ share of income: 3.1% (2019) — 8th lowest
[in-text-ad]

9. New Mexico
> Typical high income to typical low income: 16.58 to 1
> Median household income, highest 20%: $181,940 — 5th lowest
> Median household income, lowest 20%: $10,976 — 5th lowest
> Richest 20% of residents’ share of income: 50.8% (2019) — 18th highest
> Poorest 20% of residents’ share of income: 3.1% (2019) — 10th lowest
[recirclink id=737147]

8. Illinois
> Typical high income to typical low income: 16.72 to 1
> Median household income, highest 20%: $245,173 — 11th highest
> Median household income, lowest 20%: $14,667 — 23rd lowest
> Richest 20% of residents’ share of income: 51.2% (2019) — 8th highest
> Poorest 20% of residents’ share of income: 3.1% (2019) — 10th lowest

7. New Jersey
> Typical high income to typical low income: 16.72 to 1
> Median household income, highest 20%: $305,190 — 2nd highest
> Median household income, lowest 20%: $18,249 — 8th highest
> Richest 20% of residents’ share of income: 51.2% (2019) — 9th highest
> Poorest 20% of residents’ share of income: 3.1% (2019) — 8th lowest
[in-text-ad-2]

6. California
> Typical high income to typical low income: 17.39 to 1
> Median household income, highest 20%: $295,369 — 4th highest
> Median household income, lowest 20%: $16,981 — 11th highest
> Richest 20% of residents’ share of income: 52.0% (2019) — 5th highest
> Poorest 20% of residents’ share of income: 3.0% (2019) — 6th lowest

5. Mississippi
> Typical high income to typical low income: 17.43 to 1
> Median household income, highest 20%: $169,318 — 2nd lowest
> Median household income, lowest 20%: $9,715 — 2nd lowest
> Richest 20% of residents’ share of income: 52.0% (2019) — 4th highest
> Poorest 20% of residents’ share of income: 3.0% (2019) — 6th lowest
[in-text-ad]

4. Massachusetts
> Typical high income to typical low income: 18.19 to 1
> Median household income, highest 20%: $299,188 — 3rd highest
> Median household income, lowest 20%: $16,450 — 12th highest
> Richest 20% of residents’ share of income: 50.9% (2019) — 14th highest
> Poorest 20% of residents’ share of income: 2.8% (2019) — 4th lowest
[recirclink id=715247]

3. Connecticut
> Typical high income to typical low income: 19.09 to 1
> Median household income, highest 20%: $306,153 — the highest
> Median household income, lowest 20%: $16,037 — 14th highest
> Richest 20% of residents’ share of income: 53.4% (2019) — 2nd highest
> Poorest 20% of residents’ share of income: 2.8% (2019) — 4th lowest

2. Louisiana
> Typical high income to typical low income: 20.16 to 1
> Median household income, highest 20%: $190,038 — 9th lowest
> Median household income, lowest 20%: $9,426 — the lowest
> Richest 20% of residents’ share of income: 52.3% (2019) — 3rd highest
> Poorest 20% of residents’ share of income: 2.6% (2019) — 2nd lowest
[in-text-ad-2]

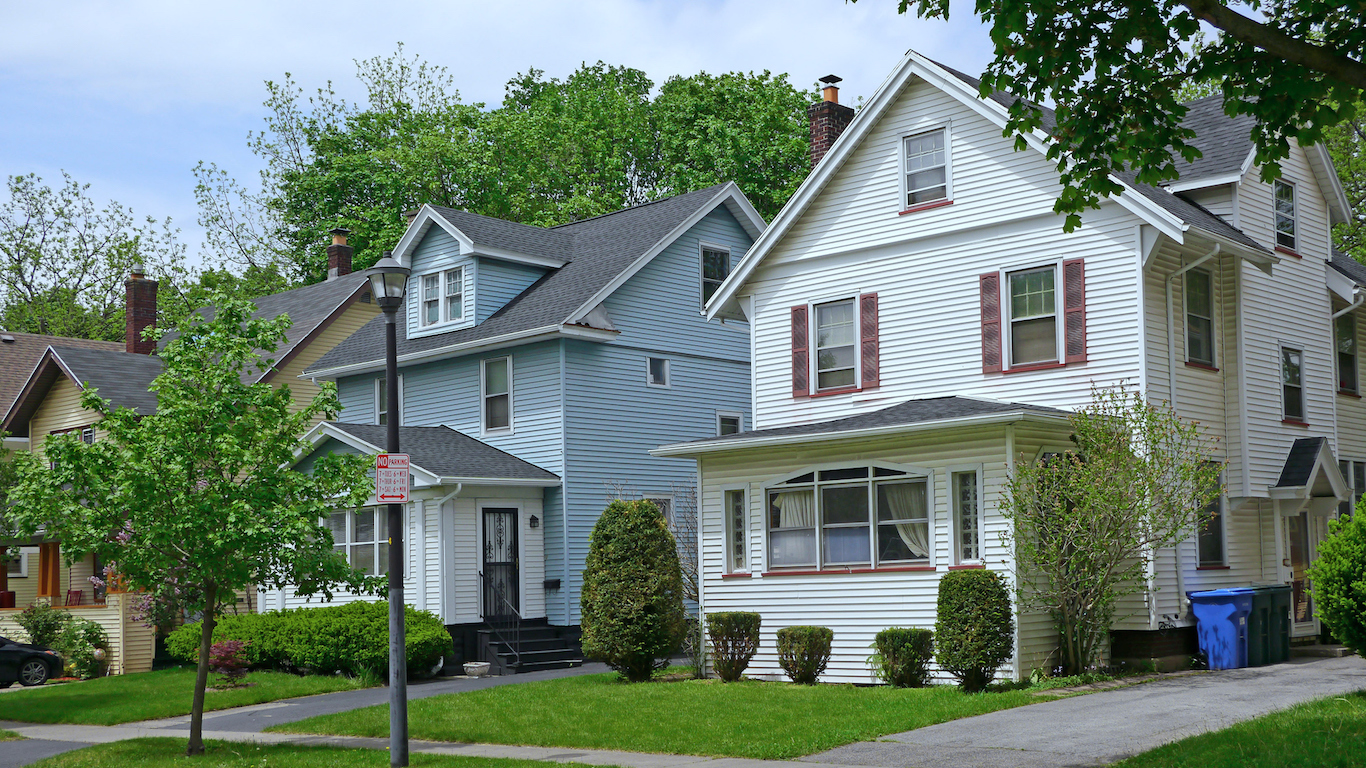
1. New York
> Typical high income to typical low income: 21.83 to 1
> Median household income, highest 20%: $291,906 — 5th highest
> Median household income, lowest 20%: $13,372 — 13th lowest
> Richest 20% of residents’ share of income: 54.4% (2019) — the highest
> Poorest 20% of residents’ share of income: 2.5% (2019) — the lowest
Contact [email protected] for any questions or corrections.