The Biden administration has proposed a $6 trillion budget aimed at improving infrastructure, education, and health care. If passed, it would push federal spending to its highest level since World War II. It could also usher in the reversal of a long-term trend of declining government employment.
Over the last decade, the number of Americans employed by governments at the local, state, and federal levels has fallen from 22.5 million in 2010 to 21.9 million in 2020, a 2.6% drop. Nationwide, the public sector accounts for 15.4% of all employment. Government employment is not evenly distributed across the country, however. Depending on the state, the share of public sector jobs ranges from less than 13% to over 25%.
Using 2020 employment figures from the Bureau of Labor Statistics, 24/7 Wall St. ranked all 50 states based on federal, state, and local government employees as a share of total employment.
Government occupations that provide services at the local level account for a large share of total government employment. Since such positions are needed everywhere, states with relatively low population density tend to have higher per capita public sector employment. In these places, private sector employment opportunities are often scarce, but a base level of public sector workers is still needed to run municipalities, administer justice, manage waste, and educate children. Here is a look at the best and worst run states in America.
Many states with a larger than typical share of public sector workers also have higher than average government spending on a per capita basis. While there are several notable exceptions, in seven of the 10 states where government employment accounts for the smallest share of total employment, state and local government spending per capita is below the $10,131 national average. Here is a look at what your state spends on you.
Click here to see the states where the most people work for the government.
Click here to see our detailed methodology.

50. Pennsylvania
> Gov’t employees, 2020: 12.2% of workforce
> Gov’t employment change, 2010-2020: -11.1% (770,600 to 685,000)
> State & local gov’t. spending per capita: $10,841 (13th highest)
> Population density: 278 per sq. mile (9th highest)
[in-text-ad]
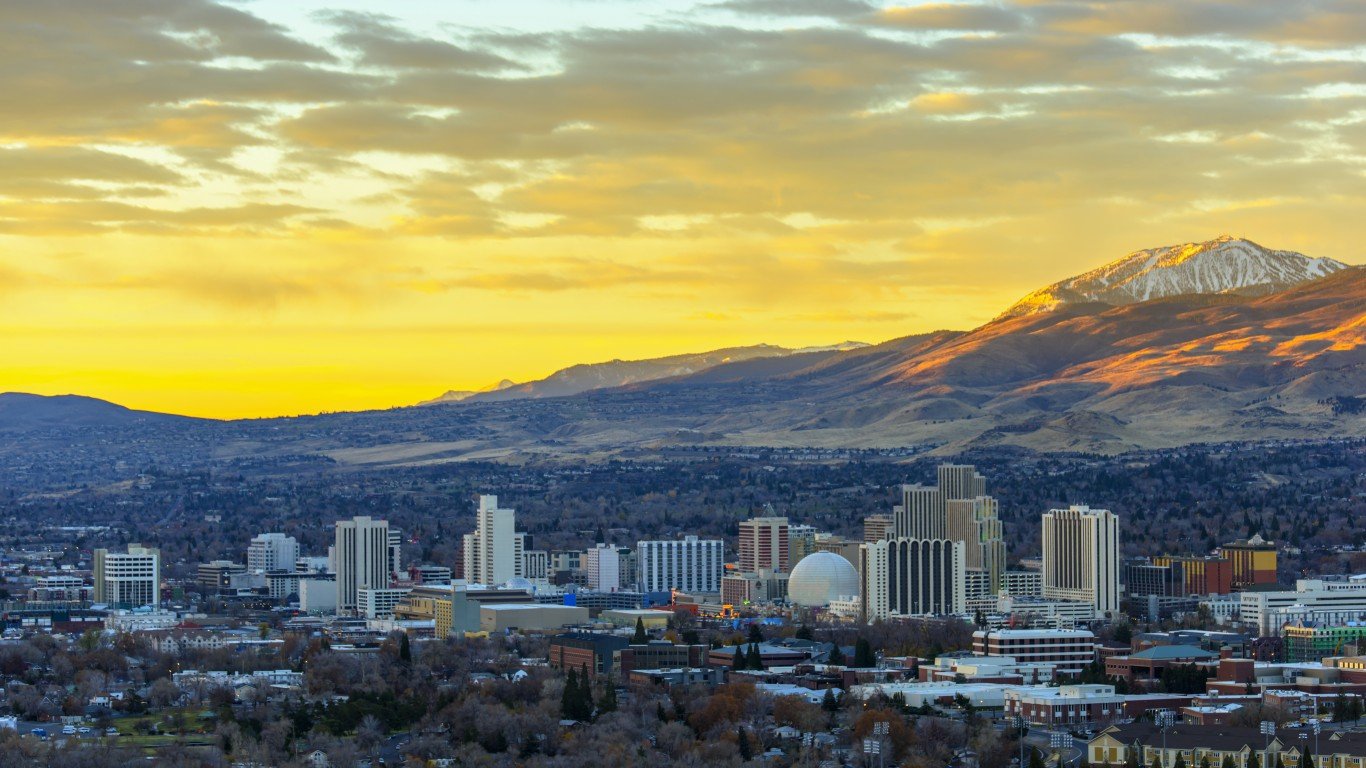
49. Nevada
> Gov’t employees, 2020: 12.5% of workforce
> Gov’t employment change, 2010-2020: +3.8% (153,800 to 159,600)
> State & local gov’t. spending per capita: $8,057 (7th lowest)
> Population density: 28 per sq. mile (9th lowest)
[recirclink id=824405]
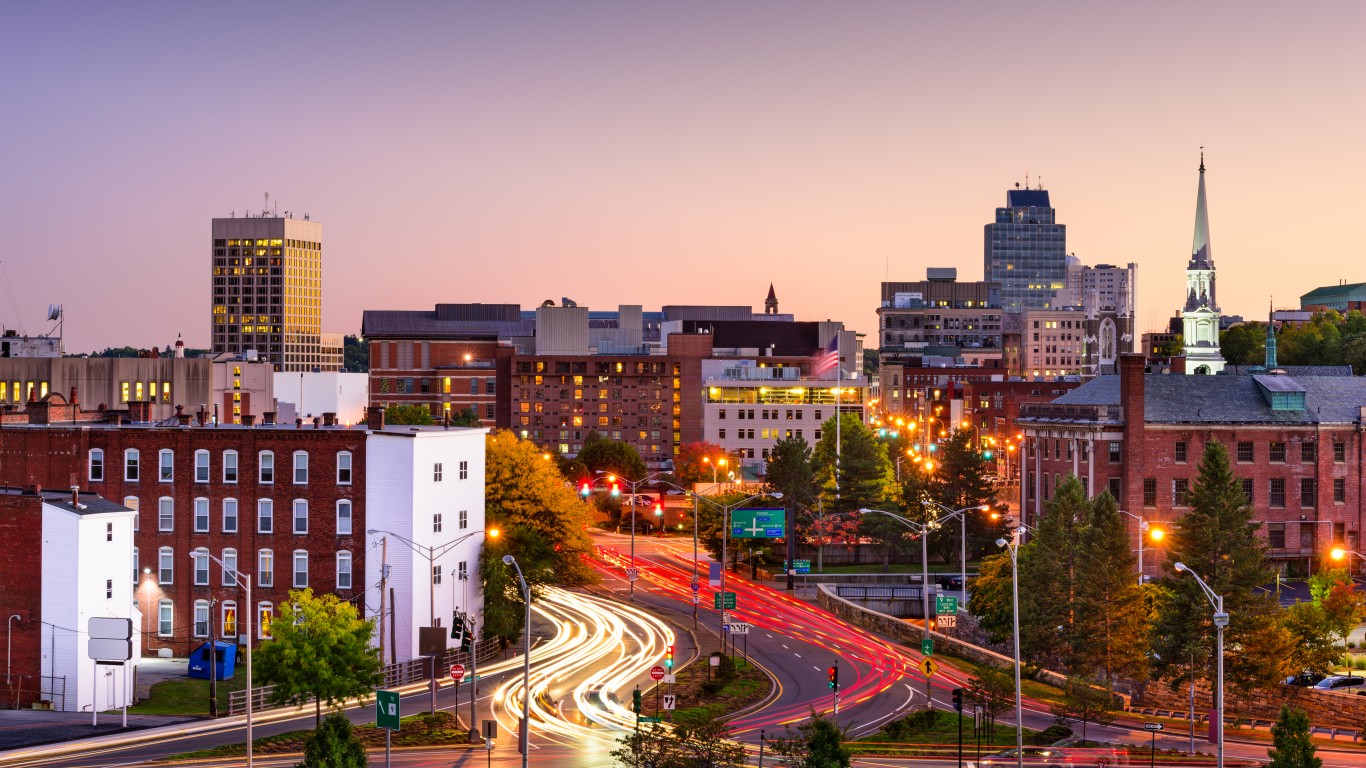
48. Massachusetts
> Gov’t employees, 2020: 13.0% of workforce
> Gov’t employment change, 2010-2020: -0.3% (439,300 to 437,800)
> State & local gov’t. spending per capita: $11,976 (7th highest)
> Population density: 653 per sq. mile (3rd highest)

47. Florida
> Gov’t employees, 2020: 13.0% of workforce
> Gov’t employment change, 2010-2020: -0.5% (1,114,600 to 1,108,900)
> State & local gov’t. spending per capita: $7,946 (6th lowest)
> Population density: 331 per sq. mile (8th highest)
[in-text-ad-2]

46. New Hampshire
> Gov’t employees, 2020: 13.4% of workforce
> Gov’t employment change, 2010-2020: -10.9% (95,900 to 85,400)
> State & local gov’t. spending per capita: $8,610 (12th lowest)
> Population density: 146 per sq. mile (19th highest)

45. Wisconsin
> Gov’t employees, 2020: 13.7% of workforce
> Gov’t employment change, 2010-2020: -8.0% (419,700 to 386,200)
> State & local gov’t. spending per capita: $9,545 (24th highest)
> Population density: 89 per sq. mile (25th lowest)
[in-text-ad]

44. Rhode Island
> Gov’t employees, 2020: 13.8% of workforce
> Gov’t employment change, 2010-2020: -3.2% (65,300 to 63,200)
> State & local gov’t. spending per capita: $11,043 (12th highest)
> Population density: 684 per sq. mile (2nd highest)
[recirclink id=726155]

43. Indiana
> Gov’t employees, 2020: 13.8% of workforce
> Gov’t employment change, 2010-2020: -5.7% (437,300 to 412,400)
> State & local gov’t. spending per capita: $8,959 (17th lowest)
> Population density: 185 per sq. mile (15th highest)

42. Illinois
> Gov’t employees, 2020: 13.8% of workforce
> Gov’t employment change, 2010-2020: -7.8% (852,200 to 785,800)
> State & local gov’t. spending per capita: $9,832 (20th highest)
> Population density: 217 per sq. mile (12th highest)
[in-text-ad-2]

41. Connecticut
> Gov’t employees, 2020: 14.3% of workforce
> Gov’t employment change, 2010-2020: -10.8% (250,800 to 223,800)
> State & local gov’t. spending per capita: $9,927 (19th highest)
> Population density: 642 per sq. mile (4th highest)

40. Michigan
> Gov’t employees, 2020: 14.4% of workforce
> Gov’t employment change, 2010-2020: -8.5% (635,600 to 581,500)
> State & local gov’t. spending per capita: $9,343 (21st lowest)
> Population density: 103 per sq. mile (24th highest)
[in-text-ad]

39. Tennessee
> Gov’t employees, 2020: 14.4% of workforce
> Gov’t employment change, 2010-2020: +0.4% (430,600 to 432,500)
> State & local gov’t. spending per capita: $7,409 (3rd lowest)
> Population density: 163 per sq. mile (17th highest)
[recirclink id=824405]
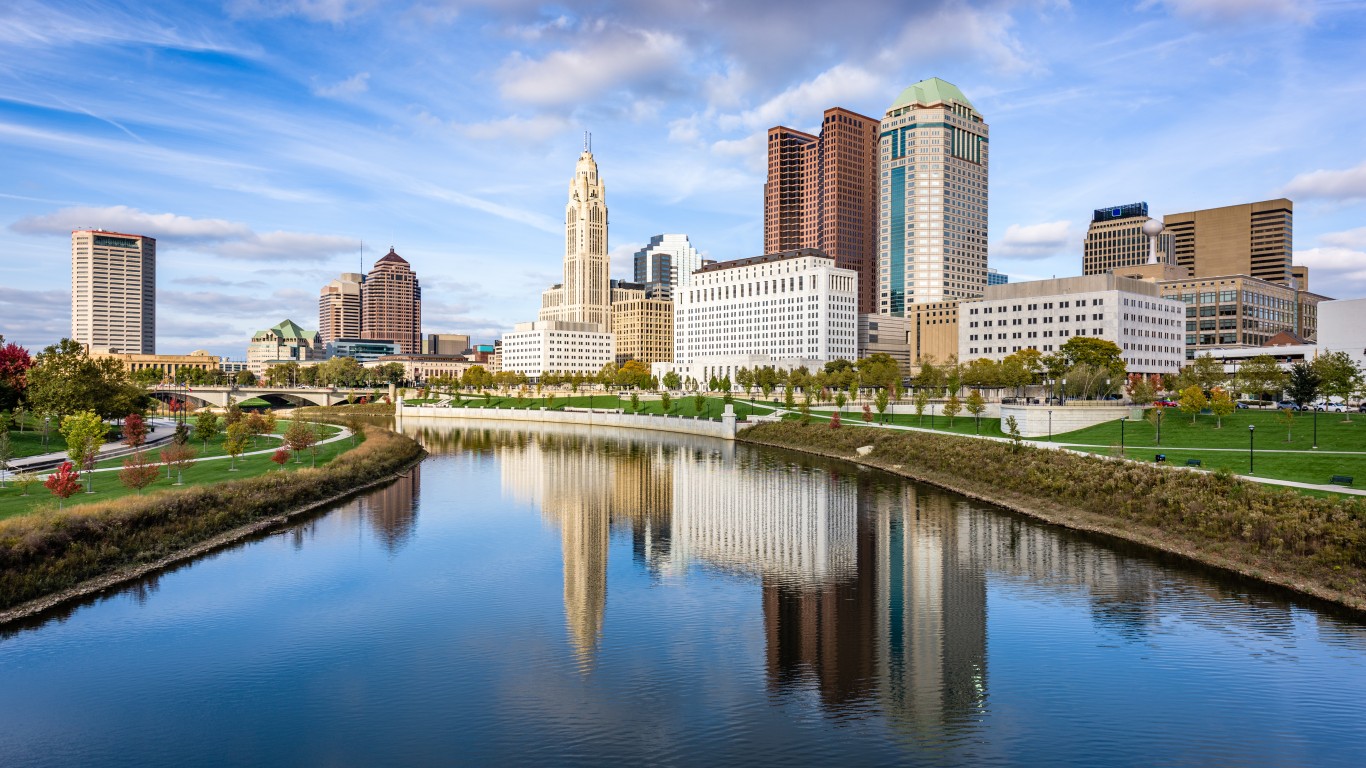
38. Ohio
> Gov’t employees, 2020: 14.5% of workforce
> Gov’t employment change, 2010-2020: -3.4% (786,100 to 759,200)
> State & local gov’t. spending per capita: $9,648 (22nd highest)
> Population density: 261 per sq. mile (10th highest)
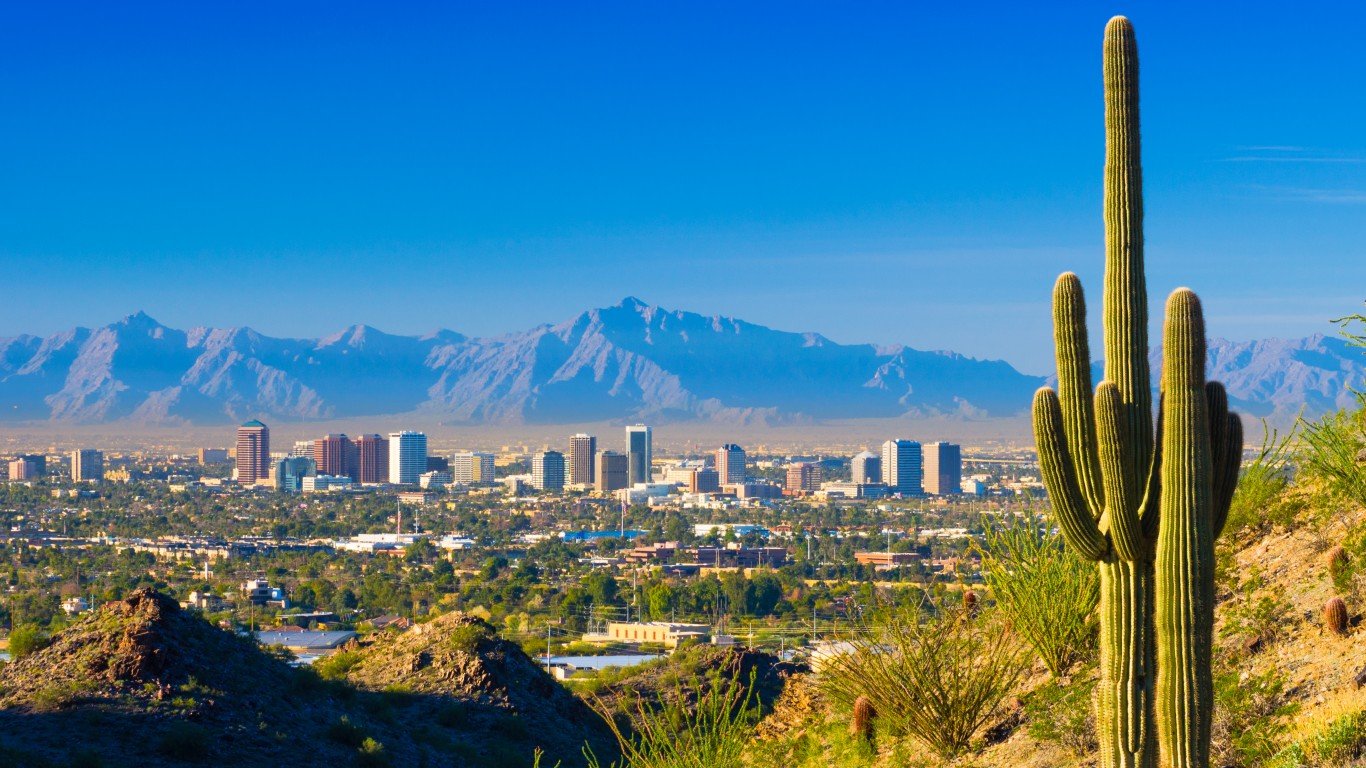
37. Arizona
> Gov’t employees, 2020: 14.5% of workforce
> Gov’t employment change, 2010-2020: -0.9% (416,300 to 412,500)
> State & local gov’t. spending per capita: $7,149 (2nd lowest)
> Population density: 65 per sq. mile (21st lowest)
[in-text-ad-2]

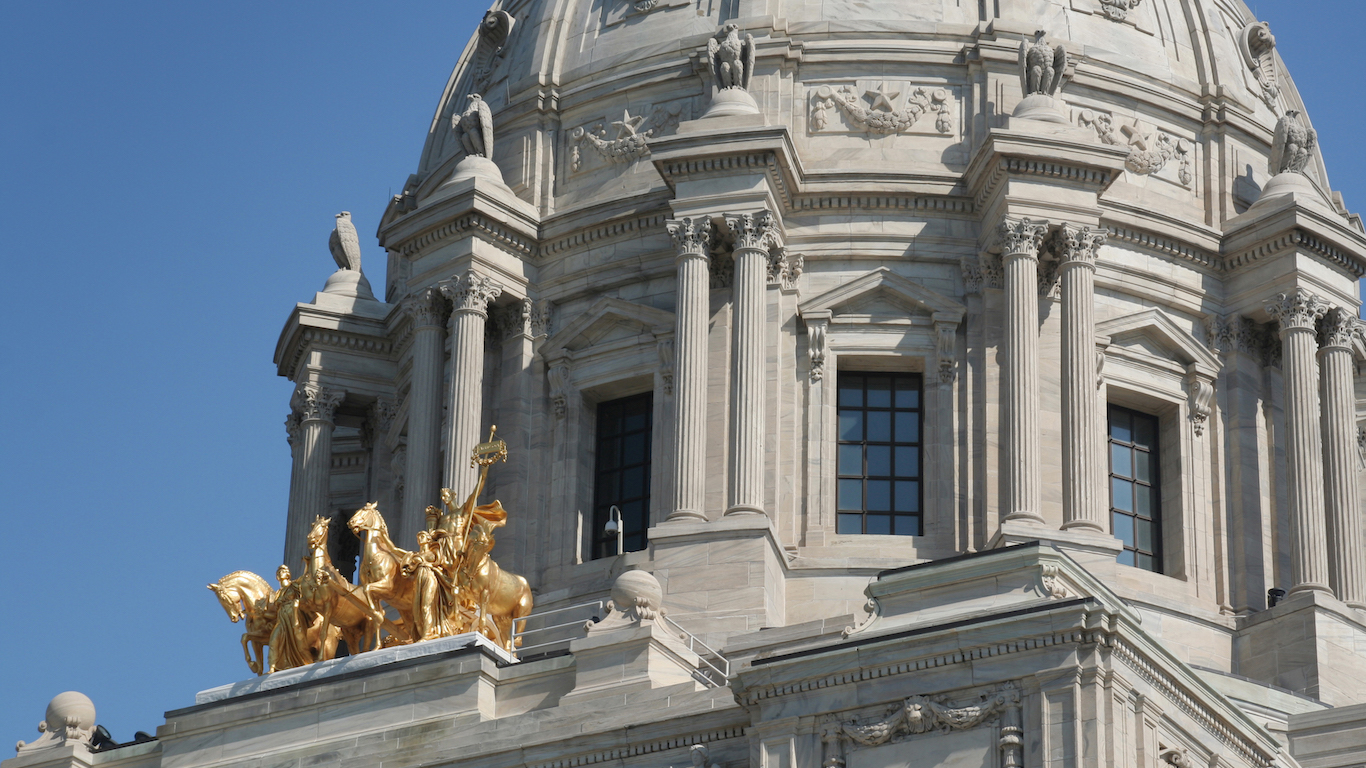
36. Minnesota
> Gov’t employees, 2020: 14.6% of workforce
> Gov’t employment change, 2010-2020: -2.4% (416,500 to 406,400)
> State & local gov’t. spending per capita: $11,159 (11th highest)
> Population density: 65 per sq. mile (20th lowest)

35. Delaware
> Gov’t employees, 2020: 14.9% of workforce
> Gov’t employment change, 2010-2020: +2.8% (63,800 to 65,600)
> State & local gov’t. spending per capita: $11,589 (9th highest)
> Population density: 396 per sq. mile (6th highest)
[in-text-ad]

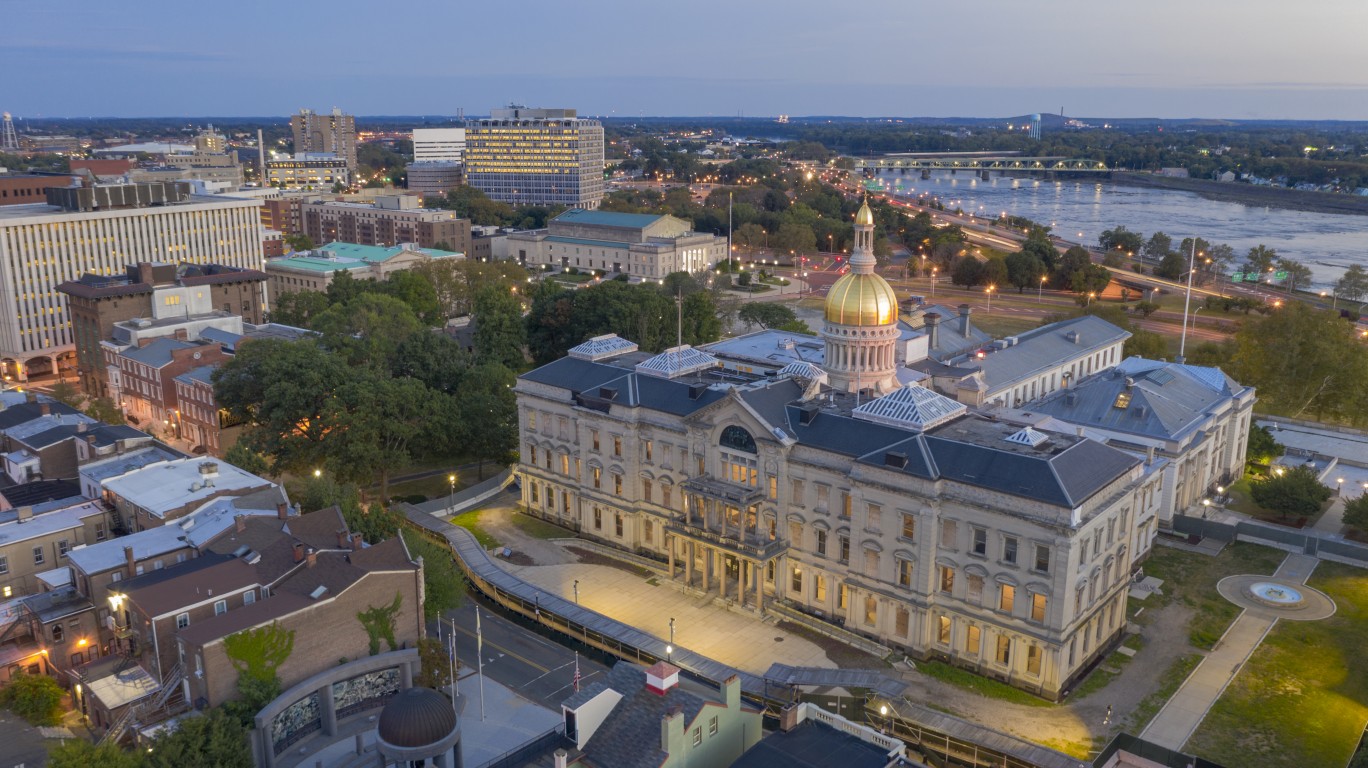
34. New Jersey
> Gov’t employees, 2020: 15.0% of workforce
> Gov’t employment change, 2010-2020: -9.1% (636,500 to 578,600)
> State & local gov’t. spending per capita: $10,675 (17th highest)
> Population density: 1,018 per sq. mile (the highest)
[recirclink id=726155]

33. Missouri
> Gov’t employees, 2020: 15.3% of workforce
> Gov’t employment change, 2010-2020: -5.1% (447,700 to 424,700)
> State & local gov’t. spending per capita: $8,198 (9th lowest)
> Population density: 88 per sq. mile (23rd lowest)

32. California
> Gov’t employees, 2020: 15.4% of workforce
> Gov’t employment change, 2010-2020: +1.6% (2,448,400 to 2,487,100)
> State & local gov’t. spending per capita: $12,970 (4th highest)
> Population density: 240 per sq. mile (11th highest)
[in-text-ad-2]

31. Georgia
> Gov’t employees, 2020: 15.4% of workforce
> Gov’t employment change, 2010-2020: -2.6% (698,100 to 680,200)
> State & local gov’t. spending per capita: $7,148 (the lowest)
> Population density: 180 per sq. mile (16th highest)

30. Oregon
> Gov’t employees, 2020: 15.6% of workforce
> Gov’t employment change, 2010-2020: -5.0% (299,800 to 284,700)
> State & local gov’t. spending per capita: $12,075 (5th highest)
> Population density: 43 per sq. mile (13th lowest)
[in-text-ad]
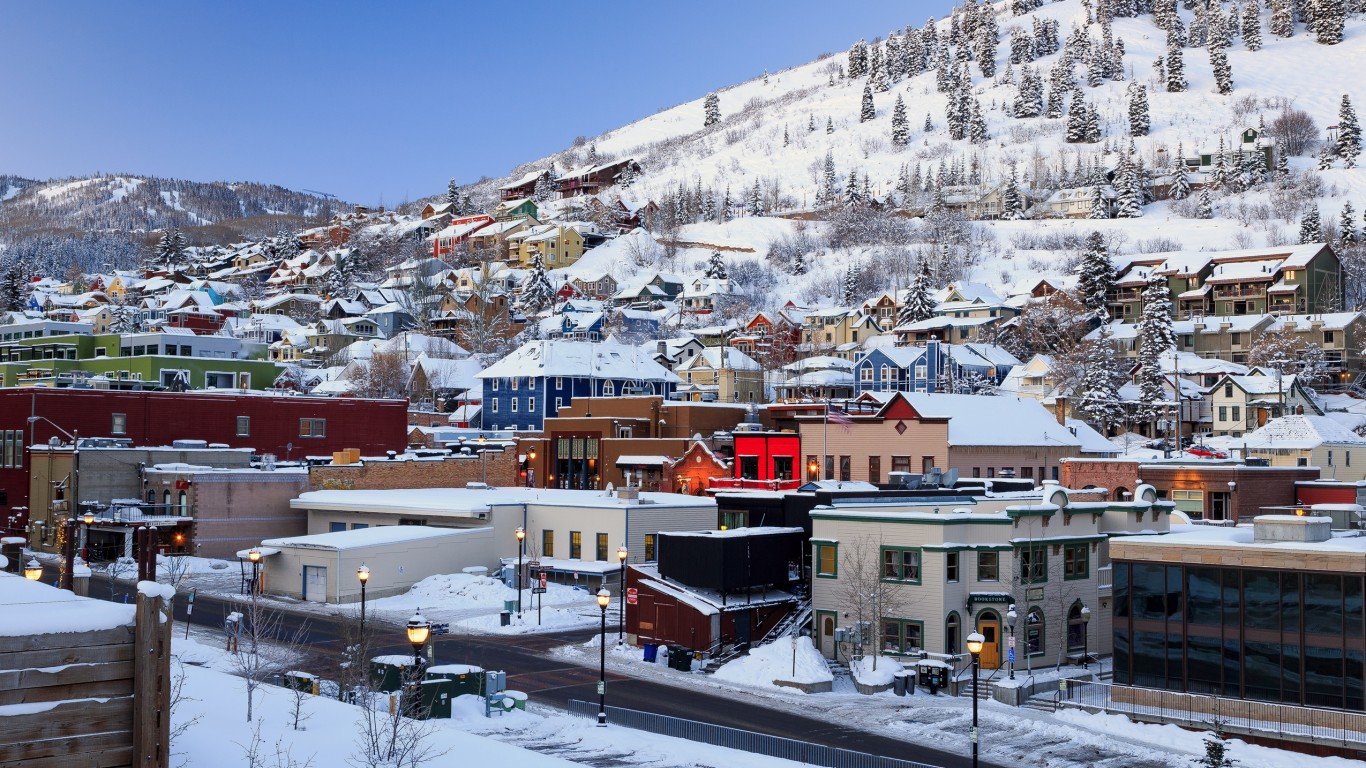
29. Utah
> Gov’t employees, 2020: 16.0% of workforce
> Gov’t employment change, 2010-2020: +12.6% (217,700 to 245,100)
> State & local gov’t. spending per capita: $9,342 (20th lowest)
> Population density: 38 per sq. mile (12th lowest)
[recirclink id=824405]

28. Texas
> Gov’t employees, 2020: 16.0% of workforce
> Gov’t employment change, 2010-2020: +3.8% (1,893,200 to 1,964,900)
> State & local gov’t. spending per capita: $8,715 (13th lowest)
> Population density: 109 per sq. mile (22nd highest)

27. Kentucky
> Gov’t employees, 2020: 16.3% of workforce
> Gov’t employment change, 2010-2020: -6.0% (317,200 to 298,300)
> State & local gov’t. spending per capita: $8,907 (16th lowest)
> Population density: 111 per sq. mile (21st highest)
[in-text-ad-2]

26. North Carolina
> Gov’t employees, 2020: 16.3% of workforce
> Gov’t employment change, 2010-2020: -0.3% (715,900 to 714,000)
> State & local gov’t. spending per capita: $8,460 (11th lowest)
> Population density: 197 per sq. mile (14th highest)

25. Maine
> Gov’t employees, 2020: 16.4% of workforce
> Gov’t employment change, 2010-2020: -6.0% (104,000 to 97,800)
> State & local gov’t. spending per capita: $9,392 (24th lowest)
> Population density: 38 per sq. mile (11th lowest)
[in-text-ad]

24. New York
> Gov’t employees, 2020: 16.4% of workforce
> Gov’t employment change, 2010-2020: -4.5% (1,511,200 to 1,443,500)
> State & local gov’t. spending per capita: $15,677 (2nd highest)
> Population density: 354 per sq. mile (7th highest)
[recirclink id=726155]
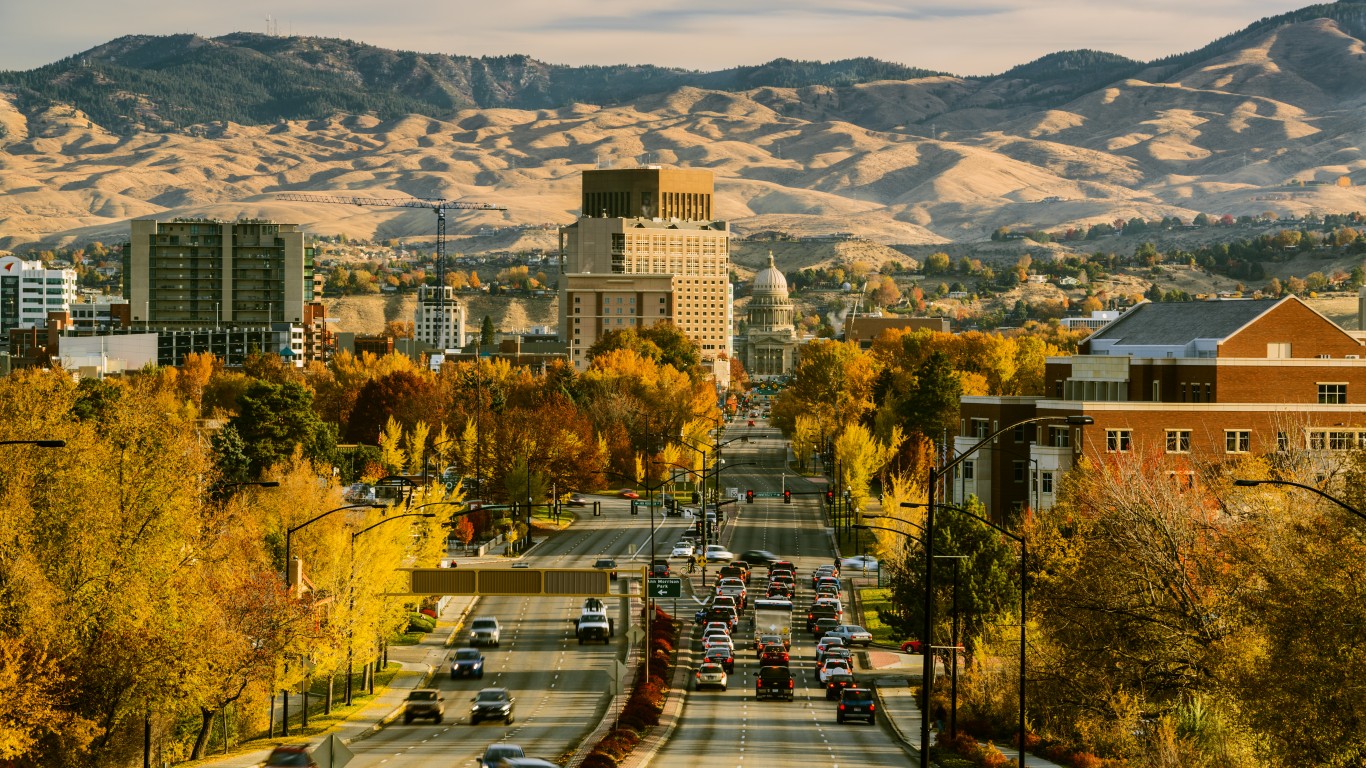
23. Idaho
> Gov’t employees, 2020: 16.5% of workforce
> Gov’t employment change, 2010-2020: +4.8% (118,600 to 124,300)
> State & local gov’t. spending per capita: $7,436 (4th lowest)
> Population density: 22 per sq. mile (7th lowest)
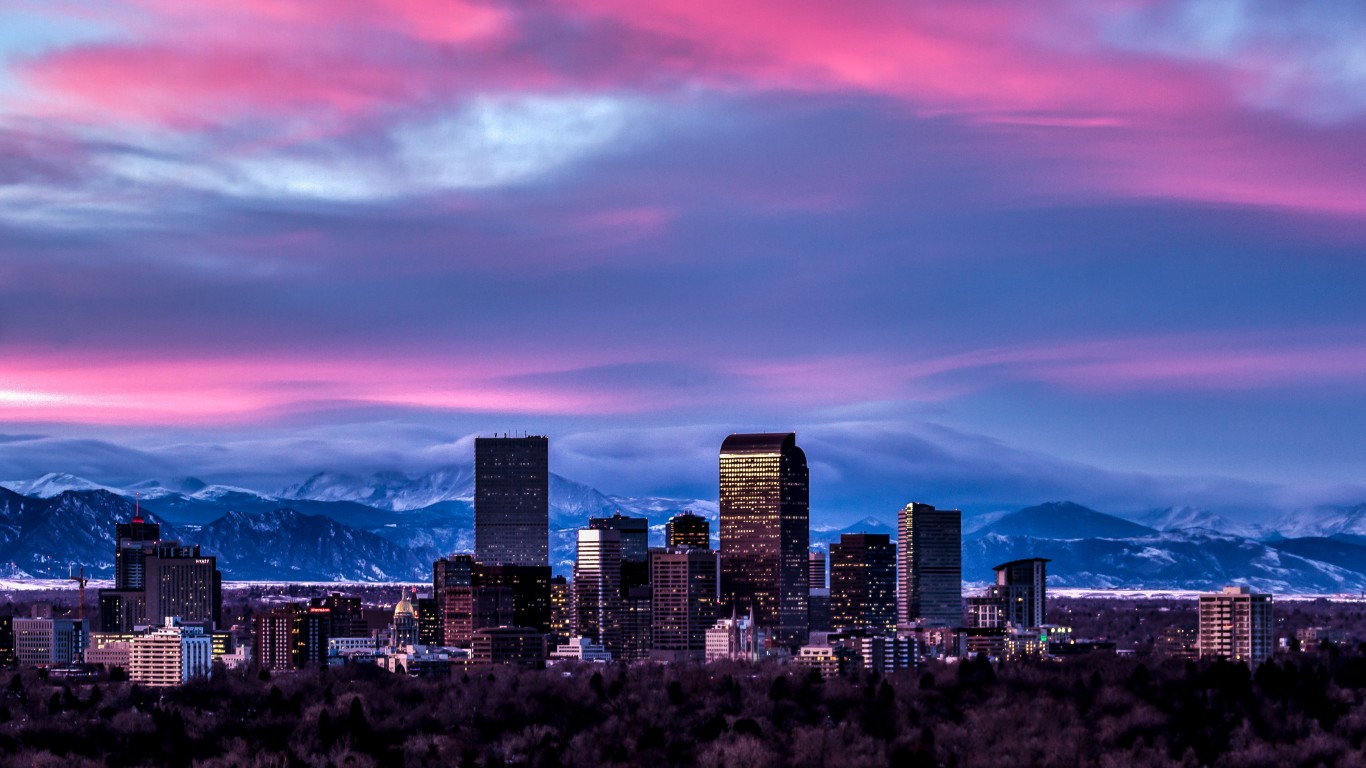
22. Colorado
> Gov’t employees, 2020: 16.7% of workforce
> Gov’t employment change, 2010-2020: +12.1% (393,400 to 441,000)
> State & local gov’t. spending per capita: $9,704 (21st highest)
> Population density: 56 per sq. mile (14th lowest)
[in-text-ad-2]

21. Iowa
> Gov’t employees, 2020: 16.7% of workforce
> Gov’t employment change, 2010-2020: -0.4% (253,100 to 252,100)
> State & local gov’t. spending per capita: $10,157 (18th highest)
> Population density: 56 per sq. mile (15th lowest)
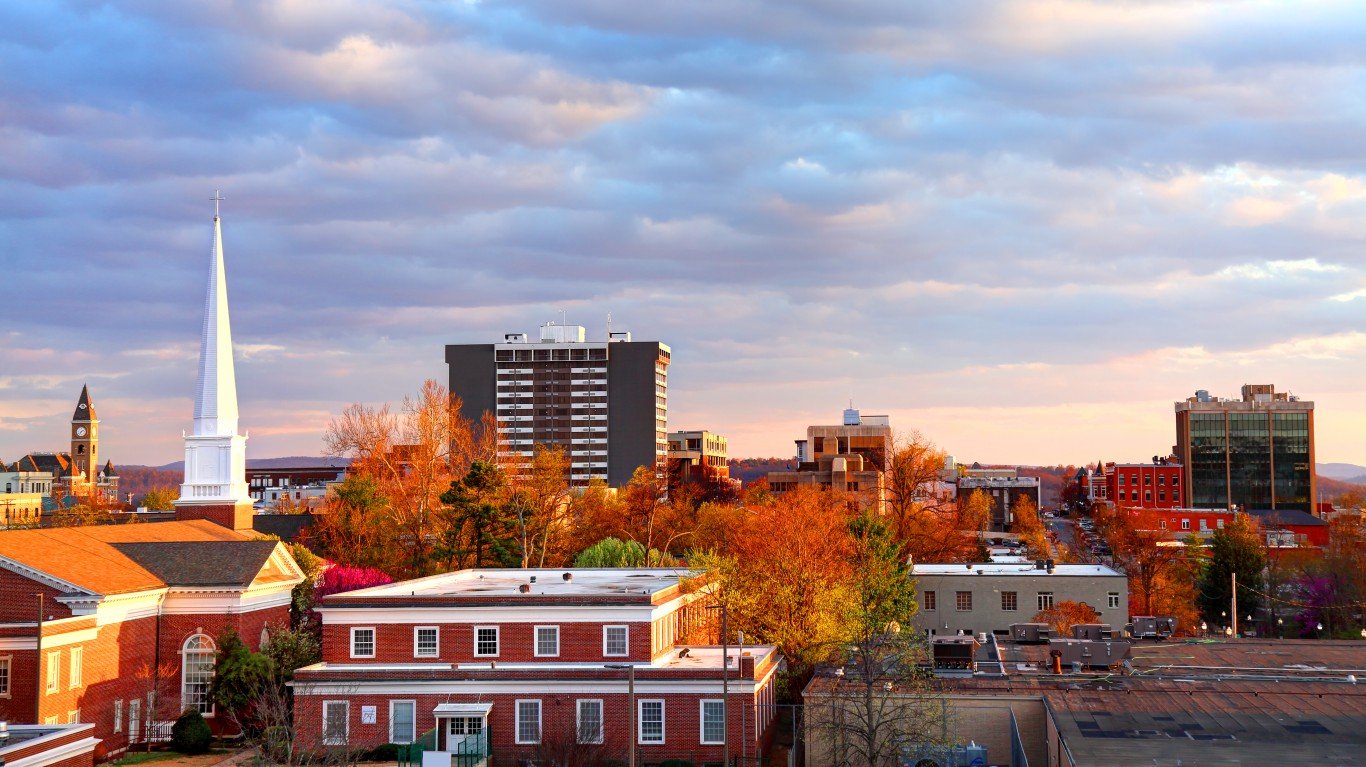
20. Arkansas
> Gov’t employees, 2020: 16.8% of workforce
> Gov’t employment change, 2010-2020: -4.6% (218,200 to 208,200)
> State & local gov’t. spending per capita: $8,421 (10th lowest)
> Population density: 57 per sq. mile (17th lowest)
[in-text-ad]

19. Nebraska
> Gov’t employees, 2020: 17.0% of workforce
> Gov’t employment change, 2010-2020: -0.7% (169,600 to 168,400)
> State & local gov’t. spending per capita: $9,482 (25th lowest)
> Population density: 25 per sq. mile (8th lowest)
[recirclink id=824405]
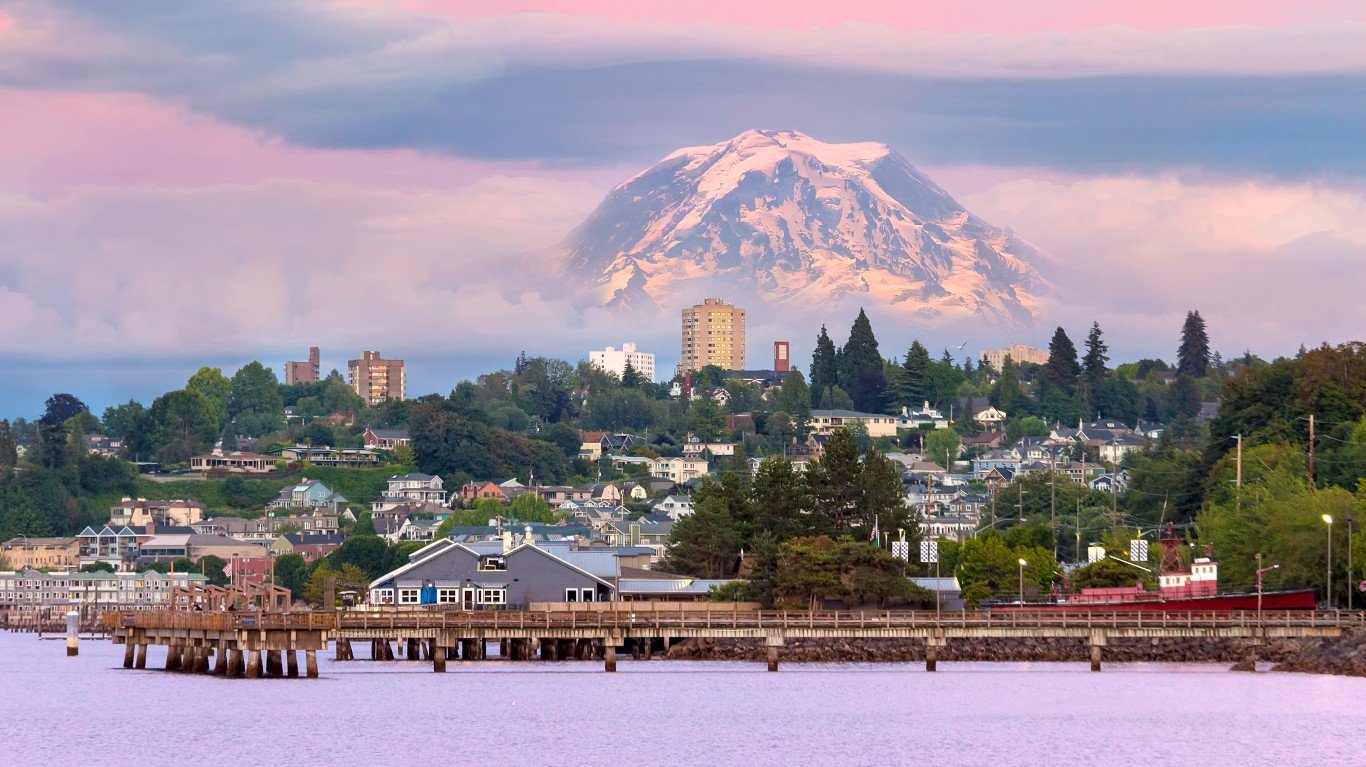
18. Washington
> Gov’t employees, 2020: 17.1% of workforce
> Gov’t employment change, 2010-2020: +2.1% (550,000 to 561,400)
> State & local gov’t. spending per capita: $10,750 (16th highest)
> Population density: 108 per sq. mile (23rd highest)

17. Louisiana
> Gov’t employees, 2020: 17.3% of workforce
> Gov’t employment change, 2010-2020: -13.8% (368,900 to 318,000)
> State & local gov’t. spending per capita: $9,518 (25th highest)
> Population density: 89 per sq. mile (24th lowest)
[in-text-ad-2]

16. South Carolina
> Gov’t employees, 2020: 17.6% of workforce
> Gov’t employment change, 2010-2020: +3.1% (355,200 to 366,300)
> State & local gov’t. spending per capita: $8,855 (15th lowest)
> Population density: 163 per sq. mile (18th highest)

15. South Dakota
> Gov’t employees, 2020: 18.0% of workforce
> Gov’t employment change, 2010-2020: -2.5% (78,700 to 76,700)
> State & local gov’t. spending per capita: $8,125 (8th lowest)
> Population density: 12 per sq. mile (5th lowest)
[in-text-ad]
14. Vermont
> Gov’t employees, 2020: 18.4% of workforce
> Gov’t employment change, 2010-2020: -3.8% (54,900 to 52,800)
> State & local gov’t. spending per capita: $11,880 (8th highest)
> Population density: 65 per sq. mile (19th lowest)
[recirclink id=726155]

13. Virginia
> Gov’t employees, 2020: 18.5% of workforce
> Gov’t employment change, 2010-2020: +0.8% (706,600 to 712,100)
> State & local gov’t. spending per capita: $9,357 (22nd lowest)
> Population density: 201 per sq. mile (13th highest)

12. Kansas
> Gov’t employees, 2020: 18.5% of workforce
> Gov’t employment change, 2010-2020: -4.2% (261,800 to 250,900)
> State & local gov’t. spending per capita: $9,608 (23rd highest)
> Population density: 35 per sq. mile (10th lowest)
[in-text-ad-2]

11. Montana
> Gov’t employees, 2020: 19.0% of workforce
> Gov’t employment change, 2010-2020: -3.2% (92,000 to 89,100)
> State & local gov’t. spending per capita: $9,201 (19th lowest)
> Population density: 7 per sq. mile (3rd lowest)

10. North Dakota
> Gov’t employees, 2020: 19.3% of workforce
> Gov’t employment change, 2010-2020: -0.4% (79,600 to 79,300)
> State & local gov’t. spending per capita: $12,016 (6th highest)
> Population density: 11 per sq. mile (4th lowest)
[in-text-ad]

9. Maryland
> Gov’t employees, 2020: 19.3% of workforce
> Gov’t employment change, 2010-2020: -0.7% (502,000 to 498,400)
> State & local gov’t. spending per capita: $10,820 (14th highest)
> Population density: 488 per sq. mile (5th highest)
[recirclink id=824405]

8. Alabama
> Gov’t employees, 2020: 19.4% of workforce
> Gov’t employment change, 2010-2020: -1.6% (390,700 to 384,600)
> State & local gov’t. spending per capita: $8,740 (14th lowest)
> Population density: 94 per sq. mile (25th highest)

7. Mississippi
> Gov’t employees, 2020: 21.3% of workforce
> Gov’t employment change, 2010-2020: -5.2% (249,000 to 236,100)
> State & local gov’t. spending per capita: $9,034 (18th lowest)
> Population density: 61 per sq. mile (18th lowest)
[in-text-ad-2]

6. Oklahoma
> Gov’t employees, 2020: 21.3% of workforce
> Gov’t employment change, 2010-2020: -0.8% (348,500 to 345,600)
> State & local gov’t. spending per capita: $7,886 (5th lowest)
> Population density: 57 per sq. mile (16th lowest)

5. Hawaii
> Gov’t employees, 2020: 21.7% of workforce
> Gov’t employment change, 2010-2020: -3.5% (125,200 to 120,800)
> State & local gov’t. spending per capita: $11,216 (10th highest)
> Population density: 129 per sq. mile (20th highest)
[in-text-ad]

4. West Virginia
> Gov’t employees, 2020: 22.0% of workforce
> Gov’t employment change, 2010-2020: -3.4% (153,600 to 148,400)
> State & local gov’t. spending per capita: $9,357 (23rd lowest)
> Population density: 74 per sq. mile (22nd lowest)
[recirclink id=726155]

3. New Mexico
> Gov’t employees, 2020: 22.6% of workforce
> Gov’t employment change, 2010-2020: -9.3% (199,000 to 180,400)
> State & local gov’t. spending per capita: $10,769 (15th highest)
> Population density: 17 per sq. mile (6th lowest)
2. Wyoming
> Gov’t employees, 2020: 24.4% of workforce
> Gov’t employment change, 2010-2020: -6.7% (71,400 to 66,600)
> State & local gov’t. spending per capita: $14,779 (3rd highest)
> Population density: 6 per sq. mile (2nd lowest)
[in-text-ad-2]

1. Alaska
> Gov’t employees, 2020: 25.5% of workforce
> Gov’t employment change, 2010-2020: -10.1% (85,400 to 76,800)
> State & local gov’t. spending per capita: $18,455 (the highest)
> Population density: 1 per sq. mile (the lowest)
Methodology
To determine the states where the most people work for the government, 24/7 Wall St. reviewed employment data from the Bureau of Labor Statistics. States were ranked based on the size of the government workforce as a percentage of total employment in 2020. Data on employment by sector for each state in 2010 and 2020 came from the BLS Current Employment Statistics program. Preliminary data on direct state and local government expenditure in 2019 came from the U.S. Census Bureau’s Annual Survey of State and Local Government Finances and was adjusted for population using data from the Census Bureau’s American Community Survey. Data on total area by state used to calculate population density also came from the Census Bureau.