The Biden Administration issued in early August 2021 a new eviction moratorium. This one bans landlords in certain areas of the country that are struggling with COVID-19 outbreaks from evicting tenants through October 3. The administration said evictions could have a negative effect on efforts to contain the virus. Many Americans have struggled to keep up with their housing payments in the wake of COVID-19.
According to a Harvard University study, 30.2% of all U.S. households were either moderately or severely burdened by housing costs in 2021. Moderately burdened households spend 30%-50% of their income on housing costs, while severely burdened households spend over half of their income on housing. In some major metro areas, far more households are housing cost burdened than the average share nationwide.
To determine the cities where the largest share of households cannot afford their homes, 24/7 Wall St. reviewed data on housing cost burdens from the Joint Center for Housing Studies of Harvard University’s “The State of the Nation’s Housing 2021” report. The 100 largest metropolitan areas in the U.S. were ranked based on the percentage of households paying 30% or more of their monthly income on housing costs.
The 43 metro areas where more than 30% of households are burdened by housing costs are wholly or primarily located in 19 different states, as well as Washington, D.C. California has more metro areas on this list than any other state, with 10. Texas has the second most with six, and Florida has five.
Regionally, there are 17 Southern cities on this list, as well as 16 Western cities and nine Northeastern cities. The Chicago metro area is the only place in the Midwest in which more than 30% of households pay at least 30% of their incomes on housing.
In spite of these relatively high housing cost burdens, people still flocked to these areas. From 2010 to 2020, the U.S. population increased by 6.7%. In that same time, the population increased by a higher percentage in 27 of the 43 metro areas on the list. These are the cities Americans are flocking to.
Click here to see 43 cities where most people can’t afford their homes.
Click here to see our methodology.

43. Baltimore-Columbia-Towson, MD
> Households able to afford monthly payments: 69.9%
> Median monthly housing costs: $1,416
> Median household income: $81,000
> Population change, 2010-2020: +3.3%
[in-text-ad]

42. Washington-Arlington-Alexandria, DC-VA-MD-WV
> Households able to afford monthly payments: 69.8%
> Median monthly housing costs: $1,850
> Median household income: $104,500
> Population change, 2010-2020: +11.9%
[recirclink id=893049]
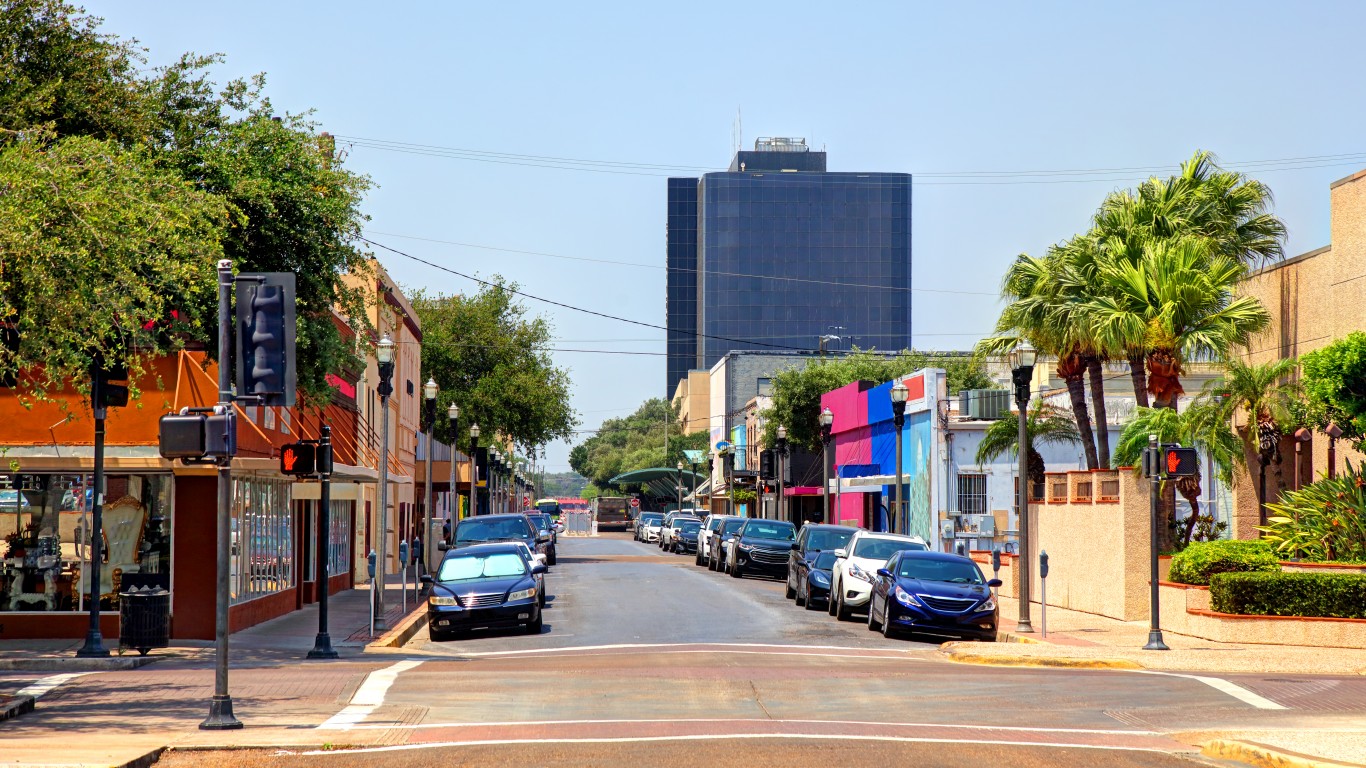
41. McAllen-Edinburg-Mission, TX
> Households able to afford monthly payments: 69.7%
> Median monthly housing costs: $675
> Median household income: $41,200
> Population change, 2010-2020: +13.0%

40. Worcester, MA-CT
> Households able to afford monthly payments: 69.5%
> Median monthly housing costs: $1,331
> Median household income: $76,500
> Population change, 2010-2020: +3.2%
[in-text-ad-2]

39. Greensboro-High Point, NC
> Households able to afford monthly payments: 69.5%
> Median monthly housing costs: $870
> Median household income: $50,000
> Population change, 2010-2020: +7.2%

38. San Antonio-New Braunfels, TX
> Households able to afford monthly payments: 69.2%
> Median monthly housing costs: $1,050
> Median household income: $60,700
> Population change, 2010-2020: +20.9%
[in-text-ad]

37. Lakeland-Winter Haven, FL
> Households able to afford monthly payments: 69.0%
> Median monthly housing costs: $900
> Median household income: $51,000
> Population change, 2010-2020: +23.7%
[recirclink id=910210]

36. Houston-The Woodlands-Sugar Land, TX
> Households able to afford monthly payments: 68.8%
> Median monthly housing costs: $1,198
> Median household income: $68,800
> Population change, 2010-2020: +20.8%

35. Colorado Springs, CO
> Households able to afford monthly payments: 68.5%
> Median monthly housing costs: $1,337
> Median household income: $72,000
> Population change, 2010-2020: +16.8%
[in-text-ad-2]

34. Chicago-Naperville-Elgin, IL-IN-WI
> Households able to afford monthly payments: 68.5%
> Median monthly housing costs: $1,300
> Median household income: $75,000
> Population change, 2010-2020: +-0.6%

33. Austin-Round Rock, TX
> Households able to afford monthly payments: 68.3%
> Median monthly housing costs: $1,447
> Median household income: $80,000
> Population change, 2010-2020: +33.7%
[in-text-ad]

32. Dallas-Fort Worth-Arlington, TX
> Households able to afford monthly payments: 68.3%
> Median monthly housing costs: $1,281
> Median household income: $71,000
> Population change, 2010-2020: +20.9%
[recirclink id=931307]

31. Seattle-Tacoma-Bellevue, WA
> Households able to afford monthly payments: 68.2%
> Median monthly housing costs: $1,750
> Median household income: $93,400
> Population change, 2010-2020: +16.8%

30. Denver-Aurora-Lakewood, CO
> Households able to afford monthly payments: 68.2%
> Median monthly housing costs: $1,570
> Median household income: $84,500
> Population change, 2010-2020: +17.6%
[in-text-ad-2]

29. Memphis, TN-MS-AR
> Households able to afford monthly payments: 68.1%
> Median monthly housing costs: $952
> Median household income: $52,400
> Population change, 2010-2020: +2.5%

28. El Paso, TX
> Households able to afford monthly payments: 68.1%
> Median monthly housing costs: $844
> Median household income: $48,800
> Population change, 2010-2020: +5.2%
[in-text-ad]

27. Philadelphia-Camden-Wilmington, PA-NJ-DE-MD
> Households able to afford monthly payments: 67.8%
> Median monthly housing costs: $1,285
> Median household income: $74,000
> Population change, 2010-2020: +2.4%
[recirclink id=873328]

26. New Orleans-Metairie, LA
> Households able to afford monthly payments: 67.7%
> Median monthly housing costs: $970
> Median household income: $55,000
> Population change, 2010-2020: +6.9%

25. Portland-Vancouver-Hillsboro, OR-WA
> Households able to afford monthly payments: 67.7%
> Median monthly housing costs: $1,475
> Median household income: $77,200
> Population change, 2010-2020: +12.8%
[in-text-ad-2]

24. Tampa-St. Petersburg-Clearwater, FL
> Households able to afford monthly payments: 67.6%
> Median monthly housing costs: $1,080
> Median household income: $57,200
> Population change, 2010-2020: +16.5%

23. Hartford-West Hartford-East Hartford, CT
> Households able to afford monthly payments: 67.5%
> Median monthly housing costs: $1,340
> Median household income: $76,380
> Population change, 2010-2020: +-0.9%
[in-text-ad]

22. Providence-Warwick, RI-MA
> Households able to afford monthly payments: 67.3%
> Median monthly housing costs: $1,235
> Median household income: $70,000
> Population change, 2010-2020: +1.4%
[recirclink id=838031]

21. Deltona-Daytona Beach-Ormond Beach, FL
> Households able to afford monthly payments: 67.3%
> Median monthly housing costs: $979
> Median household income: $54,000
> Population change, 2010-2020: +15.2%

20. Virginia Beach-Norfolk-Newport News, VA-NC
> Households able to afford monthly payments: 66.8%
> Median monthly housing costs: $1,270
> Median household income: $67,600
> Population change, 2010-2020: +3.8%
[in-text-ad-2]

19. Springfield, MA
> Households able to afford monthly payments: 66.3%
> Median monthly housing costs: $1,078
> Median household income: $62,150
> Population change, 2010-2020: +0.4%

18. Boston-Cambridge-Newton, MA-NH
> Households able to afford monthly payments: 66.2%
> Median monthly housing costs: $1,799
> Median household income: $93,000
> Population change, 2010-2020: +7.2%
[in-text-ad]
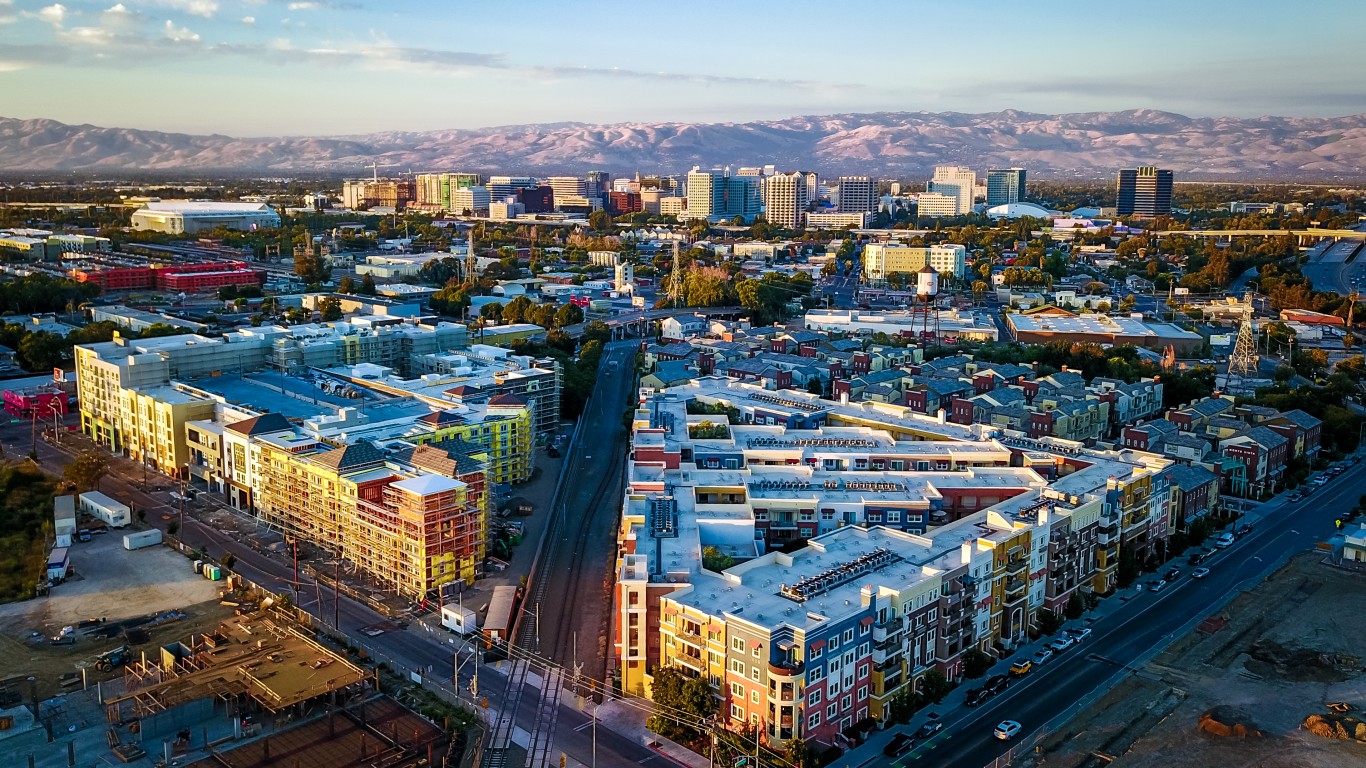
17. San Jose-Sunnyvale-Santa Clara, CA
> Households able to afford monthly payments: 66.1%
> Median monthly housing costs: $2,451
> Median household income: $129,400
> Population change, 2010-2020: +7.3%
[recirclink id=893049]

16. Bridgeport-Stamford-Norwalk, CT
> Households able to afford monthly payments: 66.1%
> Median monthly housing costs: $1,854
> Median household income: $97,800
> Population change, 2010-2020: +2.8%

15. San Francisco-Oakland-Hayward, CA
> Households able to afford monthly payments: 65.1%
> Median monthly housing costs: $2,183
> Median household income: $113,200
> Population change, 2010-2020: +8.3%
[in-text-ad-2]

14. Orlando-Kissimmee-Sanford, FL
> Households able to afford monthly payments: 64.9%
> Median monthly housing costs: $1,230
> Median household income: $61,200
> Population change, 2010-2020: +23.7%

13. Sacramento–Roseville–Arden-Arcade, CA
> Households able to afford monthly payments: 64.2%
> Median monthly housing costs: $1,520
> Median household income: $76,900
> Population change, 2010-2020: +10.5%
[in-text-ad]

12. Stockton-Lodi, CA
> Households able to afford monthly payments: 63.3%
> Median monthly housing costs: $1,417
> Median household income: $70,000
> Population change, 2010-2020: +12.1%
[recirclink id=910210]

11. New Haven-Milford, CT
> Households able to afford monthly payments: 63.1%
> Median monthly housing costs: $1,360
> Median household income: $69,004
> Population change, 2010-2020: +-1.2%

10. Las Vegas-Henderson-Paradise, NV
> Households able to afford monthly payments: 62.7%
> Median monthly housing costs: $1,210
> Median household income: $61,000
> Population change, 2010-2020: +18.7%
[in-text-ad-2]

9. Oxnard-Thousand Oaks-Ventura, CA
> Households able to afford monthly payments: 62.0%
> Median monthly housing costs: $2,023
> Median household income: $92,500
> Population change, 2010-2020: +2.2%
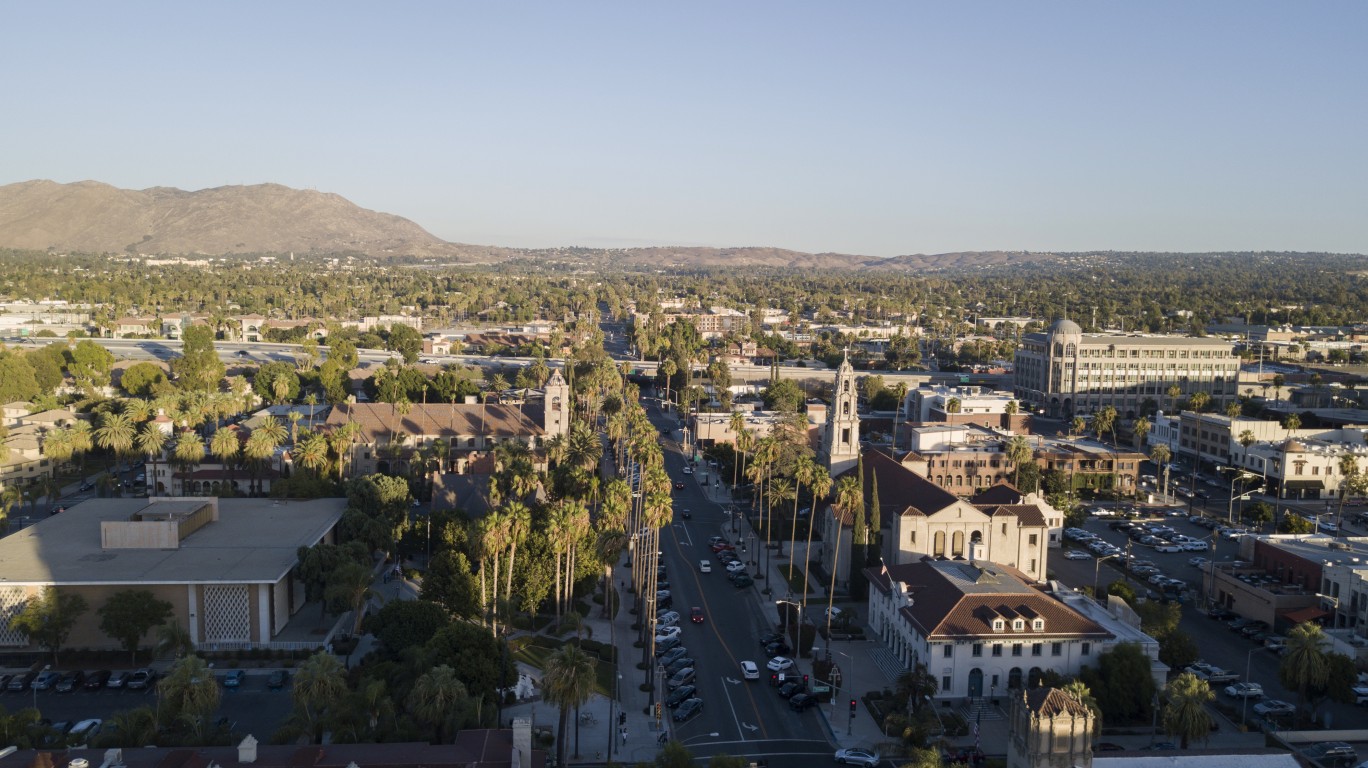
8. Riverside-San Bernardino-Ontario, CA
> Households able to afford monthly payments: 61.2%
> Median monthly housing costs: $1,500
> Median household income: $70,500
> Population change, 2010-2020: +10.7%
[in-text-ad]

7. New York-Newark-Jersey City, NY-NJ-PA
> Households able to afford monthly payments: 60.7%
> Median monthly housing costs: $1,687
> Median household income: $82,900
> Population change, 2010-2020: +1.2%
[recirclink id=931307]

6. Bakersfield, CA
> Households able to afford monthly payments: 60.6%
> Median monthly housing costs: $1,070
> Median household income: $53,800
> Population change, 2010-2020: +7.4%

5. Fresno, CA
> Households able to afford monthly payments: 60.2%
> Median monthly housing costs: $1,150
> Median household income: $58,000
> Population change, 2010-2020: +7.6%
[in-text-ad-2]

4. Urban Honolulu, HI
> Households able to afford monthly payments: 59.9%
> Median monthly housing costs: $1,844
> Median household income: $87,110
> Population change, 2010-2020: +1.1%

3. San Diego-Carlsbad, CA
> Households able to afford monthly payments: 58.3%
> Median monthly housing costs: $1,870
> Median household income: $83,000
> Population change, 2010-2020: +7.7%
[in-text-ad]

2. Miami-Fort Lauderdale-West Palm Beach, FL
> Households able to afford monthly payments: 56.5%
> Median monthly housing costs: $1,380
> Median household income: $59,600
> Population change, 2010-2020: +10.9%
[recirclink id=873328]

1. Los Angeles-Long Beach-Anaheim, CA
> Households able to afford monthly payments: 55.9%
> Median monthly housing costs: $1,780
> Median household income: $77,000
> Population change, 2010-2020: +2.2%
Methodology:
To determine the cities where the largest share of households cannot afford their homes, 24/7 Wall St. reviewed data on housing cost burdens from the Joint Center for Housing Studies of Harvard University’s “The State of the Nation’s Housing 2021” report. The 100 largest metropolitan areas in the U.S. were ranked based on the percentage of households paying 30% or more of their monthly income on housing costs. Supplemental data on poverty rate and median household income came from the U.S. Census Bureau’s 2019 American Community Survey.
Contact [email protected] for any questions or corrections.