The United States has some of the highest levels of income and wealth inequality in the world. U.S. Federal Reserve data shows that the wealthiest 10% of Americans control $93.8 trillion, more than double the $40.3 trillion in the hands of the remaining 90% of Americans.
The income and wealth divide only appears to be growing wider. A January 2020 report published by the Pew Research Center found that over the last four decades, income growth for the top 5% of families by earnings has far outpaced income growth for families in lower income strata.
In a nation as large as the U.S., varied levels of income inequality may be expected. While some parts have wide income gaps, other parts of the country are defined, at least in part, by their relative income equality.
Using data from the U.S. Census Bureau’s 2019 American Community Survey, 24/7 Wall St. identified the 50 U.S. metro areas with the smallest income gaps. Metropolitan areas are ranked by their Gini coefficient, a measure of income inequality based on the distribution of income across a population on a 0 to 1 scale — 0 representing perfect equality and 1 representing the highest possible level of inequality.
Among the metro areas on this list, Gini scores range from 0.377 to 0.426 — well below the national Gini coefficient of 0.481. The largest share of metro areas on this list are located in the West. However, Wisconsin is home to seven of the metro areas with the lowest levels of inequality, more than any other state.
Causes behind rising inequality are complex and varied. A report published by the National Bureau of Economic Research ties the rising disparity to a range of economic factors, including globalization, technological advancement, a stagnant minimum wage, and the decline of labor unions.
Click here to see America’s metros with the smallest income gaps
Click here to read our detailed methodology
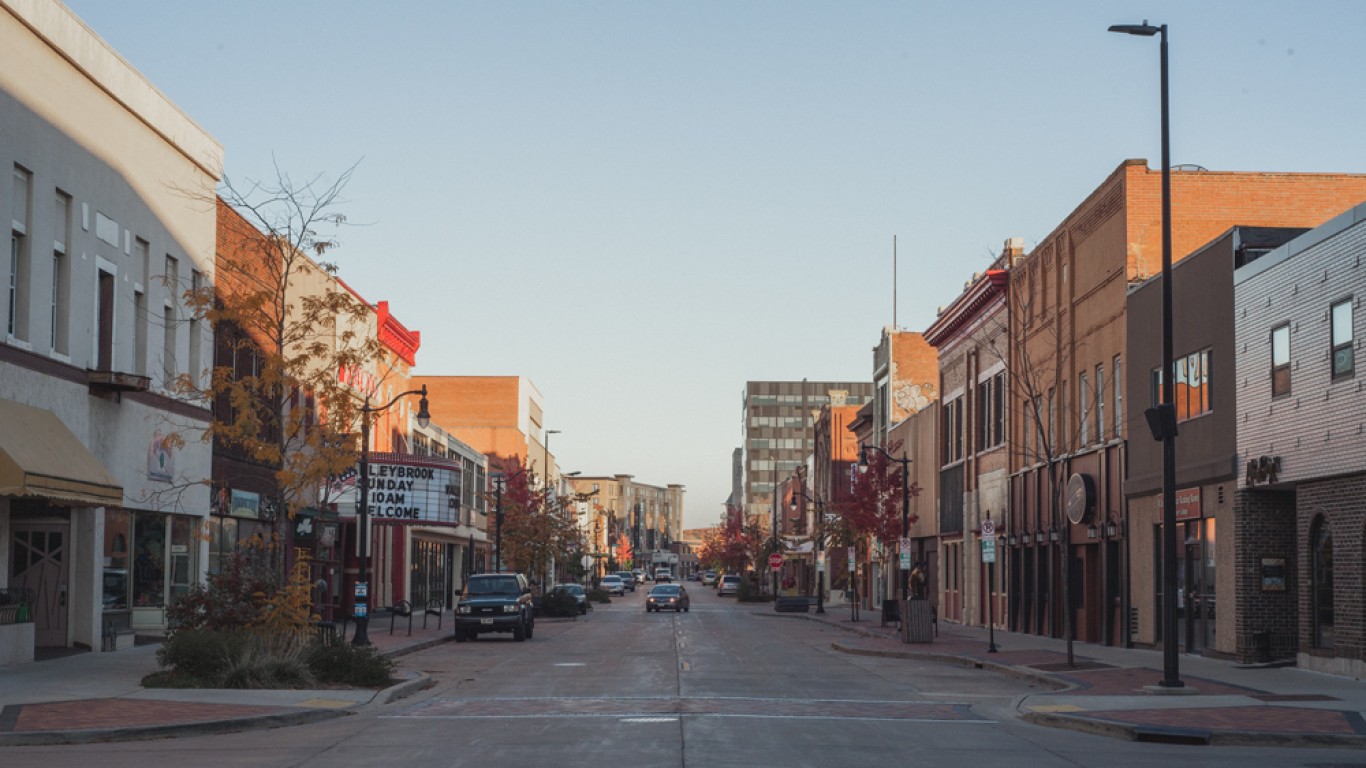
50. Eau Claire, WI
> Gini index: 0.426
> Avg. household income, top 20%: $189,541 — 185th lowest of 384 metros
> Avg. household income, bottom 20%: $17,526 — 64th highest of 384 metros
> Share of all income in Eau Claire that went to top 20%: 46.9% — 62nd lowest of 384 metros
> Share of all income in Eau Claire that went to bottom 20%: 4.3% — 21st highest of 384 metros (tied)
> Median household income: $63,460 — 123rd highest of 384 metros
[in-text-ad]

49. Salt Lake City, UT
> Gini index: 0.426
> Avg. household income, top 20%: $237,127 — 63rd highest of 384 metros
> Avg. household income, bottom 20%: $20,672 — 17th highest of 384 metros
> Share of all income in Salt Lake City that went to top 20%: 46.9% — 61st lowest of 384 metros
> Share of all income in Salt Lake City that went to bottom 20%: 4.1% — 56th highest of 384 metros
> Median household income: $80,196 — 27th highest of 384 metros
[recirclink id=887395]

48. Reading, PA
> Gini index: 0.426
> Avg. household income, top 20%: $195,466 — 173rd highest of 384 metros
> Avg. household income, bottom 20%: $16,728 — 87th highest of 384 metros
> Share of all income in Reading that went to top 20%: 46.1% — 41st lowest of 384 metros
> Share of all income in Reading that went to bottom 20%: 4.0% — 78th highest of 384 metros (tied)
> Median household income: $67,708 — 89th highest of 384 metros

47. Green Bay, WI
> Gini index: 0.424
> Avg. household income, top 20%: $186,479 — 169th lowest of 384 metros
> Avg. household income, bottom 20%: $15,753 — 125th highest of 384 metros
> Share of all income in Green Bay that went to top 20%: 46.1% — 38th lowest of 384 metros
> Share of all income in Green Bay that went to bottom 20%: 3.9% — 86th highest of 384 metros (tied)
> Median household income: $65,026 — 112th highest of 384 metros
[in-text-ad-2]

46. Elmira, NY
> Gini index: 0.424
> Avg. household income, top 20%: $168,383 — 81st lowest of 384 metros
> Avg. household income, bottom 20%: $12,694 — 129th lowest of 384 metros
> Share of all income in Elmira that went to top 20%: 46.0% — 33rd lowest of 384 metros
> Share of all income in Elmira that went to bottom 20%: 3.5% — 162nd lowest of 384 metros (tied)
> Median household income: $60,782 — 169th highest of 384 metros
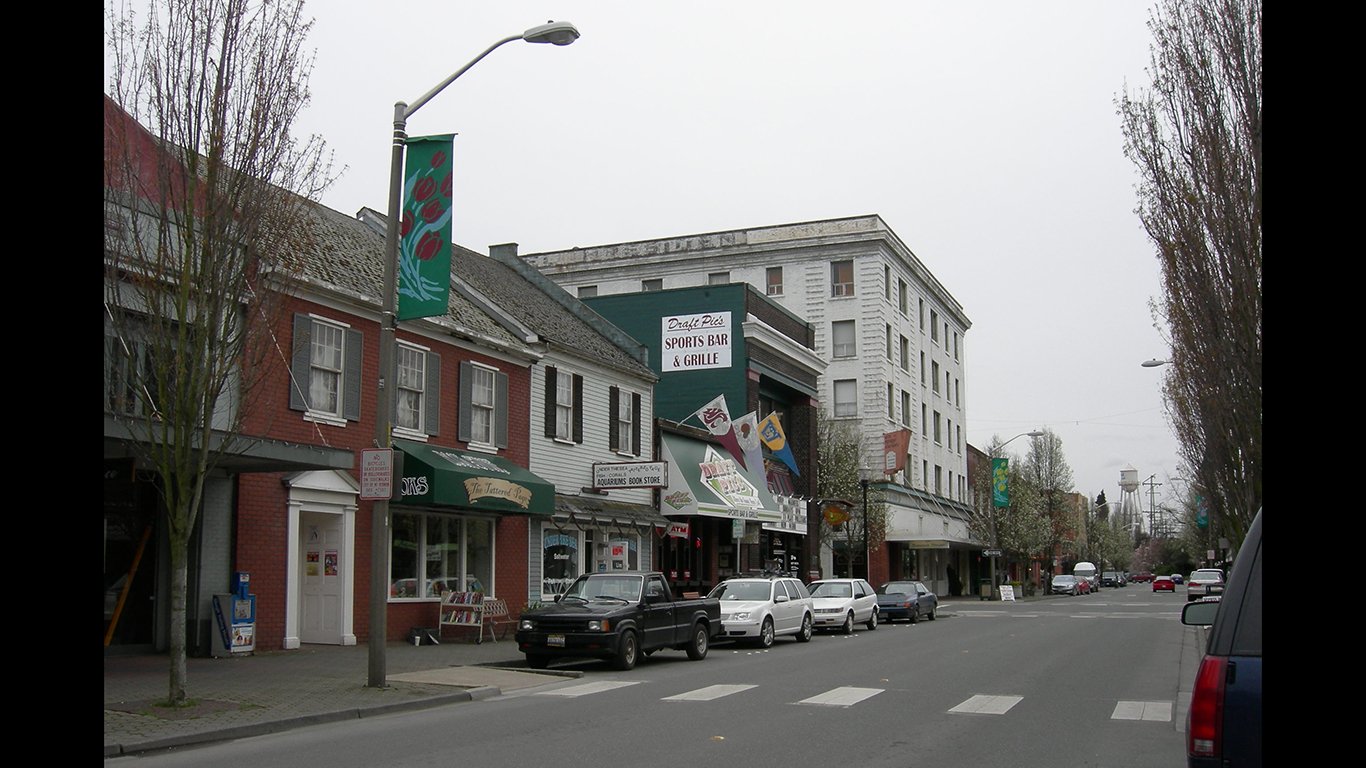
45. Mount Vernon-Anacortes, WA
> Gini index: 0.423
> Avg. household income, top 20%: $199,665 — 161st highest of 384 metros
> Avg. household income, bottom 20%: $18,204 — 48th highest of 384 metros
> Share of all income in Mount Vernon-Anacortes that went to top 20%: 46.5% — 51st lowest of 384 metros
> Share of all income in Mount Vernon-Anacortes that went to bottom 20%: 4.2% — 32nd highest of 384 metros (tied)
> Median household income: $67,175 — 94th highest of 384 metros
[in-text-ad]

44. Panama City, FL
> Gini index: 0.423
> Avg. household income, top 20%: $178,373 — 123rd lowest of 384 metros
> Avg. household income, bottom 20%: $14,640 — 162nd highest of 384 metros
> Share of all income in Panama City that went to top 20%: 46.9% — 60th lowest of 384 metros
> Share of all income in Panama City that went to bottom 20%: 3.8% — 96th highest of 384 metros (tied)
> Median household income: $59,450 — 190th lowest of 384 metros
[recirclink id=848904]
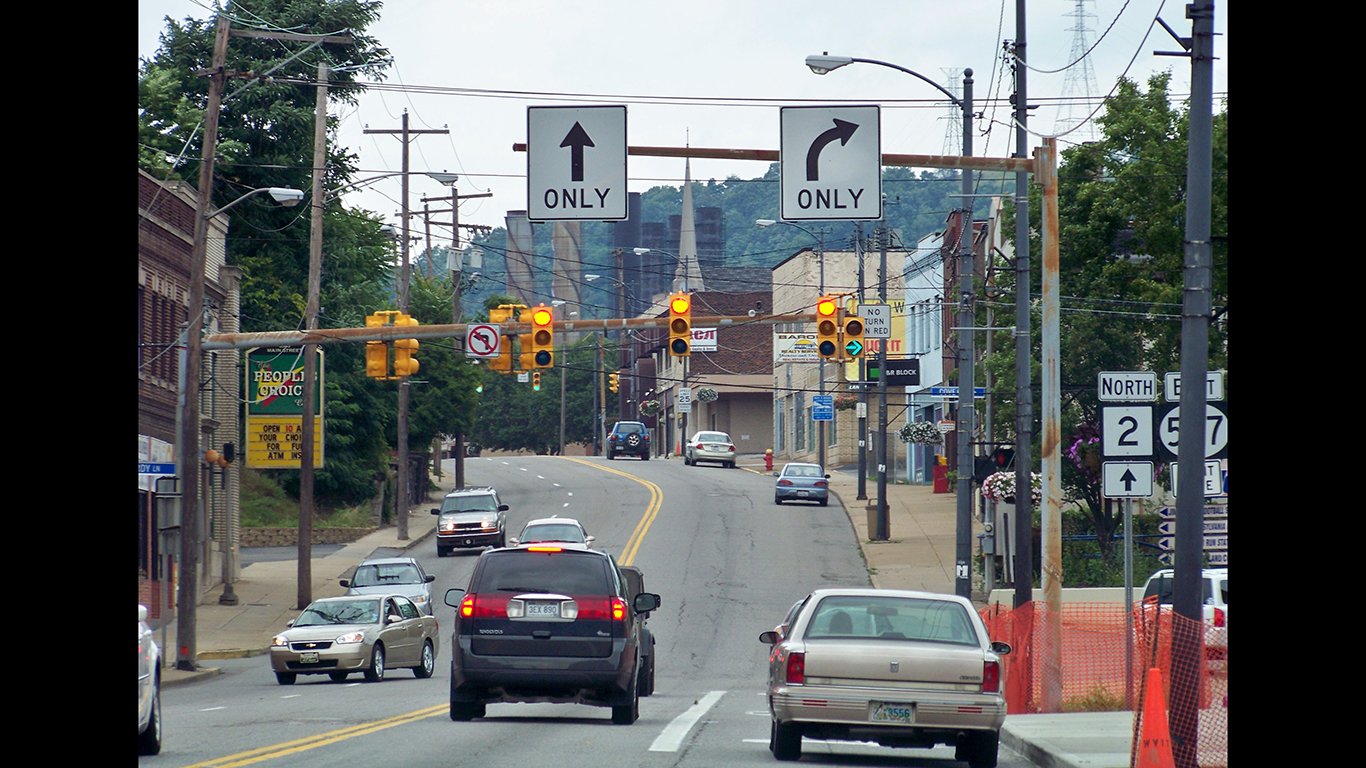
43. Weirton-Steubenville, WV-OH
> Gini index: 0.423
> Avg. household income, top 20%: $142,026 — 5th lowest of 384 metros
> Avg. household income, bottom 20%: $11,279 — 61st lowest of 384 metros
> Share of all income in Weirton-Steubenville that went to top 20%: 45.5% — 24th lowest of 384 metros (tied)
> Share of all income in Weirton-Steubenville that went to bottom 20%: 3.6% — 158th highest of 384 metros (tied)
> Median household income: $49,510 — 49th lowest of 384 metros

42. Modesto, CA
> Gini index: 0.422
> Avg. household income, top 20%: $183,901 — 157th lowest of 384 metros
> Avg. household income, bottom 20%: $15,852 — 121st highest of 384 metros
> Share of all income in Modesto that went to top 20%: 46.1% — 36th lowest of 384 metros (tied)
> Share of all income in Modesto that went to bottom 20%: 4.0% — 71st highest of 384 metros (tied)
> Median household income: $63,037 — 128th highest of 384 metros
[in-text-ad-2]

41. Logan, UT-ID
> Gini index: 0.422
> Avg. household income, top 20%: $175,041 — 110th lowest of 384 metros
> Avg. household income, bottom 20%: $15,109 — 141st highest of 384 metros
> Share of all income in Logan that went to top 20%: 46.2% — 43rd lowest of 384 metros
> Share of all income in Logan that went to bottom 20%: 4.0% — 69th highest of 384 metros (tied)
> Median household income: $61,467 — 153rd highest of 384 metros

40. Lake Havasu City-Kingman, AZ
> Gini index: 0.421
> Avg. household income, top 20%: $148,248 — 19th lowest of 384 metros
> Avg. household income, bottom 20%: $14,124 — 183rd highest of 384 metros
> Share of all income in Lake Havasu City-Kingman that went to top 20%: 46.7% — 57th lowest of 384 metros
> Share of all income in Lake Havasu City-Kingman that went to bottom 20%: 4.4% — 17th highest of 384 metros (tied)
> Median household income: $50,179 — 62nd lowest of 384 metros
[in-text-ad]
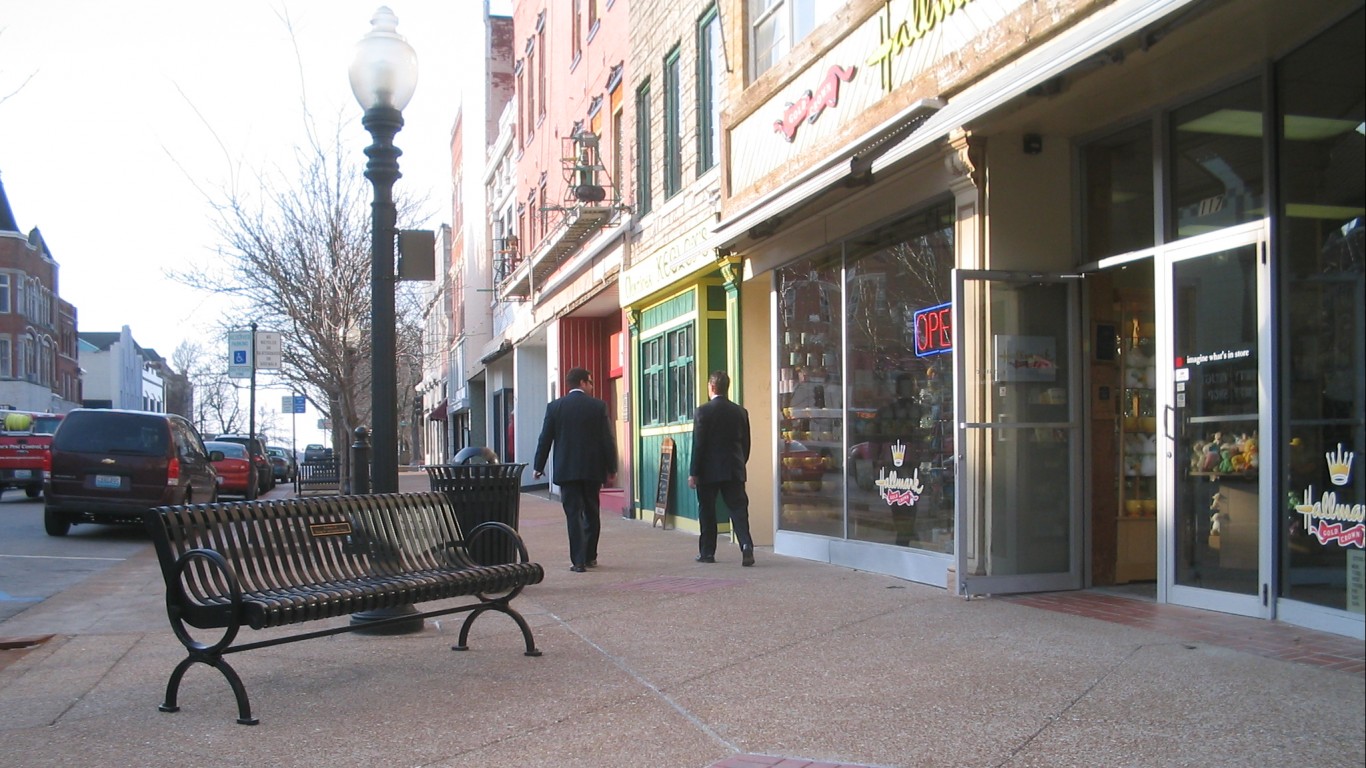
39. Jefferson City, MO
> Gini index: 0.421
> Avg. household income, top 20%: $172,302 — 97th lowest of 384 metros
> Avg. household income, bottom 20%: $14,985 — 146th highest of 384 metros
> Share of all income in Jefferson City that went to top 20%: 46.1% — 39th lowest of 384 metros
> Share of all income in Jefferson City that went to bottom 20%: 4.0% — 63rd highest of 384 metros (tied)
> Median household income: $60,786 — 168th highest of 384 metros
[recirclink id=488561]

38. Odessa, TX
> Gini index: 0.421
> Avg. household income, top 20%: $192,448 — 188th highest of 384 metros
> Avg. household income, bottom 20%: $15,881 — 117th highest of 384 metros
> Share of all income in Odessa that went to top 20%: 45.5% — 24th lowest of 384 metros (tied)
> Share of all income in Odessa that went to bottom 20%: 3.8% — 117th highest of 384 metros (tied)
> Median household income: $67,205 — 93rd highest of 384 metros

37. Manchester-Nashua, NH
> Gini index: 0.421
> Avg. household income, top 20%: $241,381 — 53rd highest of 384 metros
> Avg. household income, bottom 20%: $20,976 — 14th highest of 384 metros
> Share of all income in Manchester-Nashua that went to top 20%: 46.0% — 34th lowest of 384 metros (tied)
> Share of all income in Manchester-Nashua that went to bottom 20%: 4.0% — 67th highest of 384 metros (tied)
> Median household income: $83,626 — 20th highest of 384 metros
[in-text-ad-2]

36. Cedar Rapids, IA
> Gini index: 0.420
> Avg. household income, top 20%: $183,605 — 155th lowest of 384 metros
> Avg. household income, bottom 20%: $16,471 — 100th highest of 384 metros
> Share of all income in Cedar Rapids that went to top 20%: 46.1% — 36th lowest of 384 metros (tied)
> Share of all income in Cedar Rapids that went to bottom 20%: 4.2% — 44th highest of 384 metros (tied)
> Median household income: $64,088 — 116th highest of 384 metros
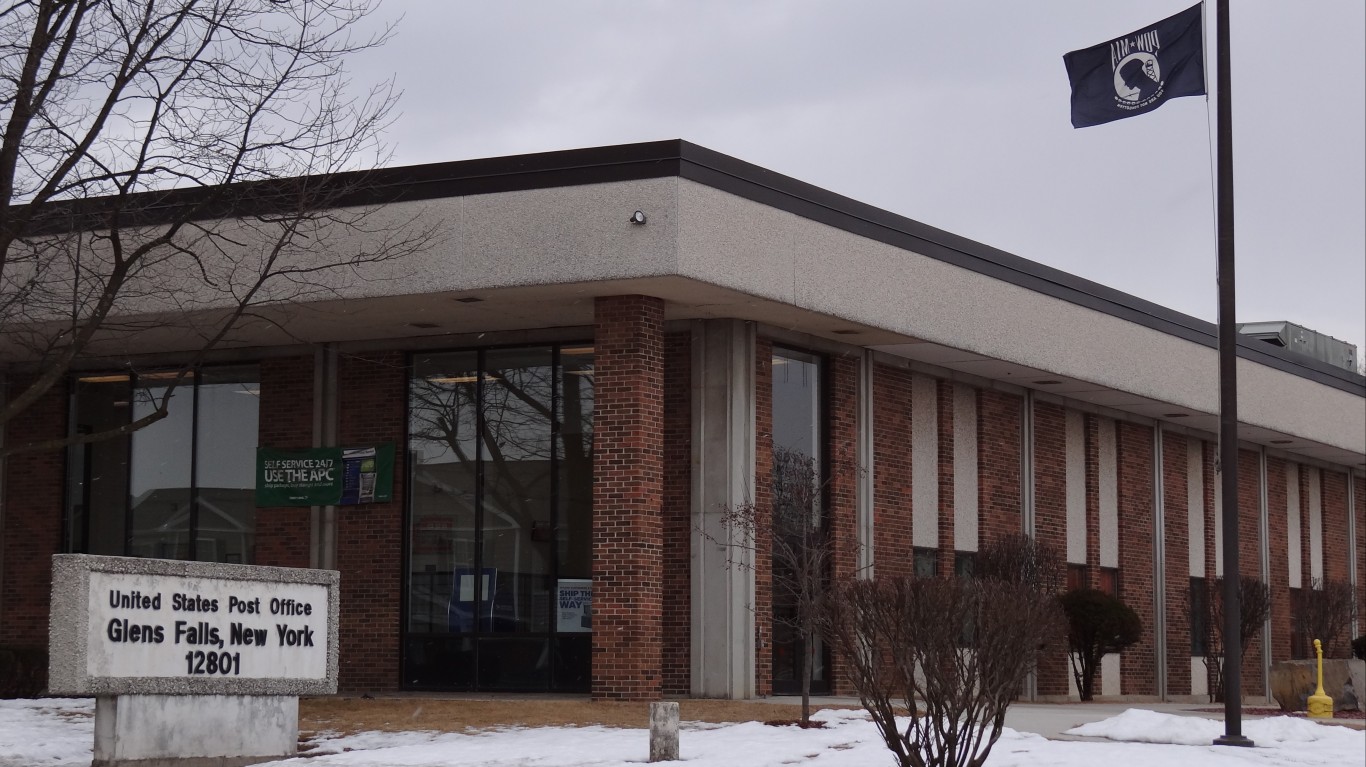
35. Glens Falls, NY
> Gini index: 0.420
> Avg. household income, top 20%: $180,197 — 138th lowest of 384 metros
> Avg. household income, bottom 20%: $16,696 — 88th highest of 384 metros
> Share of all income in Glens Falls that went to top 20%: 46.3% — 45th lowest of 384 metros (tied)
> Share of all income in Glens Falls that went to bottom 20%: 4.3% — 29th highest of 384 metros
> Median household income: $61,255 — 158th highest of 384 metros
[in-text-ad]

34. Kennewick-Richland, WA
> Gini index: 0.420
> Avg. household income, top 20%: $203,657 — 149th highest of 384 metros
> Avg. household income, bottom 20%: $18,564 — 45th highest of 384 metros
> Share of all income in Kennewick-Richland that went to top 20%: 45.9% — 32nd lowest of 384 metros
> Share of all income in Kennewick-Richland that went to bottom 20%: 4.2% — 37th highest of 384 metros (tied)
> Median household income: $68,283 — 86th highest of 384 metros
[recirclink id=920281]
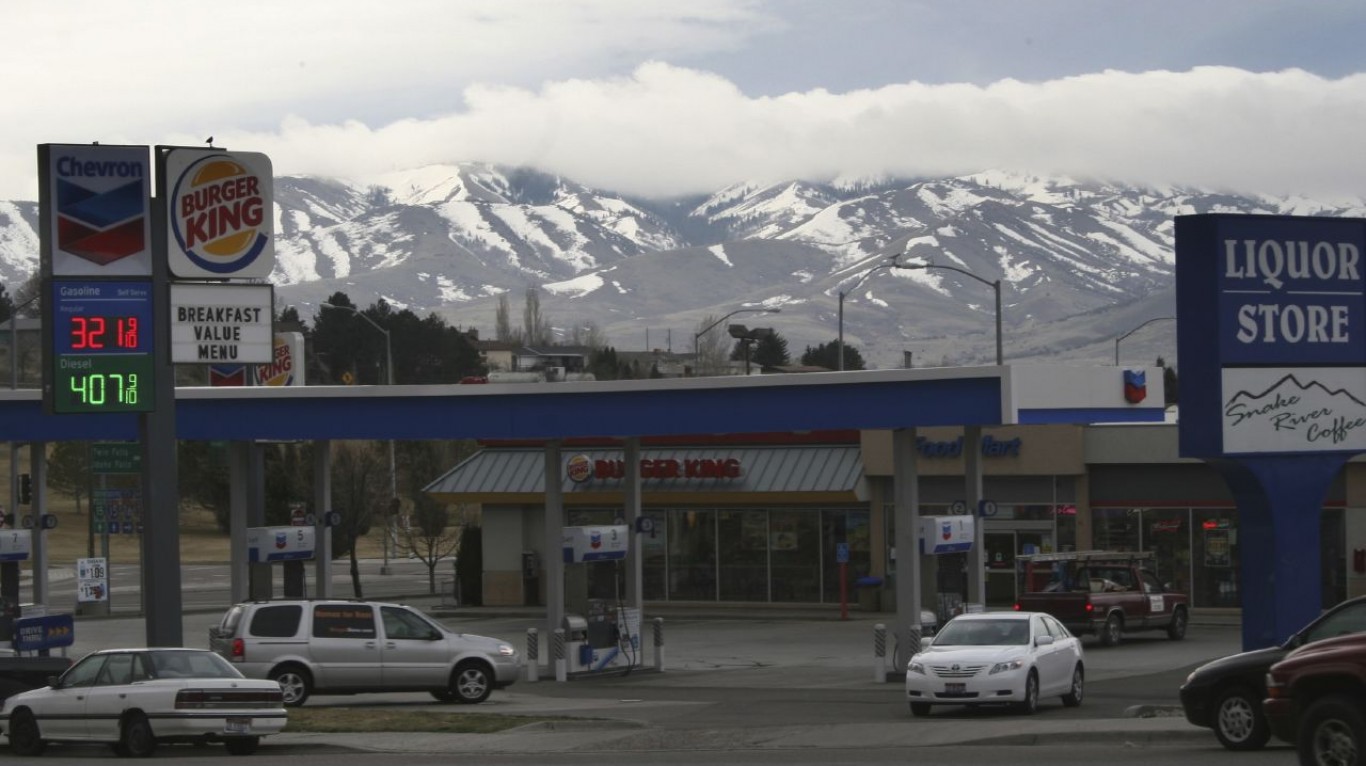
33. Pocatello, ID
> Gini index: 0.420
> Avg. household income, top 20%: $148,759 — 21st lowest of 384 metros
> Avg. household income, bottom 20%: $13,108 — 151st lowest of 384 metros
> Share of all income in Pocatello that went to top 20%: 45.6% — 27th lowest of 384 metros
> Share of all income in Pocatello that went to bottom 20%: 4.0% — 59th highest of 384 metros (tied)
> Median household income: $51,612 — 83rd lowest of 384 metros

32. Bellingham, WA
> Gini index: 0.419
> Avg. household income, top 20%: $194,355 — 179th highest of 384 metros
> Avg. household income, bottom 20%: $16,432 — 102nd highest of 384 metros
> Share of all income in Bellingham that went to top 20%: 45.8% — 30th lowest of 384 metros (tied)
> Share of all income in Bellingham that went to bottom 20%: 3.9% — 93rd highest of 384 metros (tied)
> Median household income: $69,372 — 78th highest of 384 metros
[in-text-ad-2]

31. York-Hanover, PA
> Gini index: 0.419
> Avg. household income, top 20%: $196,874 — 169th highest of 384 metros
> Avg. household income, bottom 20%: $17,397 — 68th highest of 384 metros
> Share of all income in York-Hanover that went to top 20%: 45.8% — 30th lowest of 384 metros (tied)
> Share of all income in York-Hanover that went to bottom 20%: 4.1% — 57th highest of 384 metros (tied)
> Median household income: $69,172 — 81st highest of 384 metros

30. Olympia-Lacey-Tumwater, WA
> Gini index: 0.419
> Avg. household income, top 20%: $213,935 — 106th highest of 384 metros
> Avg. household income, bottom 20%: $17,623 — 61st highest of 384 metros
> Share of all income in Olympia-Lacey-Tumwater that went to top 20%: 45.6% — 26th lowest of 384 metros
> Share of all income in Olympia-Lacey-Tumwater that went to bottom 20%: 3.8% — 117th highest of 384 metros (tied)
> Median household income: $78,512 — 34th highest of 384 metros
[in-text-ad]
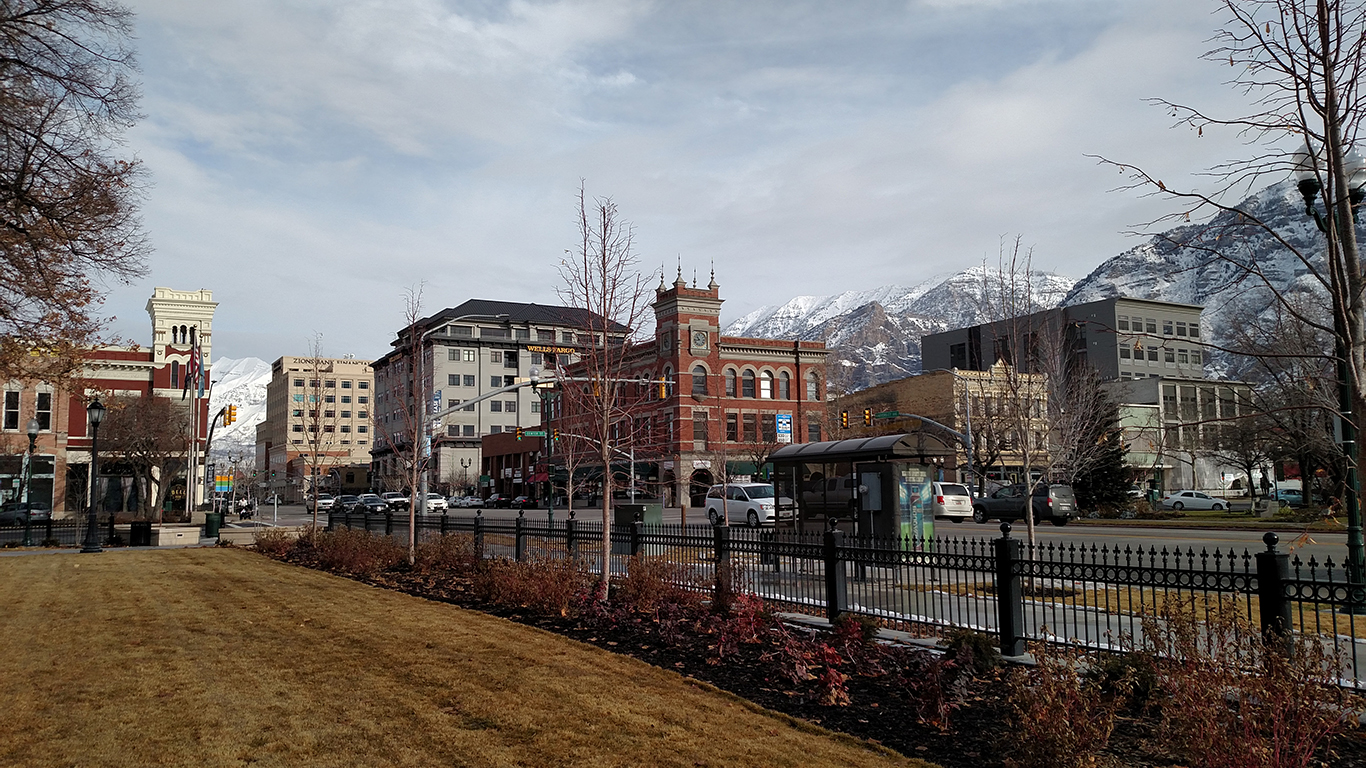
29. Provo-Orem, UT
> Gini index: 0.417
> Avg. household income, top 20%: $227,653 — 74th highest of 384 metros
> Avg. household income, bottom 20%: $21,648 — 11th highest of 384 metros
> Share of all income in Provo-Orem that went to top 20%: 46.1% — 40th lowest of 384 metros
> Share of all income in Provo-Orem that went to bottom 20%: 4.4% — 19th highest of 384 metros
> Median household income: $79,152 — 32nd highest of 384 metros
[recirclink id=970377]

28. Gettysburg, PA
> Gini index: 0.417
> Avg. household income, top 20%: $194,785 — 177th highest of 384 metros
> Avg. household income, bottom 20%: $18,795 — 38th highest of 384 metros
> Share of all income in Gettysburg that went to top 20%: 46.2% — 44th lowest of 384 metros
> Share of all income in Gettysburg that went to bottom 20%: 4.5% — 16th highest of 384 metros
> Median household income: $67,715 — 88th highest of 384 metros

27. Watertown-Fort Drum, NY
> Gini index: 0.417
> Avg. household income, top 20%: $153,015 — 27th lowest of 384 metros
> Avg. household income, bottom 20%: $13,332 — 157th lowest of 384 metros
> Share of all income in Watertown-Fort Drum that went to top 20%: 45.4% — 23rd lowest of 384 metros
> Share of all income in Watertown-Fort Drum that went to bottom 20%: 4.0% — 76th highest of 384 metros (tied)
> Median household income: $53,917 — 114th lowest of 384 metros
[in-text-ad-2]
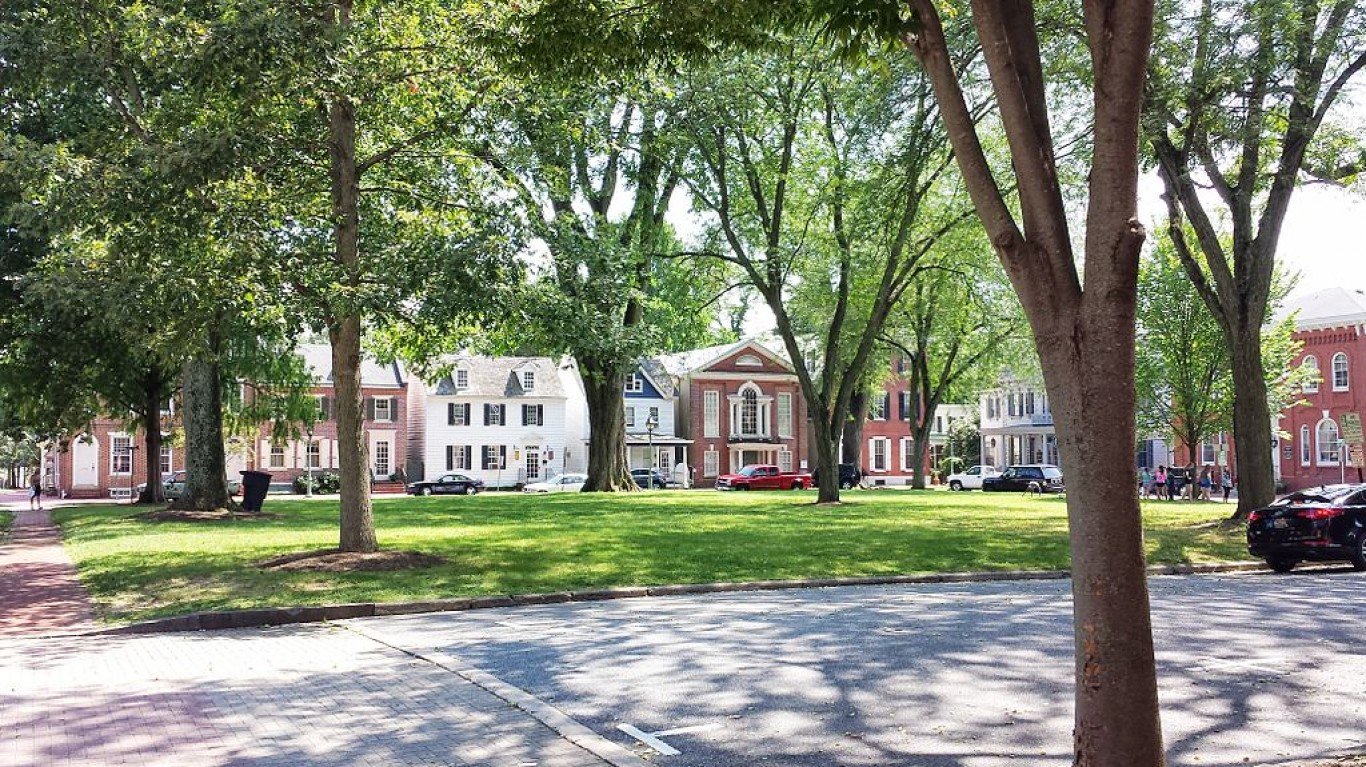
26. Dover, DE
> Gini index: 0.416
> Avg. household income, top 20%: $162,096 — 54th lowest of 384 metros
> Avg. household income, bottom 20%: $13,115 — 152nd lowest of 384 metros
> Share of all income in Dover that went to top 20%: 45.2% — 20th lowest of 384 metros
> Share of all income in Dover that went to bottom 20%: 3.7% — 143rd highest of 384 metros (tied)
> Median household income: $58,001 — 175th lowest of 384 metros

25. Wausau-Weston, WI
> Gini index: 0.415
> Avg. household income, top 20%: $180,897 — 140th lowest of 384 metros
> Avg. household income, bottom 20%: $17,973 — 52nd highest of 384 metros
> Share of all income in Wausau-Weston that went to top 20%: 45.7% — 28th lowest of 384 metros
> Share of all income in Wausau-Weston that went to bottom 20%: 4.5% — 13th highest of 384 metros
> Median household income: $65,094 — 110th highest of 384 metros
[in-text-ad]
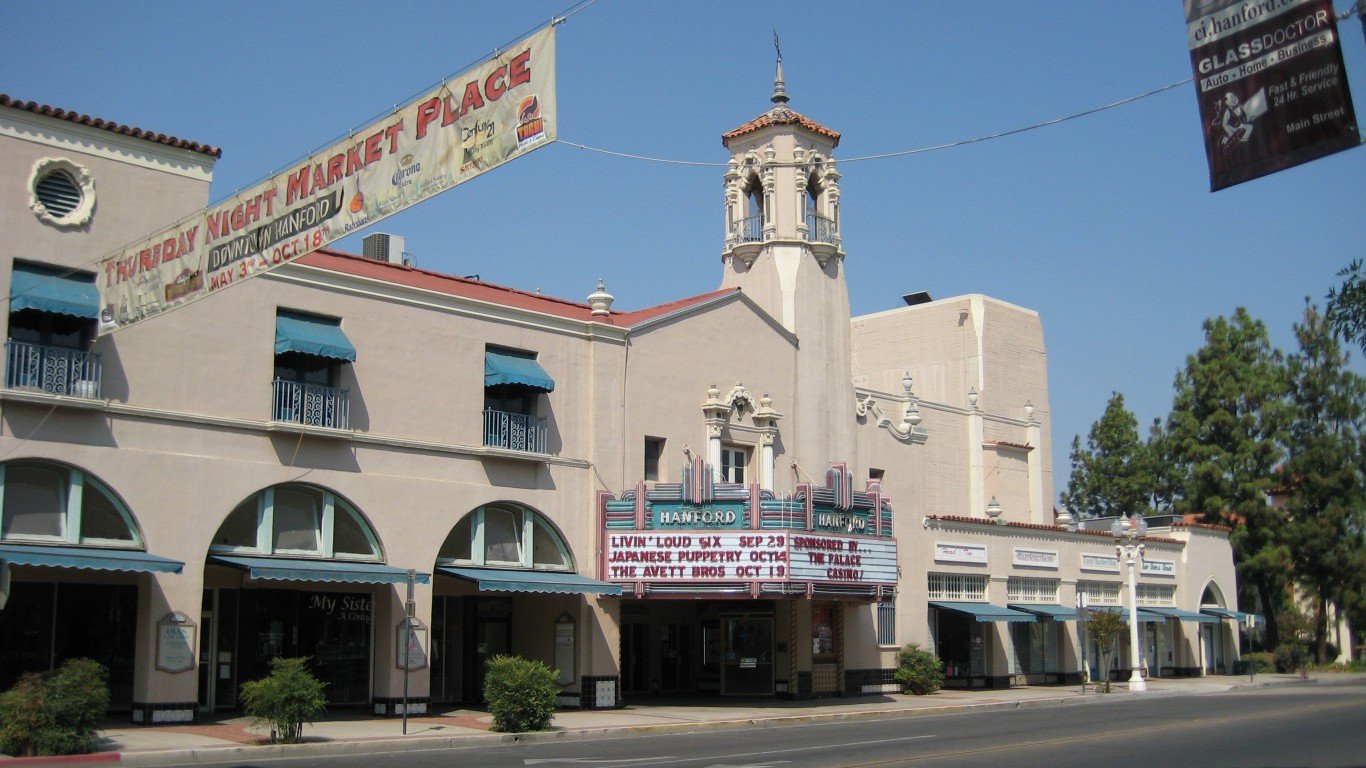
24. Hanford-Corcoran, CA
> Gini index: 0.414
> Avg. household income, top 20%: $166,693 — 70th lowest of 384 metros
> Avg. household income, bottom 20%: $15,760 — 123rd highest of 384 metros
> Share of all income in Hanford-Corcoran that went to top 20%: 46.0% — 34th lowest of 384 metros (tied)
> Share of all income in Hanford-Corcoran that went to bottom 20%: 4.3% — 21st highest of 384 metros (tied)
> Median household income: $58,453 — 181st lowest of 384 metros
[recirclink id=887395]

23. Vallejo, CA
> Gini index: 0.414
> Avg. household income, top 20%: $239,436 — 57th highest of 384 metros
> Avg. household income, bottom 20%: $20,892 — 16th highest of 384 metros
> Share of all income in Vallejo that went to top 20%: 45.4% — 22nd lowest of 384 metros
> Share of all income in Vallejo that went to bottom 20%: 4.0% — 71st highest of 384 metros (tied)
> Median household income: $86,652 — 14th highest of 384 metros

22. St. Cloud, MN
> Gini index: 0.414
> Avg. household income, top 20%: $183,258 — 153rd lowest of 384 metros
> Avg. household income, bottom 20%: $17,336 — 70th highest of 384 metros
> Share of all income in St. Cloud that went to top 20%: 45.7% — 29th lowest of 384 metros
> Share of all income in St. Cloud that went to bottom 20%: 4.3% — 23rd highest of 384 metros
> Median household income: $66,076 — 101st highest of 384 metros
[in-text-ad-2]

21. Sioux City, IA-NE-SD
> Gini index: 0.414
> Avg. household income, top 20%: $165,881 — 68th lowest of 384 metros
> Avg. household income, bottom 20%: $15,482 — 134th highest of 384 metros
> Share of all income in Sioux City that went to top 20%: 44.8% — 16th lowest of 384 metros
> Share of all income in Sioux City that went to bottom 20%: 4.2% — 40th highest of 384 metros (tied)
> Median household income: $60,132 — 186th highest of 384 metros

20. Casper, WY
> Gini index: 0.411
> Avg. household income, top 20%: $179,231 — 128th lowest of 384 metros
> Avg. household income, bottom 20%: $16,809 — 83rd highest of 384 metros
> Share of all income in Casper that went to top 20%: 45.3% — 21st lowest of 384 metros
> Share of all income in Casper that went to bottom 20%: 4.3% — 30th highest of 384 metros (tied)
> Median household income: $65,034 — 111th highest of 384 metros
[in-text-ad]

19. Sheboygan, WI
> Gini index: 0.410
> Avg. household income, top 20%: $179,857 — 134th lowest of 384 metros
> Avg. household income, bottom 20%: $19,417 — 27th highest of 384 metros
> Share of all income in Sheboygan that went to top 20%: 46.3% — 48th lowest of 384 metros
> Share of all income in Sheboygan that went to bottom 20%: 5.0% — 4th highest of 384 metros
> Median household income: $60,706 — 173rd highest of 384 metros (tied)
[recirclink id=848904]
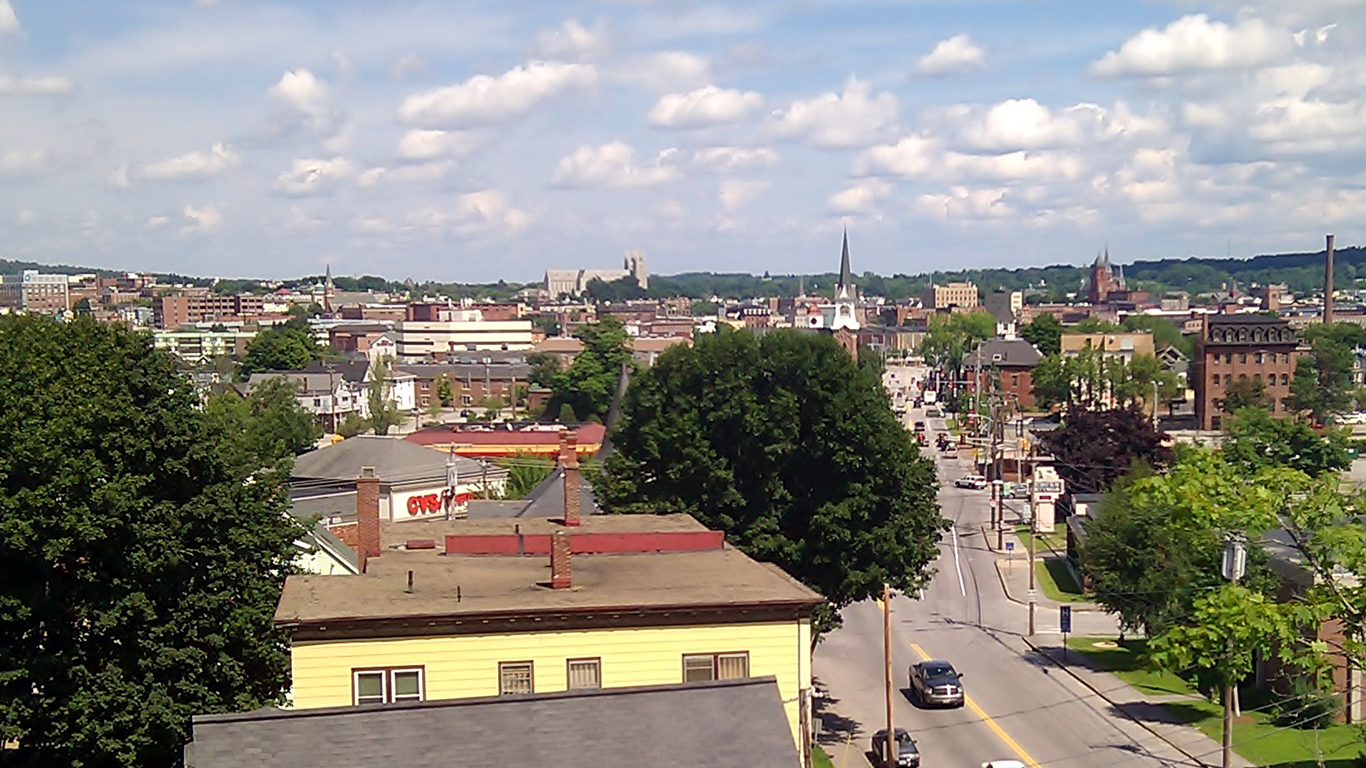
18. Lewiston-Auburn, ME
> Gini index: 0.409
> Avg. household income, top 20%: $174,869 — 108th lowest of 384 metros
> Avg. household income, bottom 20%: $17,783 — 57th highest of 384 metros
> Share of all income in Lewiston-Auburn that went to top 20%: 45.2% — 19th lowest of 384 metros
> Share of all income in Lewiston-Auburn that went to bottom 20%: 4.6% — 11th highest of 384 metros
> Median household income: $63,813 — 118th highest of 384 metros

17. Salem, OR
> Gini index: 0.409
> Avg. household income, top 20%: $179,967 — 136th lowest of 384 metros
> Avg. household income, bottom 20%: $16,555 — 94th highest of 384 metros
> Share of all income in Salem that went to top 20%: 44.9% — 18th lowest of 384 metros
> Share of all income in Salem that went to bottom 20%: 4.1% — 48th highest of 384 metros
> Median household income: $65,689 — 105th highest of 384 metros
[in-text-ad-2]
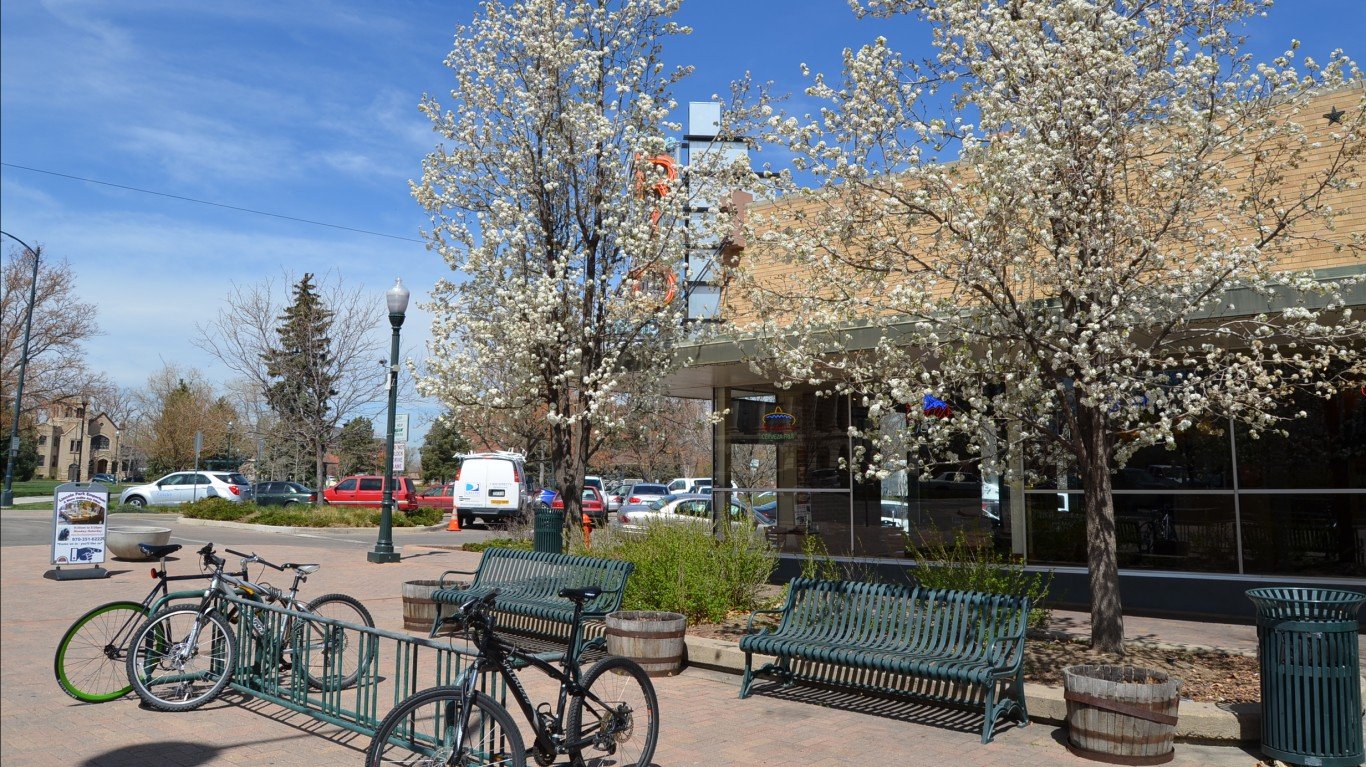
16. Greeley, CO
> Gini index: 0.409
> Avg. household income, top 20%: $213,357 — 111th highest of 384 metros
> Avg. household income, bottom 20%: $19,839 — 22nd highest of 384 metros
> Share of all income in Greeley that went to top 20%: 44.7% — 15th lowest of 384 metros
> Share of all income in Greeley that went to bottom 20%: 4.2% — 44th highest of 384 metros (tied)
> Median household income: $78,615 — 33rd highest of 384 metros
15. Janesville-Beloit, WI
> Gini index: 0.403
> Avg. household income, top 20%: $160,911 — 51st lowest of 384 metros
> Avg. household income, bottom 20%: $14,959 — 149th highest of 384 metros
> Share of all income in Janesville-Beloit that went to top 20%: 44.2% — 9th lowest of 384 metros
> Share of all income in Janesville-Beloit that went to bottom 20%: 4.1% — 51st highest of 384 metros (tied)
> Median household income: $61,243 — 159th highest of 384 metros
[in-text-ad]

14. Appleton, WI
> Gini index: 0.403
> Avg. household income, top 20%: $187,136 — 170th lowest of 384 metros
> Avg. household income, bottom 20%: $19,059 — 33rd highest of 384 metros
> Share of all income in Appleton that went to top 20%: 44.8% — 17th lowest of 384 metros
> Share of all income in Appleton that went to bottom 20%: 4.6% — 12th highest of 384 metros
> Median household income: $68,335 — 84th highest of 384 metros
[recirclink id=920281]
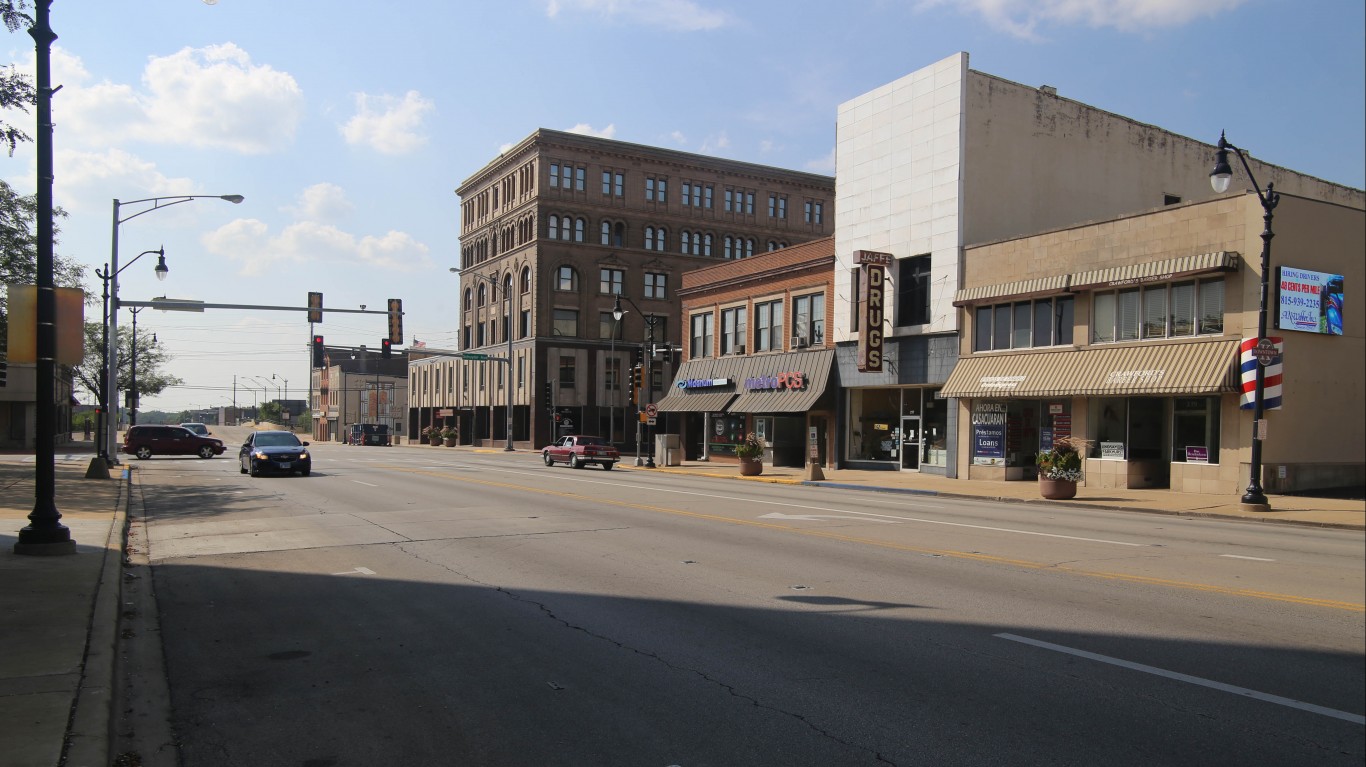
13. Kankakee, IL
> Gini index: 0.400
> Avg. household income, top 20%: $160,426 — 49th lowest of 384 metros
> Avg. household income, bottom 20%: $14,915 — 151st highest of 384 metros
> Share of all income in Kankakee that went to top 20%: 43.5% — 4th lowest of 384 metros
> Share of all income in Kankakee that went to bottom 20%: 4.1% — 57th highest of 384 metros (tied)
> Median household income: $60,923 — 167th highest of 384 metros

12. Bremerton-Silverdale-Port Orchard, WA
> Gini index: 0.399
> Avg. household income, top 20%: $217,164 — 100th highest of 384 metros
> Avg. household income, bottom 20%: $21,783 — 9th highest of 384 metros
> Share of all income in Bremerton-Silverdale-Port Orchard that went to top 20%: 44.6% — 14th lowest of 384 metros
> Share of all income in Bremerton-Silverdale-Port Orchard that went to bottom 20%: 4.5% — 15th highest of 384 metros
> Median household income: $79,624 — 29th highest of 384 metros
[in-text-ad-2]

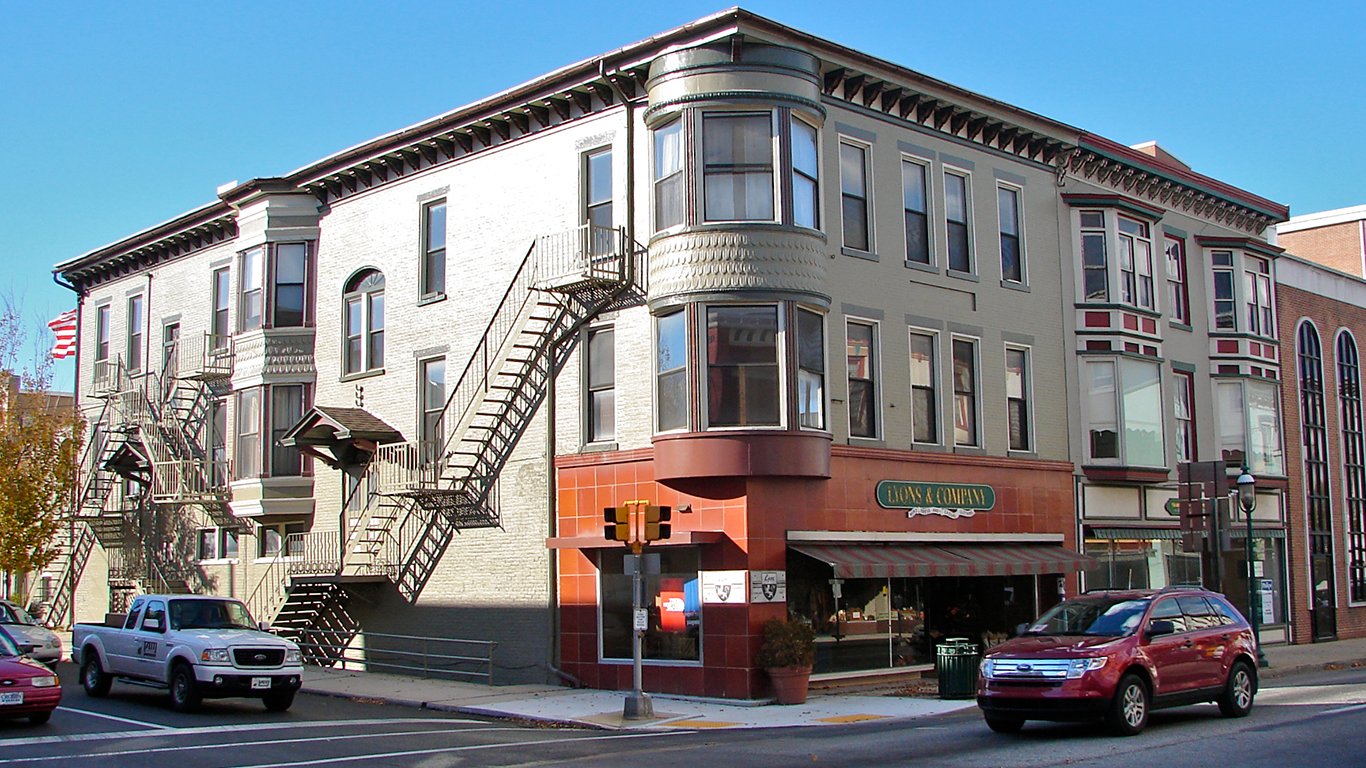
11. Lebanon, PA
> Gini index: 0.399
> Avg. household income, top 20%: $168,390 — 82nd lowest of 384 metros
> Avg. household income, bottom 20%: $17,562 — 62nd highest of 384 metros
> Share of all income in Lebanon that went to top 20%: 44.4% — 11th lowest of 384 metros
> Share of all income in Lebanon that went to bottom 20%: 4.6% — 9th highest of 384 metros
> Median household income: $61,204 — 161st highest of 384 metros
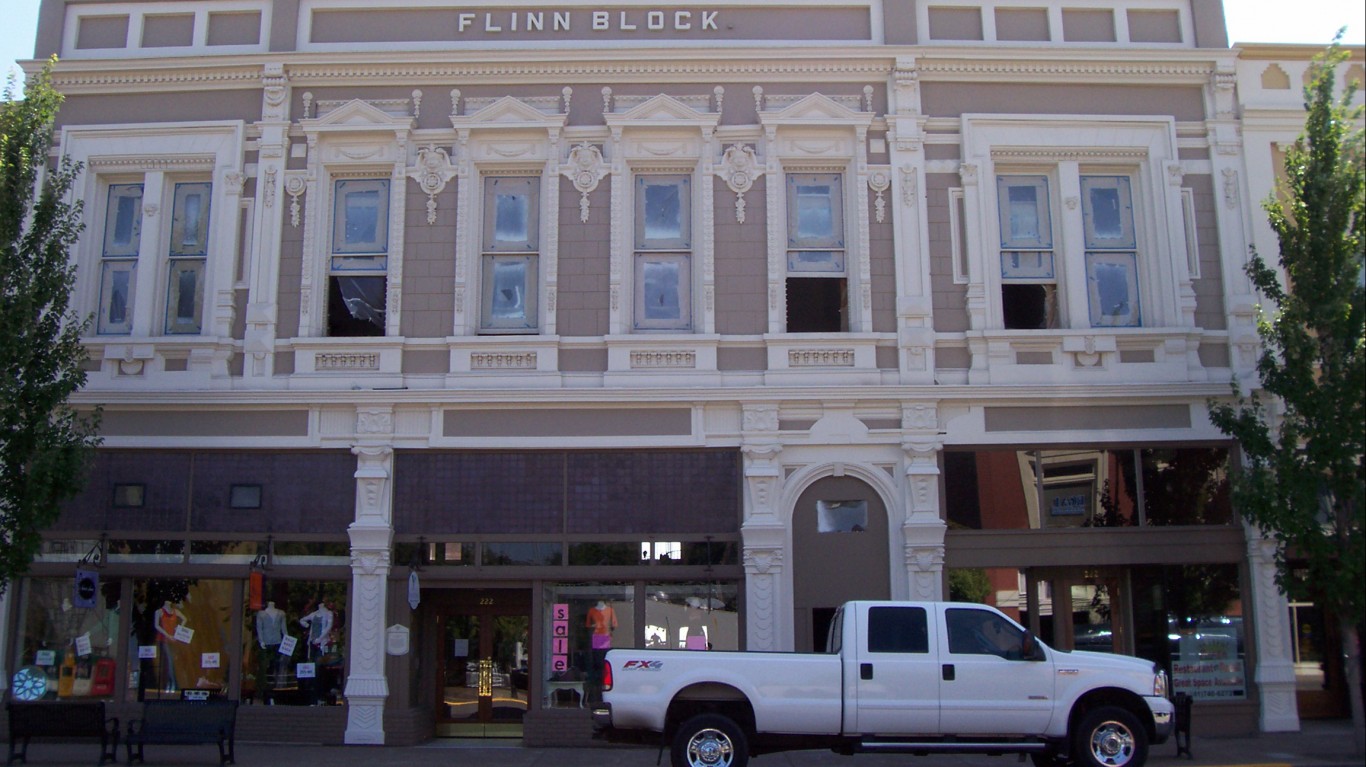
10. Albany-Lebanon, OR
> Gini index: 0.398
> Avg. household income, top 20%: $163,497 — 57th lowest of 384 metros
> Avg. household income, bottom 20%: $17,312 — 72nd highest of 384 metros
> Share of all income in Albany-Lebanon that went to top 20%: 43.8% — 7th lowest of 384 metros
> Share of all income in Albany-Lebanon that went to bottom 20%: 4.6% — 8th highest of 384 metros
> Median household income: $61,488 — 152nd highest of 384 metros
[in-text-ad]
9. Chambersburg-Waynesboro, PA
> Gini index: 0.397
> Avg. household income, top 20%: $170,899 — 91st lowest of 384 metros
> Avg. household income, bottom 20%: $19,443 — 26th highest of 384 metros
> Share of all income in Chambersburg-Waynesboro that went to top 20%: 44.5% — 13th lowest of 384 metros
> Share of all income in Chambersburg-Waynesboro that went to bottom 20%: 5.1% — the highest of 384 metros
> Median household income: $62,484 — 137th highest of 384 metros
[recirclink id=920281]
8. Winchester, VA-WV
> Gini index: 0.397
> Avg. household income, top 20%: $201,496 — 154th highest of 384 metros
> Avg. household income, bottom 20%: $20,256 — 20th highest of 384 metros
> Share of all income in Winchester that went to top 20%: 44.3% — 10th lowest of 384 metros
> Share of all income in Winchester that went to bottom 20%: 4.4% — 17th highest of 384 metros (tied)
> Median household income: $76,583 — 41st highest of 384 metros
7. Fond du Lac, WI
> Gini index: 0.395
> Avg. household income, top 20%: $175,980 — 113th lowest of 384 metros
> Avg. household income, bottom 20%: $18,975 — 34th highest of 384 metros
> Share of all income in Fond du Lac that went to top 20%: 43.9% — 8th lowest of 384 metros
> Share of all income in Fond du Lac that went to bottom 20%: 4.7% — 6th highest of 384 metros
> Median household income: $65,329 — 108th highest of 384 metros
[in-text-ad-2]

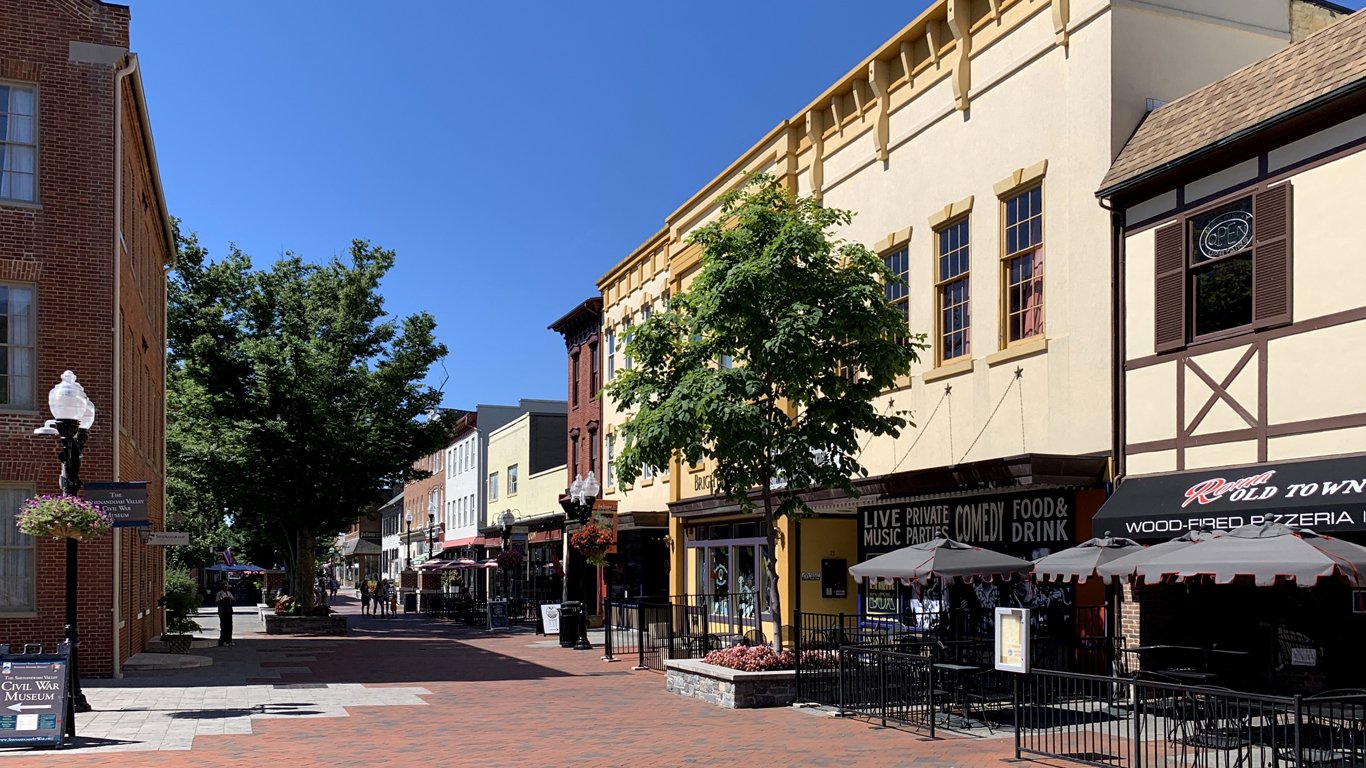
6. Staunton, VA
> Gini index: 0.393
> Avg. household income, top 20%: $155,594 — 35th lowest of 384 metros
> Avg. household income, bottom 20%: $16,485 — 99th highest of 384 metros
> Share of all income in Staunton that went to top 20%: 43.6% — 5th lowest of 384 metros
> Share of all income in Staunton that went to bottom 20%: 4.6% — 10th highest of 384 metros
> Median household income: $57,844 — 172nd lowest of 384 metros

5. Ogden-Clearfield, UT
> Gini index: 0.392
> Avg. household income, top 20%: $213,300 — 112th highest of 384 metros
> Avg. household income, bottom 20%: $23,759 — 3rd highest of 384 metros
> Share of all income in Ogden-Clearfield that went to top 20%: 44.4% — 12th lowest of 384 metros
> Share of all income in Ogden-Clearfield that went to bottom 20%: 4.9% — 5th highest of 384 metros
> Median household income: $79,251 — 31st highest of 384 metros
[in-text-ad]

4. Coeur d’Alene, ID
> Gini index: 0.390
> Avg. household income, top 20%: $163,508 — 58th lowest of 384 metros
> Avg. household income, bottom 20%: $18,870 — 36th highest of 384 metros
> Share of all income in Coeur d’Alene that went to top 20%: 43.8% — 6th lowest of 384 metros
> Share of all income in Coeur d’Alene that went to bottom 20%: 5.1% — 2nd highest of 384 metros
> Median household income: $62,579 — 134th highest of 384 metros
[recirclink id=970377]
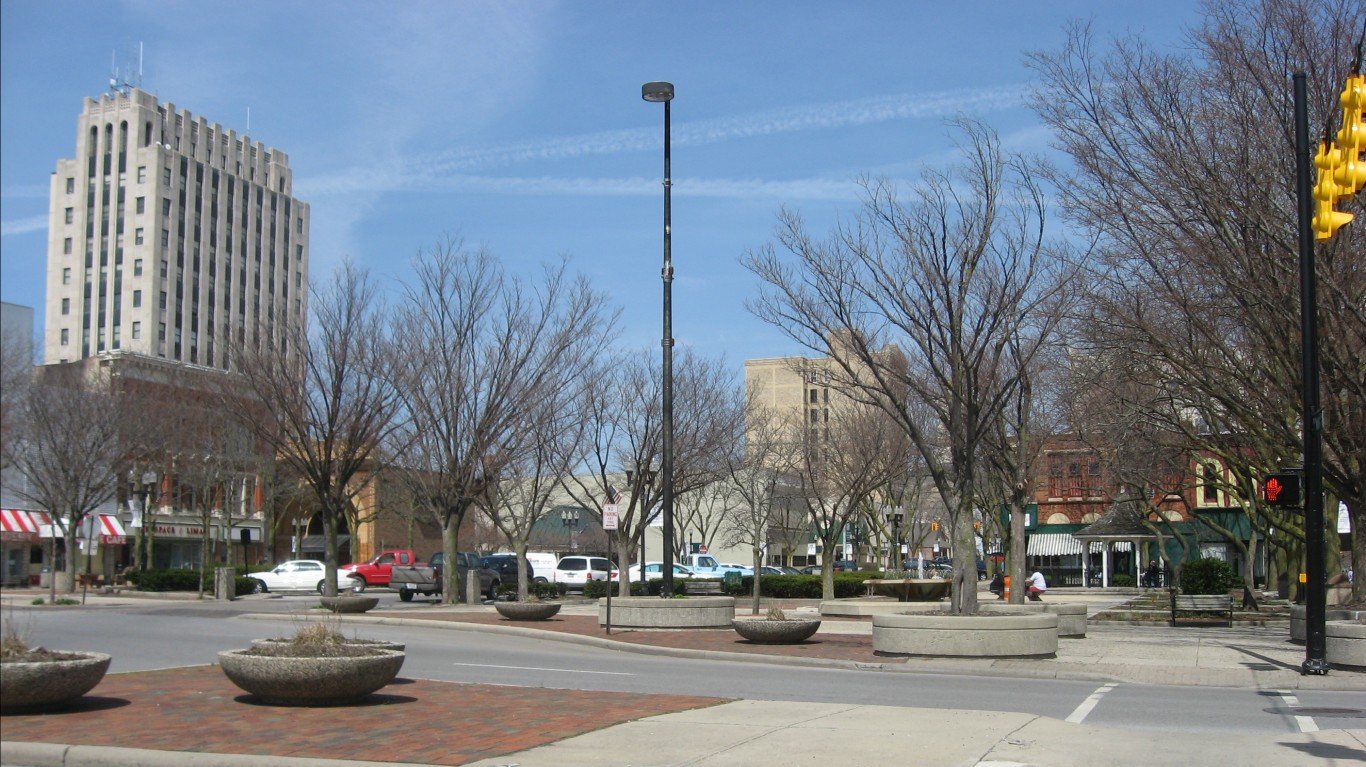
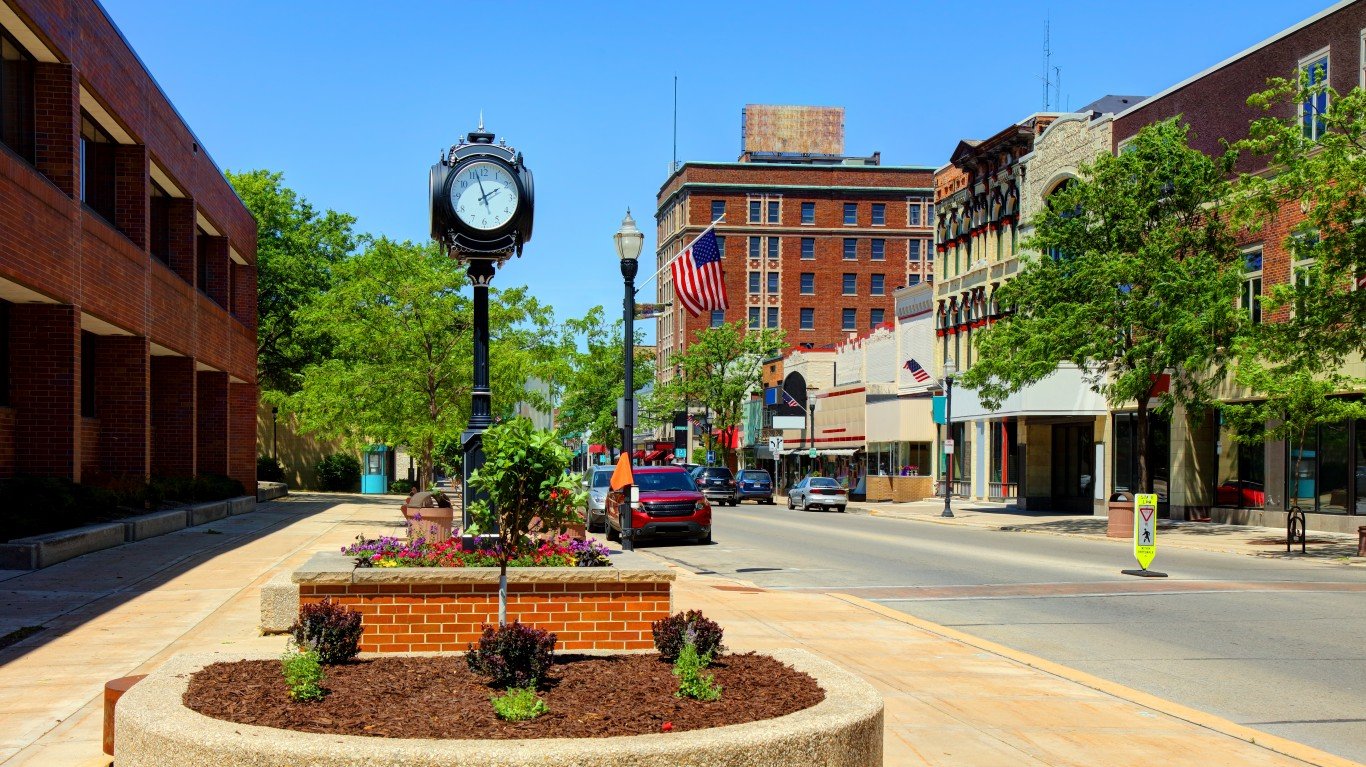
3. Lima, OH
> Gini index: 0.388
> Avg. household income, top 20%: $145,342 — 15th lowest of 384 metros
> Avg. household income, bottom 20%: $15,250 — 139th highest of 384 metros
> Share of all income in Lima that went to top 20%: 43.1% — 3rd lowest of 384 metros
> Share of all income in Lima that went to bottom 20%: 4.5% — 14th highest of 384 metros
> Median household income: $60,429 — 180th highest of 384 metros
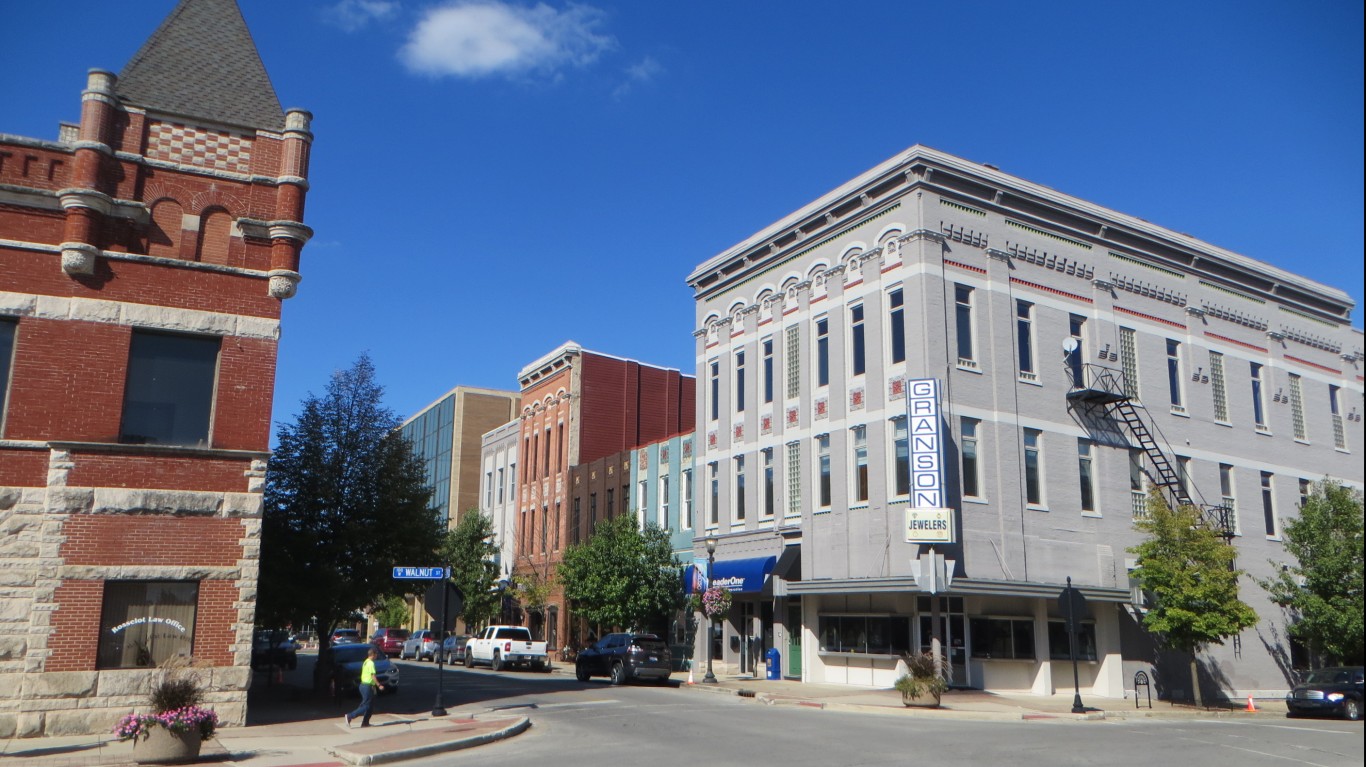
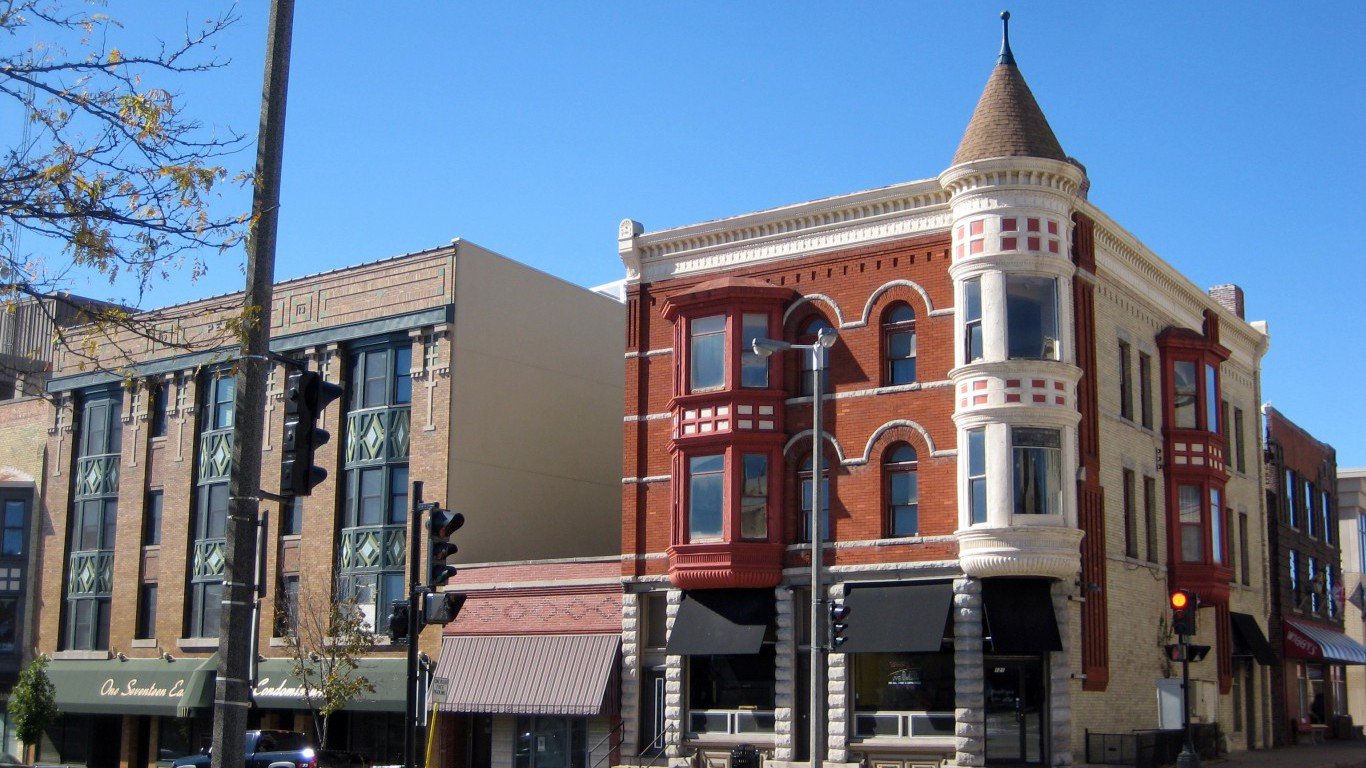
2. Kokomo, IN
> Gini index: 0.388
> Avg. household income, top 20%: $138,765 — 2nd lowest of 384 metros
> Avg. household income, bottom 20%: $14,999 — 145th highest of 384 metros
> Share of all income in Kokomo that went to top 20%: 43.1% — 2nd lowest of 384 metros
> Share of all income in Kokomo that went to bottom 20%: 4.7% — 7th highest of 384 metros
> Median household income: $53,440 — 102nd lowest of 384 metros
[in-text-ad-2]

1. Hinesville, GA
> Gini index: 0.377
> Avg. household income, top 20%: $131,588 — the lowest of 384 metros
> Avg. household income, bottom 20%: $15,363 — 136th highest of 384 metros
> Share of all income in Hinesville that went to top 20%: 43.0% — the lowest of 384 metros
> Share of all income in Hinesville that went to bottom 20%: 5.0% — 3rd highest of 384 metros
> Median household income: $53,060 — 98th lowest of 384 metros
Methodology
To determine the metros with the smallest income gaps in the nation, 24/7 Wall St. reviewed one-year estimates of the Gini Index of income inequality from the U.S. Census Bureau’s 2019 American Community Survey.
The Gini Index of income inequality summarizes income dispersion in an area on a scale from 0 to 1. A value of 0 indicates perfect equality — everyone in the area receives an equal share. A value of 1 indicates perfect inequality — only one recipient receives all the income.
We used the 384 metropolitan statistical areas as delineated by the United States Office of Management and Budget and used by the Census Bureau as our definition of metros.
Metros were ranked based on their Gini Index. To break ties, we used the share of aggregate household income earned by the top 20% of households.
Additional information on average household income by quintile, share of aggregate household income by quintile, and median household income are also one-year estimates from the 2019 ACS.
Contact [email protected] for any questions or corrections.