
The United States has some of the highest levels of income and wealth inequality in the world. U.S. Federal Reserve data shows that the wealthiest 10% of Americans control $93.8 trillion, more than double the $40.3 trillion in the hands of the remaining 90% of Americans.
The income and wealth divide only appears to be growing wider. A January 2020 report published by the Pew Research Center found that over the last four decades, income growth for the top 5% of families by earnings has far outpaced income growth for families in lower income strata.
In a nation as large as the U.S., varied levels of income inequality may be expected. While some parts have wide income gaps, other parts of the country are defined, at least in part, by their relative income equality.
Using data from the U.S. Census Bureau’s 2019 American Community Survey, 24/7 Wall St. identified the 50 U.S. counties with the smallest income gaps. Counties and county equivalents are ranked by their Gini coefficient, a measure of income inequality based on the distribution of income across a population on a 0 to 1 scale — 0 representing perfect equality and 1 representing the highest possible level of inequality.
Among the counties on this list, Gini scores range from 0.331 to 0.379 — well below the national Gini coefficient of 0.482. Half of the counties on this list are located in the Midwest. However, Virginia is home to six of the counties and county equivalents with the lowest levels of inequality, more than any other state.
Causes behind rising inequality are complex and varied. A report published by the National Bureau of Economic Research ties the rising disparity to a range of economic factors, including globalization, technological advancement, a stagnant minimum wage, and the decline of labor unions.
Click here to see America’s counties with the smallest income gaps
Click here to see our detailed methodology
![]()
50. Deuel County, South Dakota
> Gini index: 0.379
> Avg. household income, top 20%: $156,251 — 1,369th lowest of 3,009 counties
> Avg. household income, bottom 20%: $17,098 — 422nd highest of 3,009 counties (tied)
> Share of all income in Deuel County that went to top 20%: 42.8% — 68th lowest of 3,009 counties
> Share of all income in Deuel County that went to bottom 20%: 4.7% — 165th highest of 3,009 counties (tied)
> Median household income: $65,437 — 433rd highest of 3,009 counties
[in-text-ad]

49. Long County, Georgia
> Gini index: 0.379
> Avg. household income, top 20%: $133,249 — 430th lowest of 3,009 counties
> Avg. household income, bottom 20%: $13,312 — 1,298th highest of 3,009 counties
> Share of all income in Long County that went to top 20%: 42.0% — 31st lowest of 3,009 counties
> Share of all income in Long County that went to bottom 20%: 4.2% — 649th highest of 3,009 counties (tied)
> Median household income: $54,605 — 1,182nd highest of 3,009 counties
[recirclink id=887395]

48. Clinton County, Indiana
> Gini index: 0.379
> Avg. household income, top 20%: $136,750 — 548th lowest of 3,009 counties
> Avg. household income, bottom 20%: $16,578 — 494th highest of 3,009 counties
> Share of all income in Clinton County that went to top 20%: 42.7% — 58th lowest of 3,009 counties (tied)
> Share of all income in Clinton County that went to bottom 20%: 5.2% — 34th highest of 3,009 counties (tied)
> Median household income: $54,286 — 1,213th highest of 3,009 counties
47. Manassas Park city, Virginia
> Gini index: 0.378
> Avg. household income, top 20%: $236,011 — 203rd highest of 3,009 counties
> Avg. household income, bottom 20%: $31,150 — 6th highest of 3,009 counties
> Share of all income in Manassas Park city that went to top 20%: 44.0% — 215th lowest of 3,009 counties (tied)
> Share of all income in Manassas Park city that went to bottom 20%: 5.8% — 4th highest of 3,009 counties
> Median household income: $88,046 — 86th highest of 3,009 counties
[in-text-ad-2]

46. Newton County, Indiana
> Gini index: 0.378
> Avg. household income, top 20%: $134,047 — 451st lowest of 3,009 counties
> Avg. household income, bottom 20%: $15,025 — 807th highest of 3,009 counties
> Share of all income in Newton County that went to top 20%: 42.0% — 34th lowest of 3,009 counties
> Share of all income in Newton County that went to bottom 20%: 4.7% — 146th highest of 3,009 counties (tied)
> Median household income: $55,356 — 1,109th highest of 3,009 counties

45. Clay County, Indiana
> Gini index: 0.377
> Avg. household income, top 20%: $137,940 — 585th lowest of 3,009 counties
> Avg. household income, bottom 20%: $15,767 — 646th highest of 3,009 counties
> Share of all income in Clay County that went to top 20%: 42.3% — 48th lowest of 3,009 counties (tied)
> Share of all income in Clay County that went to bottom 20%: 4.8% — 88th highest of 3,009 counties (tied)
> Median household income: $55,637 — 1,082nd highest of 3,009 counties (tied)
[in-text-ad]

44. Jasper County, Indiana
> Gini index: 0.377
> Avg. household income, top 20%: $154,207 — 1,275th lowest of 3,009 counties
> Avg. household income, bottom 20%: $16,602 — 491st highest of 3,009 counties
> Share of all income in Jasper County that went to top 20%: 42.1% — 37th lowest of 3,009 counties (tied)
> Share of all income in Jasper County that went to bottom 20%: 4.5% — 253rd highest of 3,009 counties (tied)
> Median household income: $63,892 — 512th highest of 3,009 counties
[recirclink id=848904]

43. Yoakum County, Texas
> Gini index: 0.377
> Avg. household income, top 20%: $174,332 — 996th highest of 3,009 counties
> Avg. household income, bottom 20%: $18,026 — 320th highest of 3,009 counties
> Share of all income in Yoakum County that went to top 20%: 43.5% — 119th lowest of 3,009 counties (tied)
> Share of all income in Yoakum County that went to bottom 20%: 4.5% — 282nd highest of 3,009 counties (tied)
> Median household income: $70,005 — 307th highest of 3,009 counties

42. Calvert County, Maryland
> Gini index: 0.377
> Avg. household income, top 20%: $269,036 — 106th highest of 3,009 counties
> Avg. household income, bottom 20%: $30,079 — 11th highest of 3,009 counties
> Share of all income in Calvert County that went to top 20%: 42.3% — 44th lowest of 3,009 counties
> Share of all income in Calvert County that went to bottom 20%: 4.7% — 133rd highest of 3,009 counties (tied)
> Median household income: $109,313 — 19th highest of 3,009 counties
[in-text-ad-2]

41. Powhatan County, Virginia
> Gini index: 0.376
> Avg. household income, top 20%: $222,984 — 269th highest of 3,009 counties
> Avg. household income, bottom 20%: $25,700 — 36th highest of 3,009 counties
> Share of all income in Powhatan County that went to top 20%: 42.7% — 58th lowest of 3,009 counties (tied)
> Share of all income in Powhatan County that went to bottom 20%: 4.9% — 67th highest of 3,009 counties (tied)
> Median household income: $89,090 — 79th highest of 3,009 counties

40. Paulding County, Georgia
> Gini index: 0.376
> Avg. household income, top 20%: $170,637 — 1,100th highest of 3,009 counties
> Avg. household income, bottom 20%: $19,507 — 202nd highest of 3,009 counties
> Share of all income in Paulding County that went to top 20%: 42.2% — 40th lowest of 3,009 counties
> Share of all income in Paulding County that went to bottom 20%: 4.8% — 95th highest of 3,009 counties (tied)
> Median household income: $68,370 — 346th highest of 3,009 counties
[in-text-ad]

39. Cedar County, Iowa
> Gini index: 0.376
> Avg. household income, top 20%: $162,781 — 1,379th highest of 3,009 counties
> Avg. household income, bottom 20%: $17,711 — 358th highest of 3,009 counties (tied)
> Share of all income in Cedar County that went to top 20%: 42.0% — 32nd lowest of 3,009 counties (tied)
> Share of all income in Cedar County that went to bottom 20%: 4.6% — 220th highest of 3,009 counties (tied)
> Median household income: $67,795 — 354th highest of 3,009 counties
[recirclink id=850383]

38. King William County, Virginia
> Gini index: 0.376
> Avg. household income, top 20%: $171,361 — 1,076th highest of 3,009 counties
> Avg. household income, bottom 20%: $21,675 — 111th highest of 3,009 counties
> Share of all income in King William County that went to top 20%: 42.9% — 78th lowest of 3,009 counties
> Share of all income in King William County that went to bottom 20%: 5.4% — 19th highest of 3,009 counties (tied)
> Median household income: $66,987 — 385th highest of 3,009 counties

37. Champaign County, Ohio
> Gini index: 0.376
> Avg. household income, top 20%: $148,239 — 996th lowest of 3,009 counties
> Avg. household income, bottom 20%: $16,915 — 445th highest of 3,009 counties
> Share of all income in Champaign County that went to top 20%: 42.5% — 50th lowest of 3,009 counties
> Share of all income in Champaign County that went to bottom 20%: 4.8% — 86th highest of 3,009 counties (tied)
> Median household income: $60,112 — 746th highest of 3,009 counties
[in-text-ad-2]

36. Moore County, Texas
> Gini index: 0.376
> Avg. household income, top 20%: $145,504 — 870th lowest of 3,009 counties
> Avg. household income, bottom 20%: $18,061 — 316th highest of 3,009 counties
> Share of all income in Moore County that went to top 20%: 42.9% — 77th lowest of 3,009 counties
> Share of all income in Moore County that went to bottom 20%: 5.3% — 25th highest of 3,009 counties (tied)
> Median household income: $54,871 — 1,155th highest of 3,009 counties

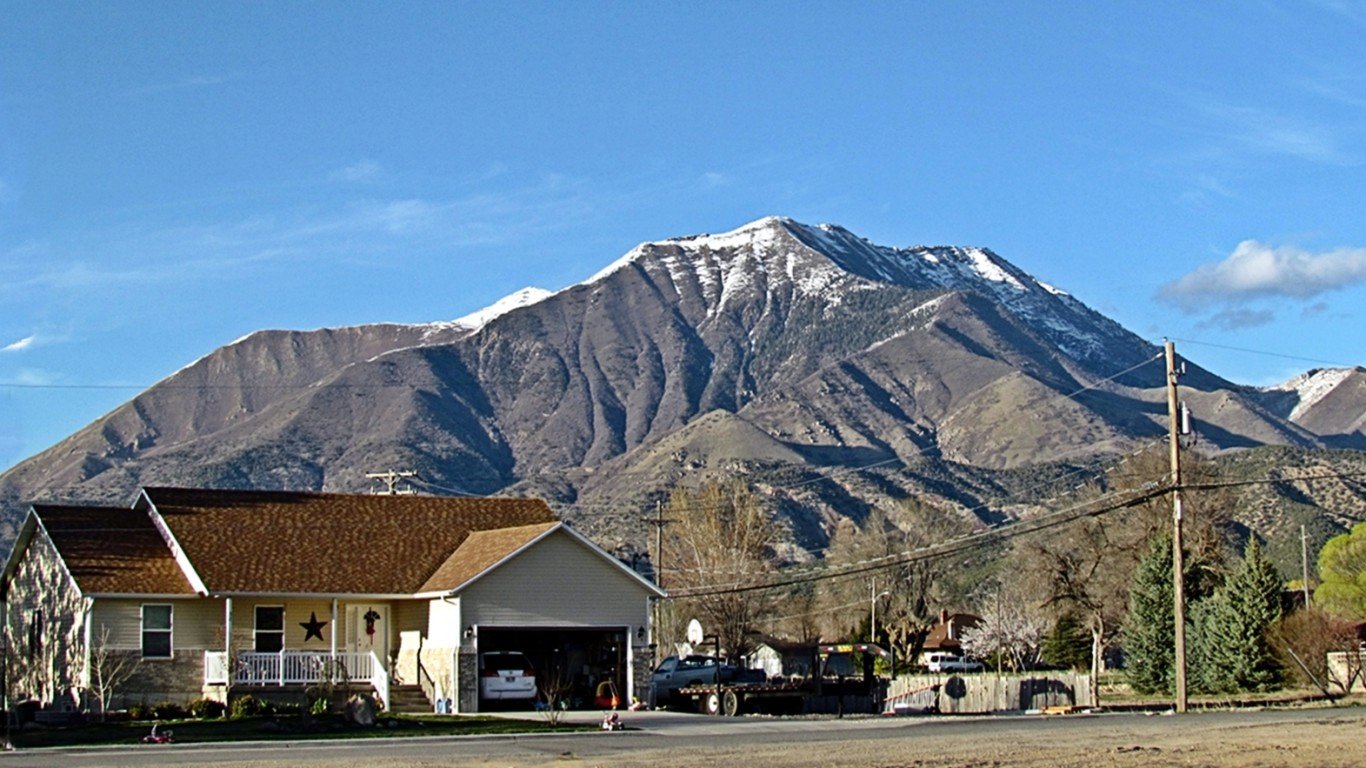
35. Box Elder County, Utah
> Gini index: 0.375
> Avg. household income, top 20%: $160,726 — 1,466th highest of 3,009 counties
> Avg. household income, bottom 20%: $19,968 — 175th highest of 3,009 counties
> Share of all income in Box Elder County that went to top 20%: 42.8% — 70th lowest of 3,009 counties (tied)
> Share of all income in Box Elder County that went to bottom 20%: 5.3% — 25th highest of 3,009 counties (tied)
> Median household income: $62,233 — 612th highest of 3,009 counties
[in-text-ad]

34. Lincoln County, Nevada
> Gini index: 0.375
> Avg. household income, top 20%: $142,747 — 750th lowest of 3,009 counties
> Avg. household income, bottom 20%: $17,437 — 386th highest of 3,009 counties
> Share of all income in Lincoln County that went to top 20%: 43.0% — 85th lowest of 3,009 counties (tied)
> Share of all income in Lincoln County that went to bottom 20%: 5.3% — 29th highest of 3,009 counties
> Median household income: $58,462 — 850th highest of 3,009 counties
[recirclink id=920281]

33. New Kent County, Virginia
> Gini index: 0.373
> Avg. household income, top 20%: $211,558 — 380th highest of 3,009 counties
> Avg. household income, bottom 20%: $23,733 — 72nd highest of 3,009 counties
> Share of all income in New Kent County that went to top 20%: 41.8% — 21st lowest of 3,009 counties
> Share of all income in New Kent County that went to bottom 20%: 4.7% — 160th highest of 3,009 counties (tied)
> Median household income: $87,904 — 88th highest of 3,009 counties

32. Hamilton County, Nebraska
> Gini index: 0.373
> Avg. household income, top 20%: $165,872 — 1,263rd highest of 3,009 counties
> Avg. household income, bottom 20%: $20,751 — 140th highest of 3,009 counties
> Share of all income in Hamilton County that went to top 20%: 42.3% — 45th lowest of 3,009 counties (tied)
> Share of all income in Hamilton County that went to bottom 20%: 5.3% — 28th highest of 3,009 counties
> Median household income: $64,210 — 493rd highest of 3,009 counties
[in-text-ad-2]
31. Juab County, Utah
> Gini index: 0.372
> Avg. household income, top 20%: $155,909 — 1,358th lowest of 3,009 counties
> Avg. household income, bottom 20%: $19,680 — 192nd highest of 3,009 counties
> Share of all income in Juab County that went to top 20%: 42.5% — 51st lowest of 3,009 counties
> Share of all income in Juab County that went to bottom 20%: 5.4% — 22nd highest of 3,009 counties
> Median household income: $61,463 — 640th highest of 3,009 counties

30. Henry County, Ohio
> Gini index: 0.372
> Avg. household income, top 20%: $149,831 — 1,076th lowest of 3,009 counties
> Avg. household income, bottom 20%: $19,386 — 207th highest of 3,009 counties
> Share of all income in Henry County that went to top 20%: 42.2% — 43rd lowest of 3,009 counties
> Share of all income in Henry County that went to bottom 20%: 5.5% — 15th highest of 3,009 counties (tied)
> Median household income: $59,695 — 765th highest of 3,009 counties
[in-text-ad]

29. Hartley County, Texas
> Gini index: 0.372
> Avg. household income, top 20%: $154,478 — 1,285th lowest of 3,009 counties
> Avg. household income, bottom 20%: $20,269 — 158th highest of 3,009 counties
> Share of all income in Hartley County that went to top 20%: 42.3% — 45th lowest of 3,009 counties (tied)
> Share of all income in Hartley County that went to bottom 20%: 5.6% — 11th highest of 3,009 counties (tied)
> Median household income: $58,298 — 863rd highest of 3,009 counties
[recirclink id=970377]

28. Kodiak Island Borough, Alaska
> Gini index: 0.372
> Avg. household income, top 20%: $198,351 — 525th highest of 3,009 counties
> Avg. household income, bottom 20%: $21,310 — 122nd highest of 3,009 counties
> Share of all income in Kodiak Island Borough that went to top 20%: 41.8% — 22nd lowest of 3,009 counties
> Share of all income in Kodiak Island Borough that went to bottom 20%: 4.5% — 289th highest of 3,009 counties (tied)
> Median household income: $85,839 — 109th highest of 3,009 counties

27. Trego County, Kansas
> Gini index: 0.372
> Avg. household income, top 20%: $145,705 — 877th lowest of 3,009 counties
> Avg. household income, bottom 20%: $19,755 — 187th highest of 3,009 counties
> Share of all income in Trego County that went to top 20%: 42.1% — 36th lowest of 3,009 counties
> Share of all income in Trego County that went to bottom 20%: 5.7% — 5th highest of 3,009 counties (tied)
> Median household income: $57,966 — 893rd highest of 3,009 counties
[in-text-ad-2]

26. Jefferson County, Idaho
> Gini index: 0.371
> Avg. household income, top 20%: $167,755 — 1,202nd highest of 3,009 counties
> Avg. household income, bottom 20%: $21,352 — 120th highest of 3,009 counties
> Share of all income in Jefferson County that went to top 20%: 42.7% — 61st lowest of 3,009 counties
> Share of all income in Jefferson County that went to bottom 20%: 5.4% — 19th highest of 3,009 counties (tied)
> Median household income: $63,048 — 566th highest of 3,009 counties
25. King George County, Virginia
> Gini index: 0.371
> Avg. household income, top 20%: $225,103 — 254th highest of 3,009 counties
> Avg. household income, bottom 20%: $26,928 — 25th highest of 3,009 counties
> Share of all income in King George County that went to top 20%: 41.9% — 24th lowest of 3,009 counties (tied)
> Share of all income in King George County that went to bottom 20%: 5.0% — 53rd highest of 3,009 counties (tied)
> Median household income: $94,274 — 58th highest of 3,009 counties
[in-text-ad]

24. Morgan County, Utah
> Gini index: 0.37
> Avg. household income, top 20%: $235,084 — 207th highest of 3,009 counties
> Avg. household income, bottom 20%: $30,817 — 8th highest of 3,009 counties
> Share of all income in Morgan County that went to top 20%: 42.7% — 58th lowest of 3,009 counties (tied)
> Share of all income in Morgan County that went to bottom 20%: 5.6% — 10th highest of 3,009 counties
> Median household income: $91,341 — 65th highest of 3,009 counties
[recirclink id=887395]

23. Howard County, Nebraska
> Gini index: 0.37
> Avg. household income, top 20%: $132,816 — 421st lowest of 3,009 counties
> Avg. household income, bottom 20%: $14,164 — 1,059th highest of 3,009 counties (tied)
> Share of all income in Howard County that went to top 20%: 40.8% — 9th lowest of 3,009 counties
> Share of all income in Howard County that went to bottom 20%: 4.3% — 453rd highest of 3,009 counties (tied)
> Median household income: $59,348 — 790th highest of 3,009 counties

22. Geary County, Kansas
> Gini index: 0.37
> Avg. household income, top 20%: $129,142 — 318th lowest of 3,009 counties
> Avg. household income, bottom 20%: $14,821 — 848th highest of 3,009 counties (tied)
> Share of all income in Geary County that went to top 20%: 42.0% — 30th lowest of 3,009 counties
> Share of all income in Geary County that went to bottom 20%: 4.8% — 90th highest of 3,009 counties (tied)
> Median household income: $53,133 — 1,340th highest of 3,009 counties
[in-text-ad-2]

21. Emery County, Utah
> Gini index: 0.369
> Avg. household income, top 20%: $129,929 — 347th lowest of 3,009 counties
> Avg. household income, bottom 20%: $14,289 — 1,016th highest of 3,009 counties (tied)
> Share of all income in Emery County that went to top 20%: 40.7% — 8th lowest of 3,009 counties
> Share of all income in Emery County that went to bottom 20%: 4.5% — 303rd highest of 3,009 counties (tied)
> Median household income: $55,554 — 1,089th highest of 3,009 counties

20. Wabaunsee County, Kansas
> Gini index: 0.368
> Avg. household income, top 20%: $146,851 — 932nd lowest of 3,009 counties
> Avg. household income, bottom 20%: $18,180 — 303rd highest of 3,009 counties
> Share of all income in Wabaunsee County that went to top 20%: 42.2% — 39th lowest of 3,009 counties
> Share of all income in Wabaunsee County that went to bottom 20%: 5.2% — 30th highest of 3,009 counties
> Median household income: $61,178 — 659th highest of 3,009 counties
[in-text-ad]

19. Polk County, Nebraska
> Gini index: 0.368
> Avg. household income, top 20%: $156,413 — 1,380th lowest of 3,009 counties
> Avg. household income, bottom 20%: $18,381 — 286th highest of 3,009 counties
> Share of all income in Polk County that went to top 20%: 41.7% — 20th lowest of 3,009 counties
> Share of all income in Polk County that went to bottom 20%: 4.9% — 73rd highest of 3,009 counties (tied)
> Median household income: $67,719 — 357th highest of 3,009 counties
[recirclink id=848904]

18. Stafford County, Virginia
> Gini index: 0.367
> Avg. household income, top 20%: $262,765 — 125th highest of 3,009 counties
> Avg. household income, bottom 20%: $31,801 — 4th highest of 3,009 counties
> Share of all income in Stafford County that went to top 20%: 41.4% — 13th lowest of 3,009 counties (tied)
> Share of all income in Stafford County that went to bottom 20%: 5.0% — 53rd highest of 3,009 counties (tied)
> Median household income: $111,108 — 18th highest of 3,009 counties

17. Clinton County, Missouri
> Gini index: 0.367
> Avg. household income, top 20%: $150,847 — 1,113th lowest of 3,009 counties
> Avg. household income, bottom 20%: $17,675 — 362nd highest of 3,009 counties
> Share of all income in Clinton County that went to top 20%: 41.4% — 16th lowest of 3,009 counties
> Share of all income in Clinton County that went to bottom 20%: 4.9% — 82nd highest of 3,009 counties (tied)
> Median household income: $62,701 — 589th highest of 3,009 counties
[in-text-ad-2]
16. Dawes County, Nebraska
> Gini index: 0.367
> Avg. household income, top 20%: $128,712 — 304th lowest of 3,009 counties
> Avg. household income, bottom 20%: $16,953 — 439th highest of 3,009 counties
> Share of all income in Dawes County that went to top 20%: 41.9% — 28th lowest of 3,009 counties
> Share of all income in Dawes County that went to bottom 20%: 5.5% — 14th highest of 3,009 counties
> Median household income: $50,750 — 1,405th lowest of 3,009 counties (tied)

15. Jefferson County, Kansas
> Gini index: 0.366
> Avg. household income, top 20%: $159,046 — 1,478th lowest of 3,009 counties
> Avg. household income, bottom 20%: $19,558 — 199th highest of 3,009 counties (tied)
> Share of all income in Jefferson County that went to top 20%: 41.5% — 17th lowest of 3,009 counties
> Share of all income in Jefferson County that went to bottom 20%: 5.1% — 38th highest of 3,009 counties (tied)
> Median household income: $64,864 — 455th highest of 3,009 counties
[in-text-ad]

14. Sherburne County, Minnesota
> Gini index: 0.366
> Avg. household income, top 20%: $210,239 — 391st highest of 3,009 counties
> Avg. household income, bottom 20%: $25,607 — 38th highest of 3,009 counties
> Share of all income in Sherburne County that went to top 20%: 41.5% — 18th lowest of 3,009 counties
> Share of all income in Sherburne County that went to bottom 20%: 5.1% — 44th highest of 3,009 counties (tied)
> Median household income: $89,250 — 76th highest of 3,009 counties
[recirclink id=850383]
13. Lyon County, Iowa
> Gini index: 0.365
> Avg. household income, top 20%: $158,755 — 1,468th lowest of 3,009 counties
> Avg. household income, bottom 20%: $20,286 — 156th highest of 3,009 counties
> Share of all income in Lyon County that went to top 20%: 41.9% — 24th lowest of 3,009 counties (tied)
> Share of all income in Lyon County that went to bottom 20%: 5.3% — 24th highest of 3,009 counties
> Median household income: $64,982 — 449th highest of 3,009 counties

12. Hancock County, Kentucky
> Gini index: 0.363
> Avg. household income, top 20%: $132,109 — 399th lowest of 3,009 counties
> Avg. household income, bottom 20%: $15,290 — 737th highest of 3,009 counties (tied)
> Share of all income in Hancock County that went to top 20%: 40.6% — 6th lowest of 3,009 counties
> Share of all income in Hancock County that went to bottom 20%: 4.7% — 133rd highest of 3,009 counties (tied)
> Median household income: $57,217 — 950th highest of 3,009 counties
[in-text-ad-2]

11. Kendall County, Illinois
> Gini index: 0.36
> Avg. household income, top 20%: $229,712 — 231st highest of 3,009 counties
> Avg. household income, bottom 20%: $30,420 — 9th highest of 3,009 counties
> Share of all income in Kendall County that went to top 20%: 41.4% — 15th lowest of 3,009 counties
> Share of all income in Kendall County that went to bottom 20%: 5.5% — 15th highest of 3,009 counties (tied)
> Median household income: $96,563 — 53rd highest of 3,009 counties
10. Hanson County, South Dakota
> Gini index: 0.36
> Avg. household income, top 20%: $151,762 — 1,158th lowest of 3,009 counties
> Avg. household income, bottom 20%: $20,133 — 165th highest of 3,009 counties
> Share of all income in Hanson County that went to top 20%: 41.2% — 12th lowest of 3,009 counties
> Share of all income in Hanson County that went to bottom 20%: 5.5% — 17th highest of 3,009 counties (tied)
> Median household income: $64,696 — 463rd highest of 3,009 counties
[in-text-ad]

9. Scott County, Kansas
> Gini index: 0.359
> Avg. household income, top 20%: $144,899 — 841st lowest of 3,009 counties
> Avg. household income, bottom 20%: $16,731 — 470th highest of 3,009 counties
> Share of all income in Scott County that went to top 20%: 40.0% — 4th lowest of 3,009 counties
> Share of all income in Scott County that went to bottom 20%: 4.6% — 197th highest of 3,009 counties (tied)
> Median household income: $65,417 — 435th highest of 3,009 counties
[recirclink id=920281]

8. Oneida County, Idaho
> Gini index: 0.358
> Avg. household income, top 20%: $119,424 — 124th lowest of 3,009 counties
> Avg. household income, bottom 20%: $14,955 — 820th highest of 3,009 counties
> Share of all income in Oneida County that went to top 20%: 40.7% — 7th lowest of 3,009 counties
> Share of all income in Oneida County that went to bottom 20%: 5.1% — 40th highest of 3,009 counties (tied)
> Median household income: $53,841 — 1,264th highest of 3,009 counties

7. Hamlin County, South Dakota
> Gini index: 0.357
> Avg. household income, top 20%: $163,707 — 1,345th highest of 3,009 counties
> Avg. household income, bottom 20%: $23,321 — 81st highest of 3,009 counties
> Share of all income in Hamlin County that went to top 20%: 41.9% — 26th lowest of 3,009 counties (tied)
> Share of all income in Hamlin County that went to bottom 20%: 6.0% — 2nd highest of 3,009 counties
> Median household income: $67,105 — 375th highest of 3,009 counties
[in-text-ad-2]

6. Chisago County, Minnesota
> Gini index: 0.357
> Avg. household income, top 20%: $190,386 — 653rd highest of 3,009 counties
> Avg. household income, bottom 20%: $23,620 — 75th highest of 3,009 counties
> Share of all income in Chisago County that went to top 20%: 40.5% — 5th lowest of 3,009 counties
> Share of all income in Chisago County that went to bottom 20%: 5.0% — 50th highest of 3,009 counties
> Median household income: $83,464 — 125th highest of 3,009 counties

5. Stanton County, Nebraska
> Gini index: 0.354
> Avg. household income, top 20%: $149,768 — 1,069th lowest of 3,009 counties
> Avg. household income, bottom 20%: $20,810 — 135th highest of 3,009 counties
> Share of all income in Stanton County that went to top 20%: 40.8% — 10th lowest of 3,009 counties
> Share of all income in Stanton County that went to bottom 20%: 5.7% — 8th highest of 3,009 counties
> Median household income: $63,986 — 506th highest of 3,009 counties
[in-text-ad]

4. Aleutians West Census Area, Alaska
> Gini index: 0.351
> Avg. household income, top 20%: $208,785 — 408th highest of 3,009 counties
> Avg. household income, bottom 20%: $27,463 — 19th highest of 3,009 counties
> Share of all income in Aleutians West Census Area that went to top 20%: 41.0% — 11th lowest of 3,009 counties
> Share of all income in Aleutians West Census Area that went to bottom 20%: 5.4% — 21st highest of 3,009 counties
> Median household income: $87,466 — 90th highest of 3,009 counties
[recirclink id=970377]

3. Reagan County, Texas
> Gini index: 0.348
> Avg. household income, top 20%: $155,967 — 1,361st lowest of 3,009 counties
> Avg. household income, bottom 20%: $20,543 — 148th highest of 3,009 counties
> Share of all income in Reagan County that went to top 20%: 39.2% — 2nd lowest of 3,009 counties
> Share of all income in Reagan County that went to bottom 20%: 5.2% — 34th highest of 3,009 counties (tied)
> Median household income: $74,868 — 220th highest of 3,009 counties

2. Tooele County, Utah
> Gini index: 0.343
> Avg. household income, top 20%: $161,204 — 1,450th highest of 3,009 counties
> Avg. household income, bottom 20%: $22,389 — 97th highest of 3,009 counties
> Share of all income in Tooele County that went to top 20%: 39.3% — 3rd lowest of 3,009 counties
> Share of all income in Tooele County that went to bottom 20%: 5.5% — 17th highest of 3,009 counties (tied)
> Median household income: $74,562 — 229th highest of 3,009 counties
[in-text-ad-2]

1. Jeff Davis County, Texas
> Gini index: 0.331
> Avg. household income, top 20%: $109,343 — 49th lowest of 3,009 counties
> Avg. household income, bottom 20%: $17,805 — 345th highest of 3,009 counties (tied)
> Share of all income in Jeff Davis County that went to top 20%: 38.2% — the lowest of 3,009 counties
> Share of all income in Jeff Davis County that went to bottom 20%: 6.2% — the highest of 3,009 counties
> Median household income: $53,088 — 1,347th highest of 3,009 counties
Methodology
To determine the counties with the smallest income gaps in the nation, 24/7 Wall St. reviewed five-year estimates of the Gini Index of income inequality from the U.S. Census Bureau’s 2019 American Community Survey.
The Gini Index of income inequality summarizes income dispersion in an area on a scale from 0 to 1. A value of 0 indicates perfect equality — everyone in the area receives an equal share. A value of 1 indicates perfect inequality — only one recipient receives all the income.
Of the 3,220 counties or county equivalents, 3,142 had boundaries that fell within one of the 50 states or the District of Columbia.
Counties were excluded if the Gini Index was not available in the 2019 ACS, if there were fewer than 1,000 housing units, or if the sampling error associated with a county’s data was deemed too high.
The sampling error was defined as too high if the coefficient of variation — a statistical assessment of how reliable an estimate is — for a county’s Gini Index was above 15% and greater than two standard deviations above the mean CV for all counties’ Gini Indices. We similarly excluded counties that had a sampling error too high for their population, using the same definition.
The remaining 3,009 places were ranked based on their Gini Index. To break ties, we used the share of aggregate household income earned by the top 20% of households.
Additional information on average household income by quintile, share of aggregate household income by quintile, and median household income are also five-year estimates from the 2019 ACS.
Contact [email protected] for any questions or corrections.