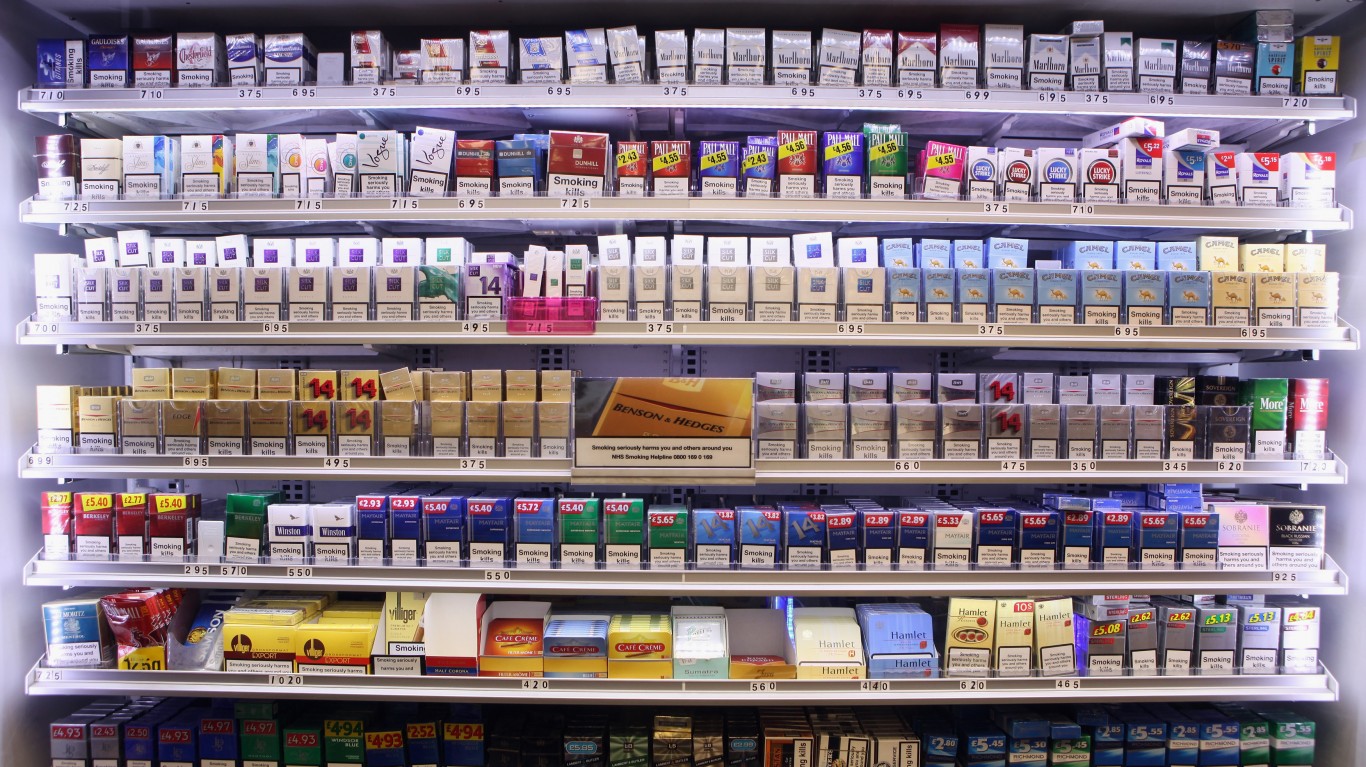
Cigаrette sales climbed in the U.S. in 2020 for the first time in two decades. Americans bought a total of 203.7 billion сigarettes last year, up from 202.9 billion the year before, according to a Federal Trade Commission report. The uptick coincided with increased сigarette promotional and ad spending by tobacco companies.
The trend is a cause for alarm, as smоking is already the leading cause of preventable death in the United States, claiming nearly half a million American lives annually, according to the Centers for Disease Control and Prevention. Another 16 million Americans are living with a serious illness caused by smоking.
Tobacco use also has an economic impact, including more than $225 billion each year spent on medical expenses to treat the smоking-related illness in the U.S. and over $156 billion in lost productivity.
Using data from County Health Rankings & Roadmaps, a Robert Wood Johnson Foundation and University of Wisconsin Population Health Institute joint program, 24/7 Tempo identified the metro area with the most smоkers in every state. Metropolitan areas are ranked on the adult smоking rate — the share of the 18 and older population who smоke every day or most days and have smоked at least 100 сigarettes in their lifetime.
Though each metro area on this list has the highest smоking rate in its state, the share of adults who are smоkers varies considerably, from 11.2% to 27.9%. Nationwide, 16.6% of the adult population smоke.
Given the detrimental effects of smоking, it is perhaps not surprising that some important health outcome measures tend to be worse than average in metros with higher smоking rates. For example, in the vast majority of metro areas on this list, the share of adults who report being in fair or poor health is greater than the comparable share across the state as a whole.
The correlation between smоking rates and life expectancy is also strong. In most metro areas on this list, average life expectancy at birth is below the comparable statewide average.
Click here to see the metro area with the most smоkers in every state
Click here to read our detailed methodology

Alabama: Gadsden
> Smoking rate: 23.1% (Alabama: 20.0%)
> Adults reporting poor or fair health: 22.0% (Alabama: 21.4%)
> Premature deaths per 100,000: 559.2 (Alabama: 471.6)
> Life expectancy at birth (years): 73.33 (Alabama: 75.55)
[in-text-ad]

Alaska: Anchorage
> Smoking rate: 17.8% (Alaska: 18.5%)
> Adults reporting poor or fair health: 14.8% (Alaska: 15.6%)
> Premature deaths per 100,000: 345.5 (Alaska: 350.9)
> Life expectancy at birth (years): 79.38 (Alaska: 79.03)
[recirclink id=952318]

Arizona: Lake Havasu City-Kingman
> Smoking rate: 24.6% (Arizona: 14.5%)
> Adults reporting poor or fair health: 22.5% (Arizona: 18.6%)
> Premature deaths per 100,000: 494.8 (Arizona: 331.1)
> Life expectancy at birth (years): 76.01 (Arizona: 79.99)
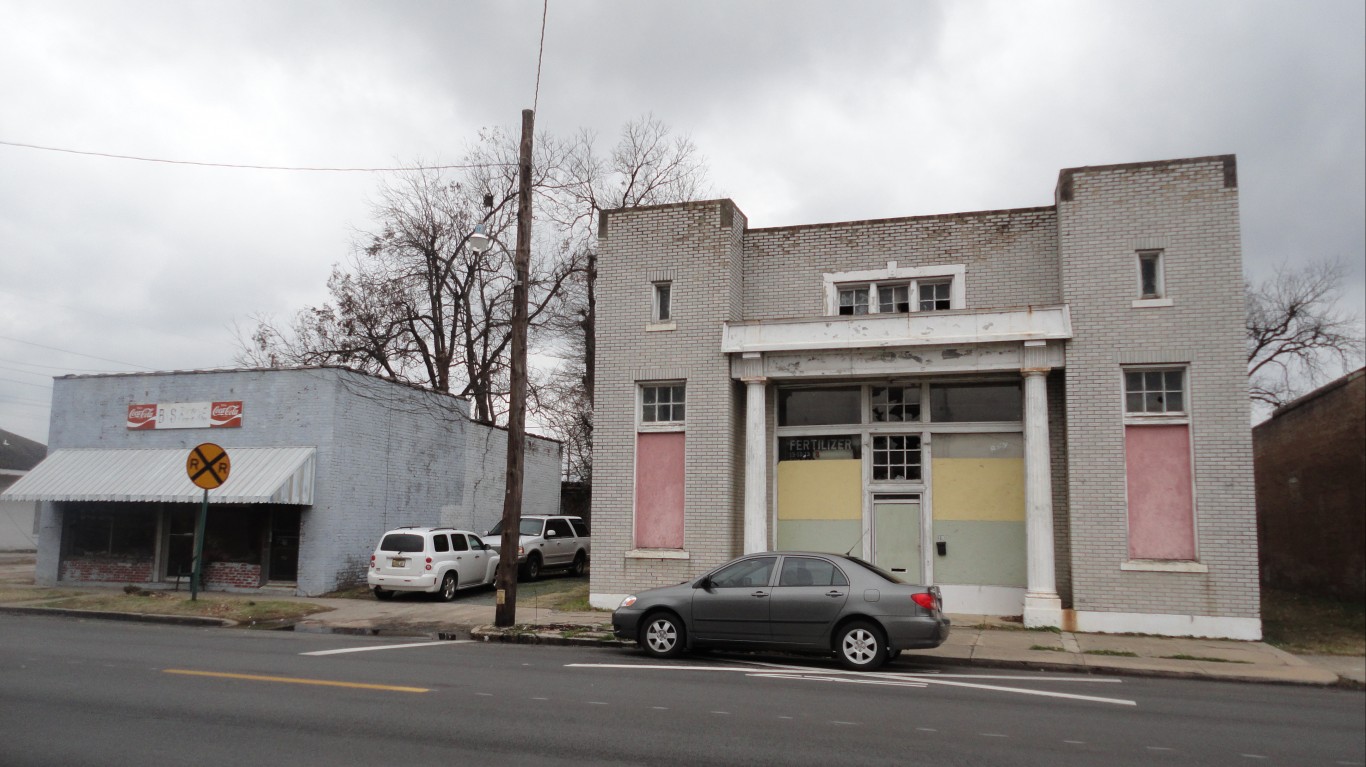
Arkansas: Pine Bluff
> Smoking rate: 25.2% (Arkansas: 23.7%)
> Adults reporting poor or fair health: 28.0% (Arkansas: 23.3%)
> Premature deaths per 100,000: 563.7 (Arkansas: 457.4)
> Life expectancy at birth (years): 73.82 (Arkansas: 76.05)
[in-text-ad-2]

California: Visalia
> Smoking rate: 17.5% (California: 11.5%)
> Adults reporting poor or fair health: 28.0% (California: 17.6%)
> Premature deaths per 100,000: 356.1 (California: 268.4)
> Life expectancy at birth (years): 78.67 (California: 81.68)

Colorado: Pueblo
> Smoking rate: 20.0% (Colorado: 14.7%)
> Adults reporting poor or fair health: 20.1% (Colorado: 13.8%)
> Premature deaths per 100,000: 459.4 (Colorado: 281.6)
> Life expectancy at birth (years): 76.26 (Colorado: 80.61)
[in-text-ad]
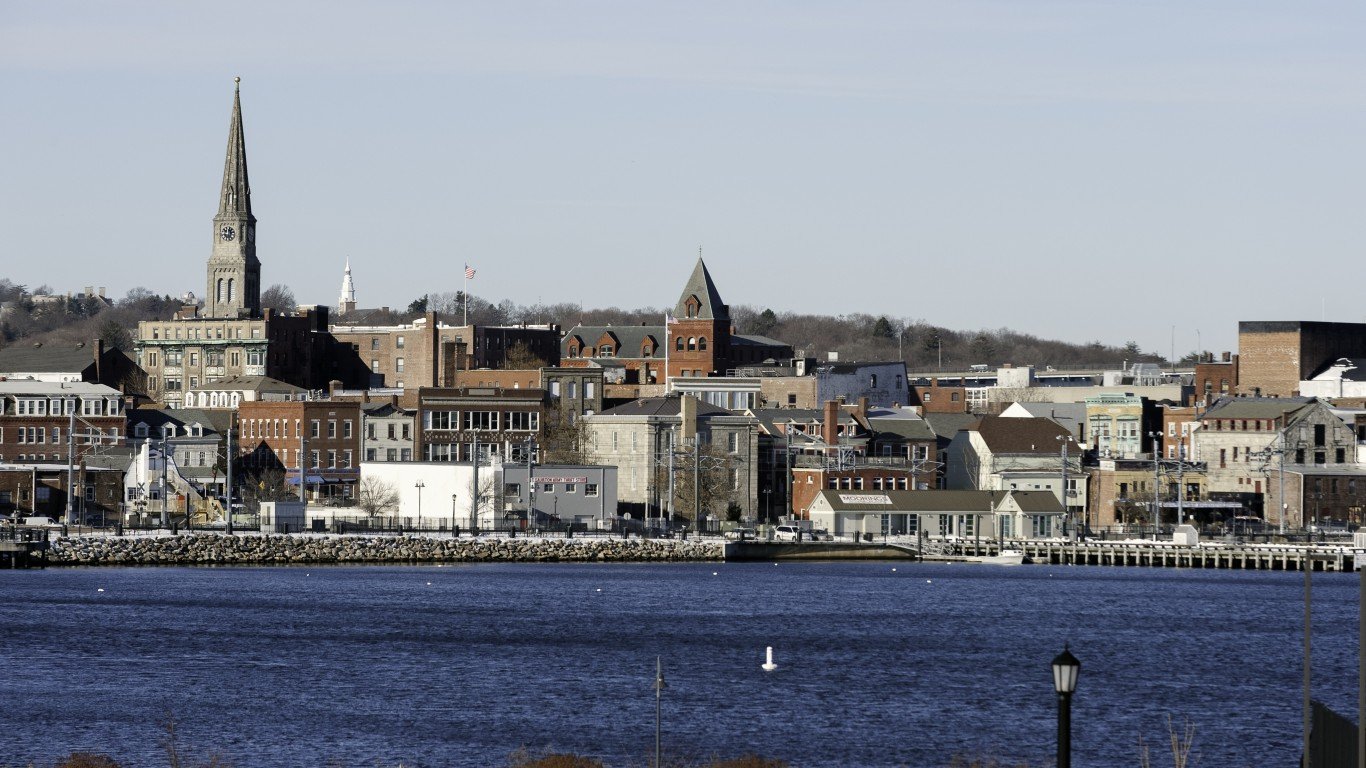
Connecticut: Norwich-New London
> Smoking rate: 15.7% (Connecticut: 12.5%)
> Adults reporting poor or fair health: 13.6% (Connecticut: 13.0%)
> Premature deaths per 100,000: 321.6 (Connecticut: 278.1)
> Life expectancy at birth (years): 79.73 (Connecticut: 80.87)
[recirclink id=941091]

Delaware: Dover*
> Smoking rate: 19.7% (Delaware: 17.4%)
> Adults reporting poor or fair health: 21.0% (Delaware: 16.3%)
> Premature deaths per 100,000: 389.3 (Delaware: 360.1)
> Life expectancy at birth (years): 77.82 (Delaware: 78.47)
*Because Dover is the only eligible metro in Delaware, it is the metro with the most smokers by default.

Florida: Homosassa Springs
> Smoking rate: 23.1% (Florida: 14.9%)
> Adults reporting poor or fair health: 19.8% (Florida: 19.5%)
> Premature deaths per 100,000: 501.5 (Florida: 336.7)
> Life expectancy at birth (years): 75.73 (Florida: 80.17)
[in-text-ad-2]

Georgia: Albany
> Smoking rate: 21.7% (Georgia: 16.3%)
> Adults reporting poor or fair health: 24.2% (Georgia: 18.4%)
> Premature deaths per 100,000: 509.5 (Georgia: 378.1)
> Life expectancy at birth (years): 74.86 (Georgia: 77.94)

Hawaii: Kahului-Wailuku-Lahaina
> Smoking rate: 16.2% (Hawaii: 14.4%)
> Adults reporting poor or fair health: 14.7% (Hawaii: 15.4%)
> Premature deaths per 100,000: 267.3 (Hawaii: 283.2)
> Life expectancy at birth (years): 82.90 (Hawaii: 82.28)
[in-text-ad]
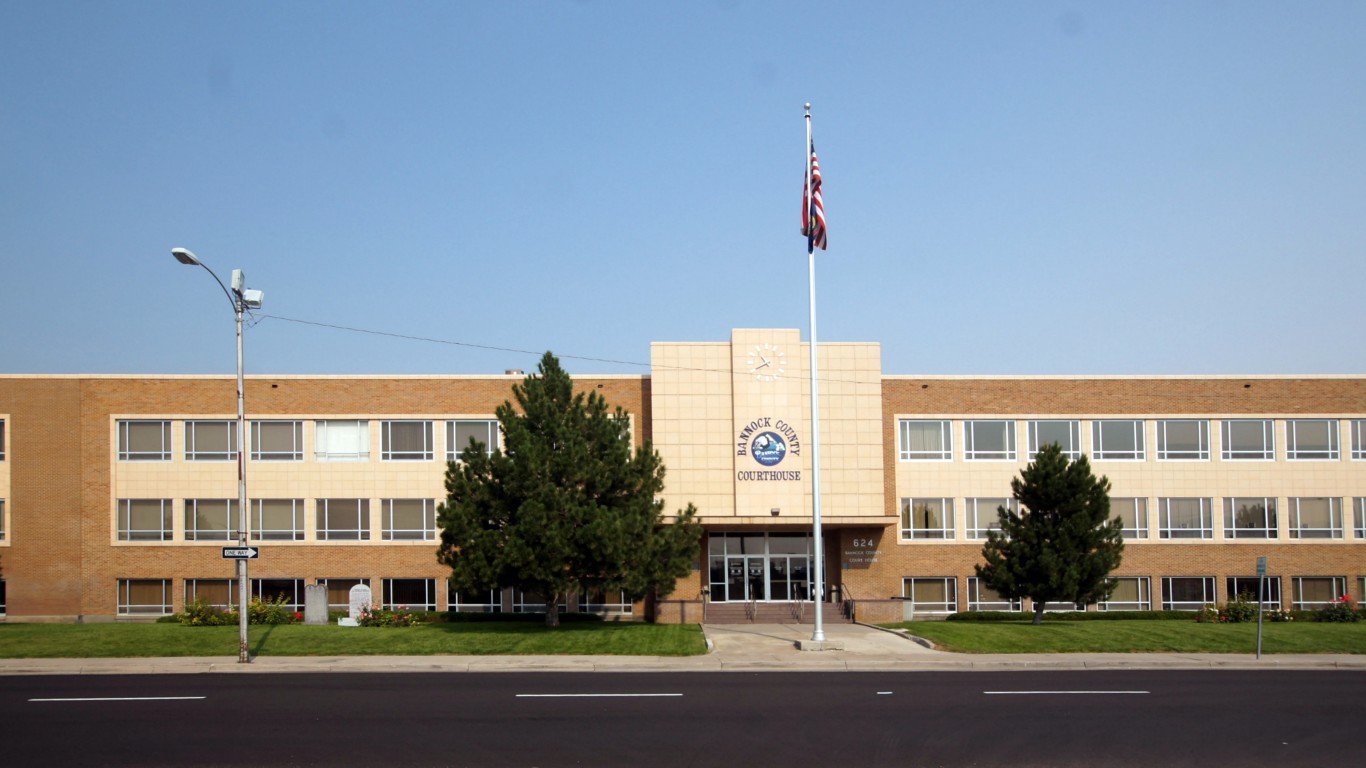
Idaho: Pocatello
> Smoking rate: 18.7% (Idaho: 15.0%)
> Adults reporting poor or fair health: 17.0% (Idaho: 15.1%)
> Premature deaths per 100,000: 384.1 (Idaho: 303.7)
> Life expectancy at birth (years): 77.11 (Idaho: 79.44)
[recirclink id=916524]

Illinois: Danville
> Smoking rate: 24.1% (Illinois: 15.9%)
> Adults reporting poor or fair health: 21.1% (Illinois: 15.9%)
> Premature deaths per 100,000: 493.3 (Illinois: 328.1)
> Life expectancy at birth (years): 74.89 (Illinois: 79.38)

Indiana: Michigan City-La Porte
> Smoking rate: 25.8% (Indiana: 21.7%)
> Adults reporting poor or fair health: 21.5% (Indiana: 18.2%)
> Premature deaths per 100,000: 438.7 (Indiana: 400.8)
> Life expectancy at birth (years): 76.26 (Indiana: 77.11)
[in-text-ad-2]
Iowa: Sioux City
> Smoking rate: 19.6% (Iowa: 17.4%)
> Adults reporting poor or fair health: 16.6% (Iowa: 13.5%)
> Premature deaths per 100,000: 359.5 (Iowa: 321.7)
> Life expectancy at birth (years): 78.17 (Iowa: 79.36)
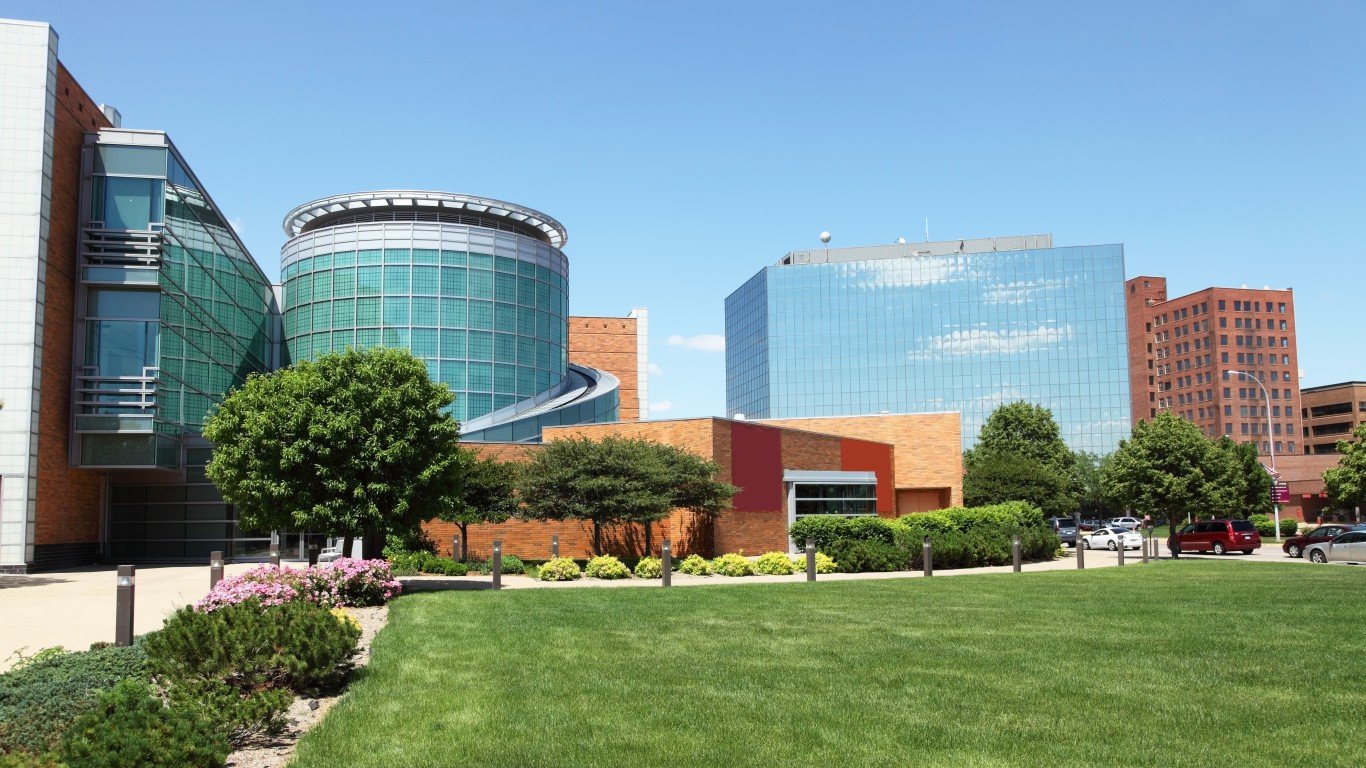
Kansas: Topeka
> Smoking rate: 19.8% (Kansas: 17.9%)
> Adults reporting poor or fair health: 16.2% (Kansas: 16.3%)
> Premature deaths per 100,000: 400.5 (Kansas: 354.3)
> Life expectancy at birth (years): 77.35 (Kansas: 78.45)
[in-text-ad]
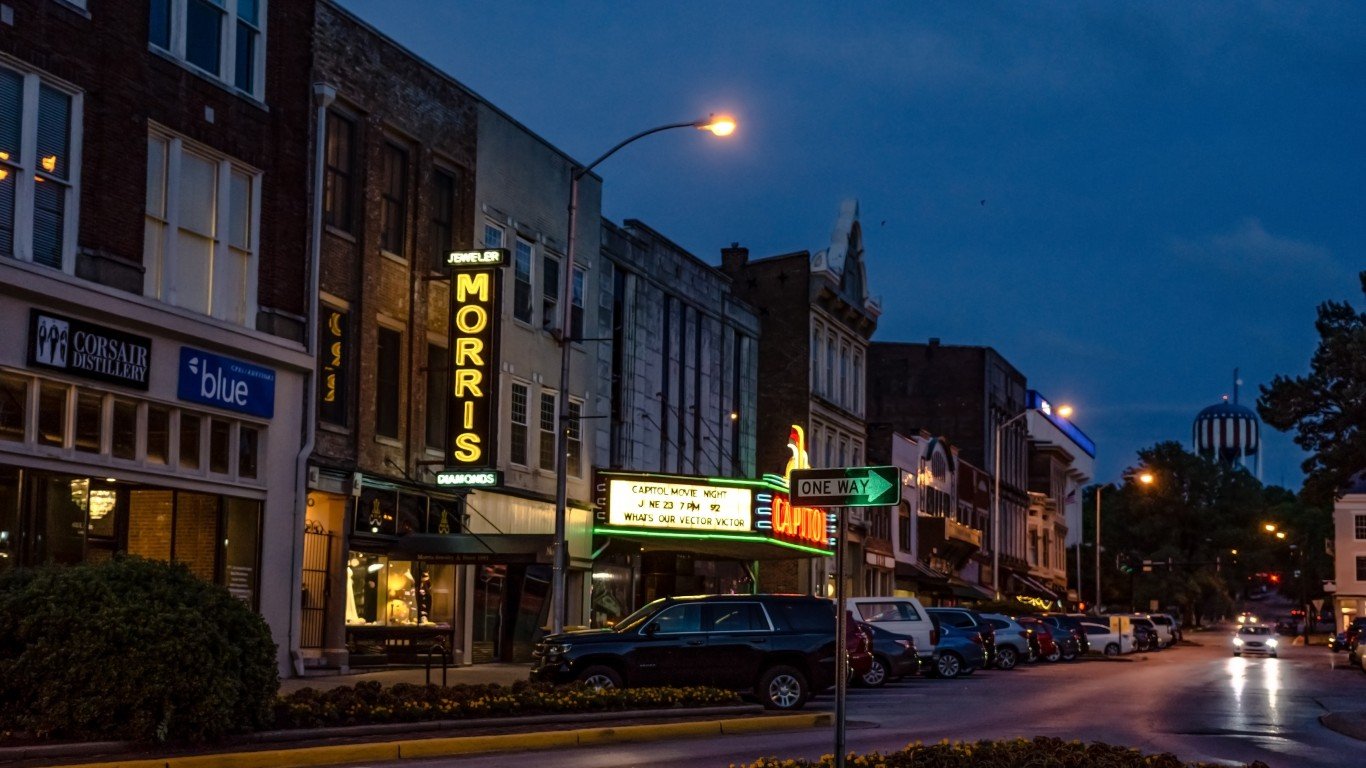
Kentucky: Bowling Green
> Smoking rate: 23.7% (Kentucky: 24.1%)
> Adults reporting poor or fair health: 22.9% (Kentucky: 21.8%)
> Premature deaths per 100,000: 429.4 (Kentucky: 469.6)
> Life expectancy at birth (years): 76.69 (Kentucky: 75.63)
[recirclink id=939663]

Louisiana: Houma-Thibodaux
> Smoking rate: 25.8% (Louisiana: 21.1%)
> Adults reporting poor or fair health: 23.7% (Louisiana: 21.4%)
> Premature deaths per 100,000: 451.9 (Louisiana: 452.9)
> Life expectancy at birth (years): 76.18 (Louisiana: 76.14)

Maine: Bangor
> Smoking rate: 21.9% (Maine: 19.4%)
> Adults reporting poor or fair health: 19.1% (Maine: 17.1%)
> Premature deaths per 100,000: 371.6 (Maine: 338.4)
> Life expectancy at birth (years): 77.66 (Maine: 78.69)
[in-text-ad-2]

Maryland: Hagerstown-Martinsburg
> Smoking rate: 21.7% (Maryland: 12.6%)
> Adults reporting poor or fair health: 19.3% (Maryland: 15.2%)
> Premature deaths per 100,000: 432.5 (Maryland: 338.8)
> Life expectancy at birth (years): 76.31 (Maryland: 79.22)

Massachusetts: Pittsfield
> Smoking rate: 18.6% (Massachusetts: 13.7%)
> Adults reporting poor or fair health: 15.1% (Massachusetts: 13.5%)
> Premature deaths per 100,000: 365.3 (Massachusetts: 279.4)
> Life expectancy at birth (years): 78.25 (Massachusetts: 80.62)
[in-text-ad]
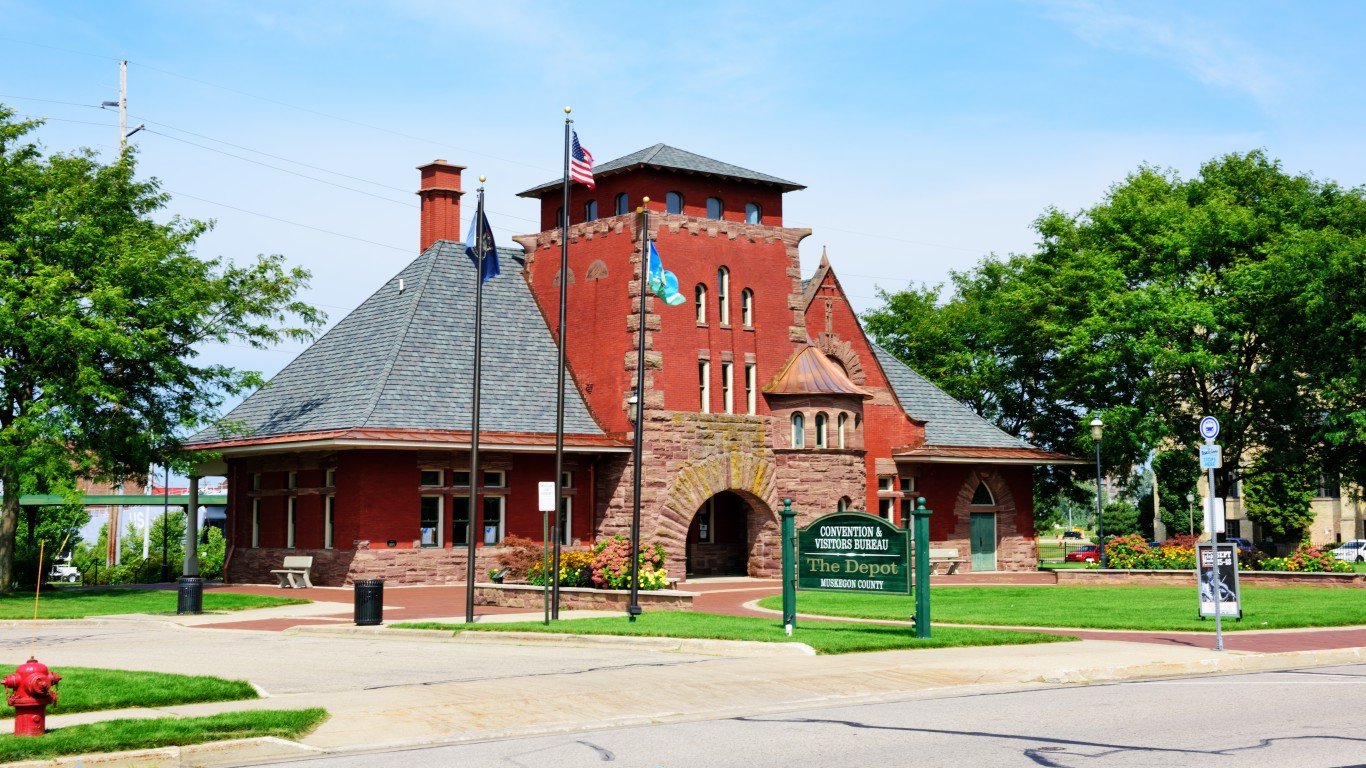
Michigan: Muskegon
> Smoking rate: 24.6% (Michigan: 20.1%)
> Adults reporting poor or fair health: 20.1% (Michigan: 18.3%)
> Premature deaths per 100,000: 408.1 (Michigan: 364.5)
> Life expectancy at birth (years): 77.03 (Michigan: 78.14)
[recirclink id=866911]

Minnesota: Duluth
> Smoking rate: 21.0% (Minnesota: 15.5%)
> Adults reporting poor or fair health: 14.3% (Minnesota: 12.9%)
> Premature deaths per 100,000: 327.4 (Minnesota: 266.7)
> Life expectancy at birth (years): 79.02 (Minnesota: 80.92)

Mississippi: Gulfport-Biloxi
> Smoking rate: 21.2% (Mississippi: 21.0%)
> Adults reporting poor or fair health: 21.3% (Mississippi: 22.1%)
> Premature deaths per 100,000: 474.3 (Mississippi: 501.8)
> Life expectancy at birth (years): 75.53 (Mississippi: 74.88)
[in-text-ad-2]
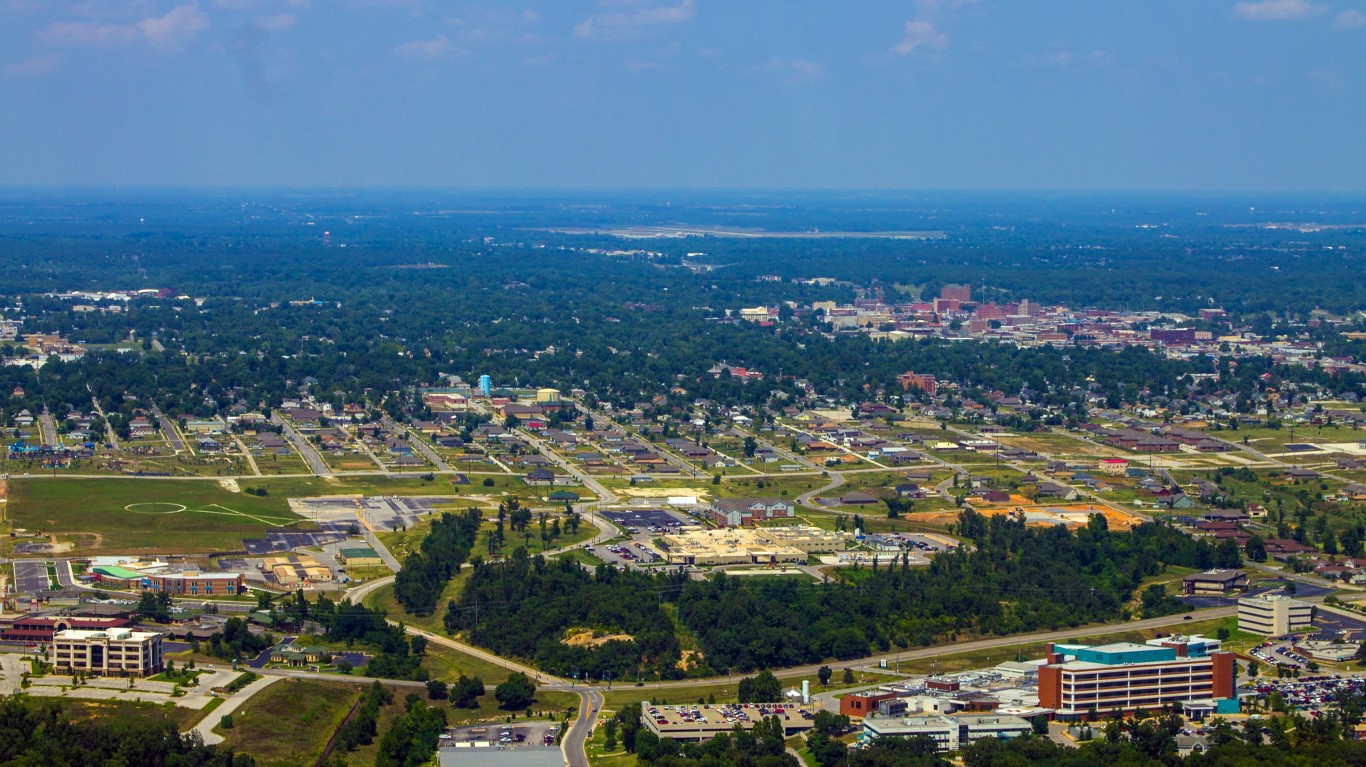
Missouri: Joplin
> Smoking rate: 23.3% (Missouri: 20.1%)
> Adults reporting poor or fair health: 21.4% (Missouri: 19.5%)
> Premature deaths per 100,000: 460.3 (Missouri: 403.6)
> Life expectancy at birth (years): 76.08 (Missouri: 77.30)

Montana: Great Falls
> Smoking rate: 20.5% (Montana: 18.9%)
> Adults reporting poor or fair health: 16.8% (Montana: 14.1%)
> Premature deaths per 100,000: 384.7 (Montana: 333.8)
> Life expectancy at birth (years): 77.73 (Montana: 78.91)
[in-text-ad]

Nebraska: Omaha-Council Bluffs
> Smoking rate: 17.2% (Nebraska: 16.6%)
> Adults reporting poor or fair health: 14.0% (Nebraska: 13.8%)
> Premature deaths per 100,000: 313.0 (Nebraska: 312.9)
> Life expectancy at birth (years): 79.47 (Nebraska: 79.57)
[recirclink id=952318]

Nevada: Carson City
> Smoking rate: 19.8% (Nevada: 15.7%)
> Adults reporting poor or fair health: 20.6% (Nevada: 19.1%)
> Premature deaths per 100,000: 491.8 (Nevada: 359.9)
> Life expectancy at birth (years): 74.96 (Nevada: 78.67)

New Hampshire: Manchester-Nashua*
> Smoking rate: 16.0% (New Hampshire: 16.6%)
> Adults reporting poor or fair health: 12.2% (New Hampshire: 12.8%)
> Premature deaths per 100,000: 309.3 (New Hampshire: 304.9)
> Life expectancy at birth (years): 79.63 (New Hampshire: 79.69)
*Because Manchester-Nashua is the only eligible metro in New Hampshire, it is the metro with the most smokers by default.
[in-text-ad-2]

New Jersey: Vineland-Bridgeton
> Smoking rate: 22.6% (New Jersey: 13.2%)
> Adults reporting poor or fair health: 25.2% (New Jersey: 15.5%)
> Premature deaths per 100,000: 482.6 (New Jersey: 292.0)
> Life expectancy at birth (years): 75.26 (New Jersey: 80.49)

New Mexico: Farmington
> Smoking rate: 23.5% (New Mexico: 15.9%)
> Adults reporting poor or fair health: 23.5% (New Mexico: 20.3%)
> Premature deaths per 100,000: 475.7 (New Mexico: 399.5)
> Life expectancy at birth (years): 75.96 (New Mexico: 77.98)
[in-text-ad]

New York: Elmira
> Smoking rate: 23.6% (New York: 13.0%)
> Adults reporting poor or fair health: 17.6% (New York: 16.3%)
> Premature deaths per 100,000: 421.8 (New York: 276.3)
> Life expectancy at birth (years): 76.49 (New York: 81.44)
[recirclink id=941091]

North Carolina: Hickory-Lenoir-Morganton
> Smoking rate: 22.6% (North Carolina: 17.9%)
> Adults reporting poor or fair health: 20.5% (North Carolina: 18.0%)
> Premature deaths per 100,000: 420.5 (North Carolina: 369.6)
> Life expectancy at birth (years): 76.72 (North Carolina: 78.13)

North Dakota: Grand Forks
> Smoking rate: 19.1% (North Dakota: 19.7%)
> Adults reporting poor or fair health: 15.7% (North Dakota: 13.6%)
> Premature deaths per 100,000: 343.6 (North Dakota: 319.7)
> Life expectancy at birth (years): 78.83 (North Dakota: 79.72)
[in-text-ad-2]
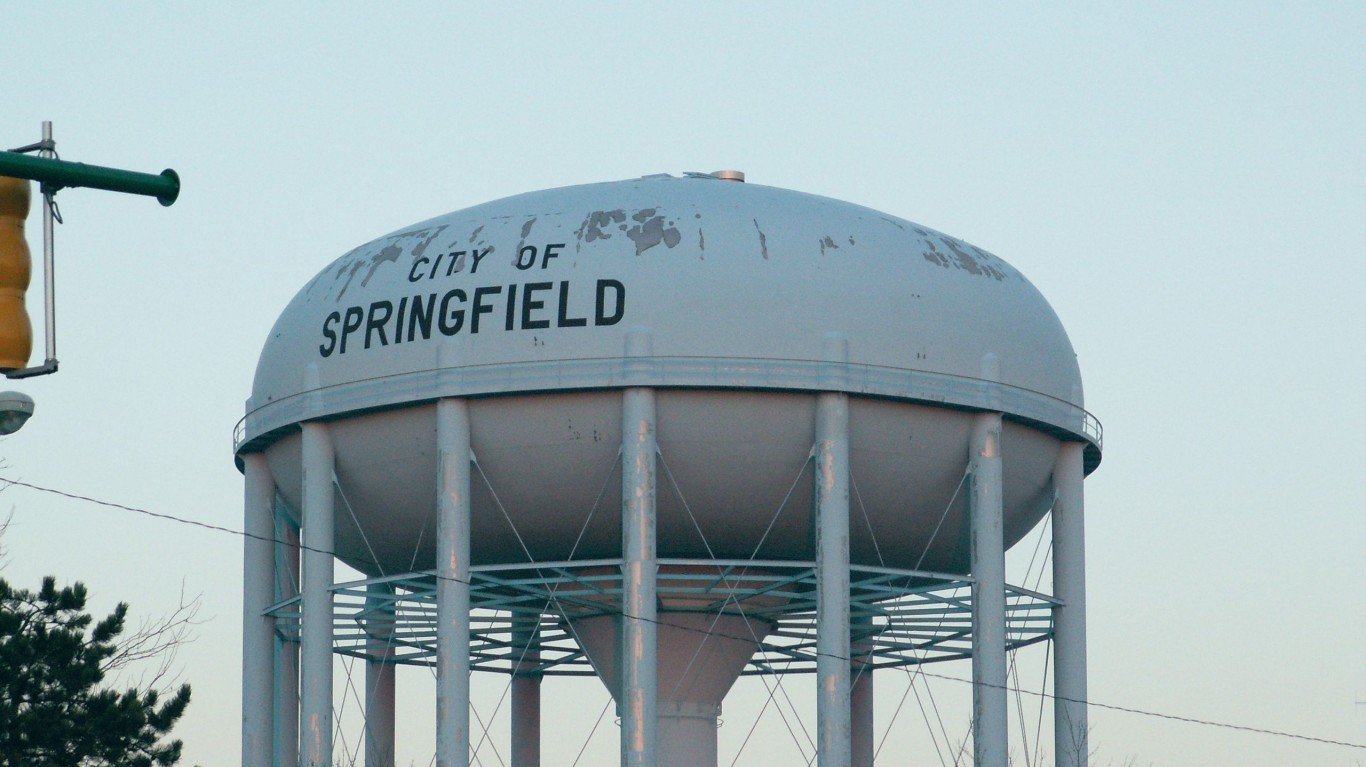
Ohio: Springfield
> Smoking rate: 26.2% (Ohio: 21.4%)
> Adults reporting poor or fair health: 20.9% (Ohio: 17.8%)
> Premature deaths per 100,000: 535.2 (Ohio: 406.8)
> Life expectancy at birth (years): 74.25 (Ohio: 76.98)

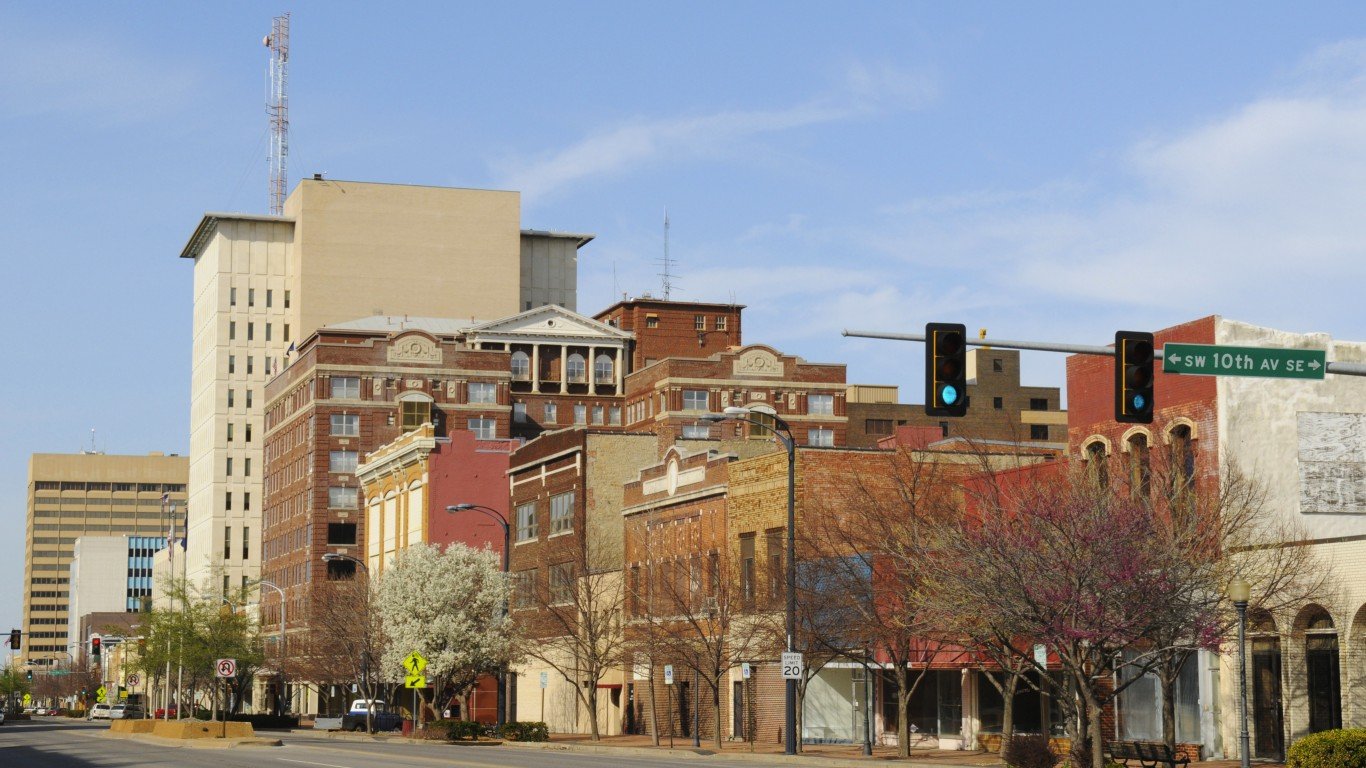
Oklahoma: Lawton
> Smoking rate: 21.7% (Oklahoma: 19.9%)
> Adults reporting poor or fair health: 22.2% (Oklahoma: 20.9%)
> Premature deaths per 100,000: 457.5 (Oklahoma: 456.6)
> Life expectancy at birth (years): 76.25 (Oklahoma: 76.05)
[in-text-ad]

Oregon: Grants Pass
> Smoking rate: 22.9% (Oregon: 15.7%)
> Adults reporting poor or fair health: 21.9% (Oregon: 18.2%)
> Premature deaths per 100,000: 430.8 (Oregon: 303.0)
> Life expectancy at birth (years): 76.58 (Oregon: 79.88)
[recirclink id=916524]

Pennsylvania: Altoona
> Smoking rate: 23.6% (Pennsylvania: 17.9%)
> Adults reporting poor or fair health: 18.4% (Pennsylvania: 17.6%)
> Premature deaths per 100,000: 395.3 (Pennsylvania: 354.5)
> Life expectancy at birth (years): 77.10 (Pennsylvania: 78.45)

Rhode Island: Providence-Warwick*
> Smoking rate: 18.0% (Rhode Island: 15.2%)
> Adults reporting poor or fair health: 16.8% (Rhode Island: 16.5%)
> Premature deaths per 100,000: 321.8 (Rhode Island: 304.4)
> Life expectancy at birth (years): 79.44 (Rhode Island: 79.84)
*Because Providence-Warwick is the only eligible metro in Rhode Island, it is the metro with the most smokers by default.
[in-text-ad-2]

South Carolina: Sumter
> Smoking rate: 21.0% (South Carolina: 18.7%)
> Adults reporting poor or fair health: 21.9% (South Carolina: 17.8%)
> Premature deaths per 100,000: 493.6 (South Carolina: 410.6)
> Life expectancy at birth (years): 75.31 (South Carolina: 77.12)

South Dakota: Rapid City
> Smoking rate: 18.8% (South Dakota: 20.2%)
> Adults reporting poor or fair health: 14.2% (South Dakota: 13.4%)
> Premature deaths per 100,000: 336.0 (South Dakota: 335.4)
> Life expectancy at birth (years): 79.18 (South Dakota: 78.91)
[in-text-ad]

Tennessee: Morristown
> Smoking rate: 26.2% (Tennessee: 20.8%)
> Adults reporting poor or fair health: 24.1% (Tennessee: 21.2%)
> Premature deaths per 100,000: 488.0 (Tennessee: 453.1)
> Life expectancy at birth (years): 75.42 (Tennessee: 75.98)
[recirclink id=939663]
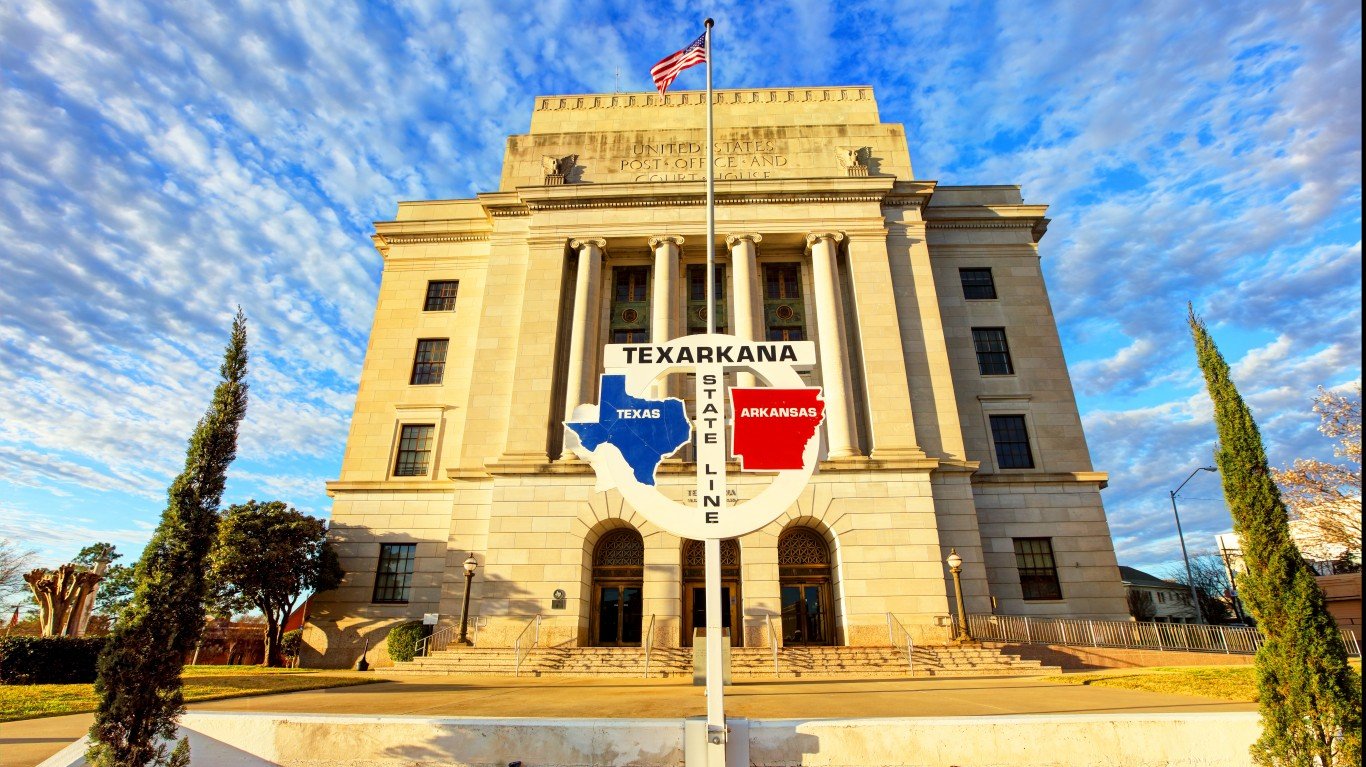
Texas: Texarkana
> Smoking rate: 22.0% (Texas: 14.2%)
> Adults reporting poor or fair health: 23.0% (Texas: 18.7%)
> Premature deaths per 100,000: 515.4 (Texas: 338.6)
> Life expectancy at birth (years): 74.93 (Texas: 79.17)

Utah: Salt Lake City
> Smoking rate: 11.2% (Utah: 9.1%)
> Adults reporting poor or fair health: 16.3% (Utah: 14.8%)
> Premature deaths per 100,000: 293.9 (Utah: 282.4)
> Life expectancy at birth (years): 79.68 (Utah: 80.07)
[in-text-ad-2]

Vermont: Burlington-South Burlington*
> Smoking rate: 13.6% (Vermont: 14.7%)
> Adults reporting poor or fair health: 11.8% (Vermont: 12.8%)
> Premature deaths per 100,000: 269.2 (Vermont: 302.2)
> Life expectancy at birth (years): 81.00 (Vermont: 79.83)
*Because Burlington-South Burlington is the only eligible metro in Vermont, it is the metro with the most smokers by default.

Virginia: Lynchburg
> Smoking rate: 20.3% (Virginia: 15.1%)
> Adults reporting poor or fair health: 18.7% (Virginia: 16.6%)
> Premature deaths per 100,000: 382.3 (Virginia: 320.0)
> Life expectancy at birth (years): 77.97 (Virginia: 79.55)
[in-text-ad]

Washington: Longview
> Smoking rate: 17.9% (Washington: 12.1%)
> Adults reporting poor or fair health: 19.5% (Washington: 15.0%)
> Premature deaths per 100,000: 416.3 (Washington: 288.1)
> Life expectancy at birth (years): 76.91 (Washington: 80.42)
[recirclink id=866911]

West Virginia: Beckley
> Smoking rate: 27.9% (West Virginia: 26.9%)
> Adults reporting poor or fair health: 25.6% (West Virginia: 23.6%)
> Premature deaths per 100,000: 611.4 (West Virginia: 504.8)
> Life expectancy at birth (years): 72.69 (West Virginia: 74.79)
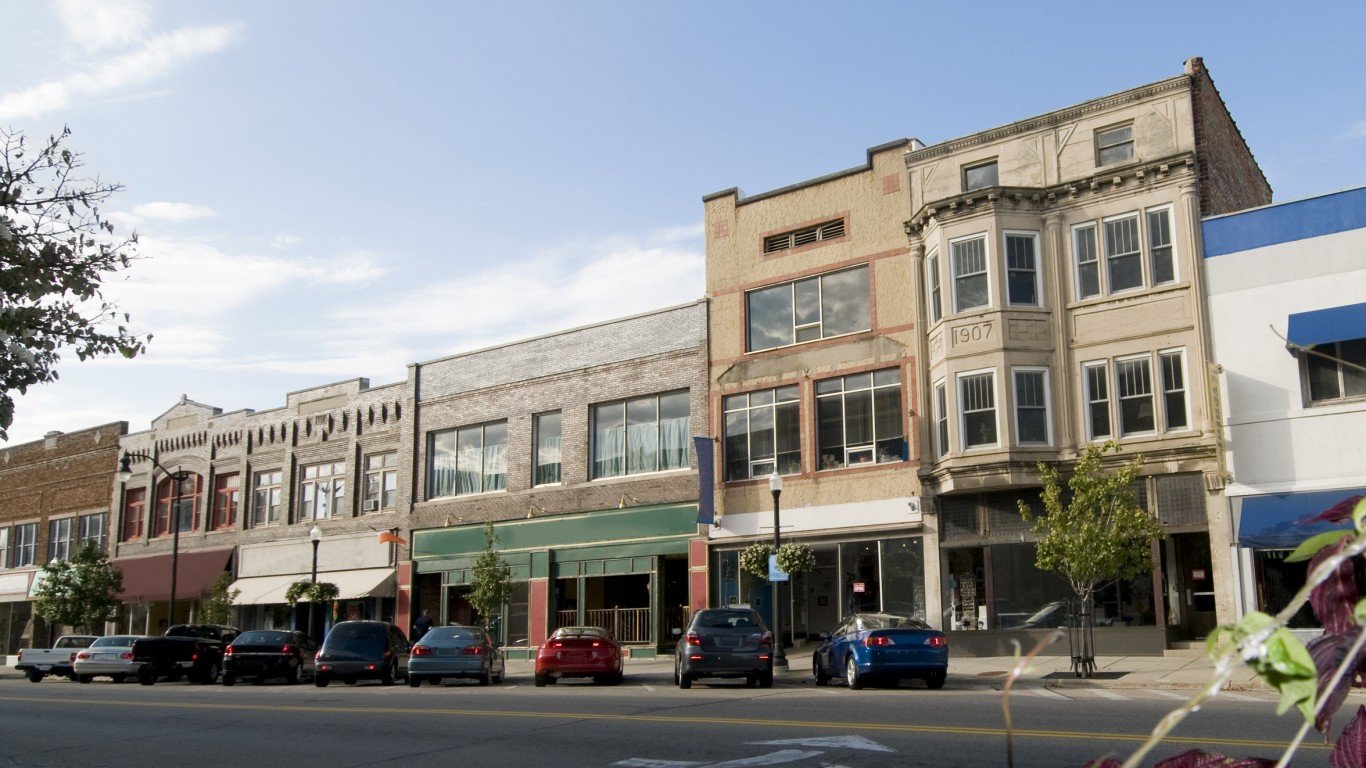
Wisconsin: Janesville-Beloit
> Smoking rate: 20.1% (Wisconsin: 17.2%)
> Adults reporting poor or fair health: 16.9% (Wisconsin: 14.8%)
> Premature deaths per 100,000: 355.6 (Wisconsin: 308.2)
> Life expectancy at birth (years): 78.20 (Wisconsin: 79.46)
[in-text-ad-2]

Wyoming: Casper
> Smoking rate: 21.8% (Wyoming: 19.2%)
> Adults reporting poor or fair health: 15.6% (Wyoming: 15.3%)
> Premature deaths per 100,000: 378.5 (Wyoming: 344.2)
> Life expectancy at birth (years): 77.58 (Wyoming: 78.91)
Methodology
To determine the metro area with the most smоkers in every state, 24/7 Tempo reviewed the share of adults who are current smоkers from the Robert Wood Johnson Foundation and the University of Wisconsin Population Health Institute joint program’s 2021 County Health Rankings & Roadmaps report. While the CHR report is from 2021, adult smоking rates are from 2018.
We used the 384 metropolitan statistical areas as delineated by the United States Office of Management and Budget and used by the Census Bureau as our definition of metros.
Metro areas were ranked within their state based on the adult smоking rate. Since many metros cross state lines, the metro was assigned to the state of its first-listed principal city. Thus, the Washington-Arlington-Alexandria, DC-VA-MD-WV metro area was excluded as it is principally in the District of Columbia.
Additional information on the share of adults reporting poor or fair health, the number of deaths among residents under age 75 per 100,000 (premature death rate), and average life expectancy at birth are also from the 2021 CHR.
Contact [email protected] for any questions or corrections.