
Life expectancy is one of the most important and commonly cited indicators of population health — and in the United States, life expectancy is falling at a historic rate. According to the Centers for Disease Control and Prevention, life expectancy at birth declined by 1.5 years in 2020, the largest one-year drop since World War II.
The CDC attributes the decline to the COVID-19 pandemic and 93,000 drug overdose deaths — an all-time one-year high. Homicide, diabetes, and liver disease were also contributing factors. Here is a look at the states with the most drug overdose deaths in 2020.
While the national trend is alarming, there are parts of the country where life expectancy is far higher than the national average. Using data from County Health Rankings & Roadmaps, a Robert Wood Johnson Foundation and University of Wisconsin Population Health Institute joint program, 24/7 Tempo identified the county with the longest life expectancy at birth in every state. It is important to note that life expectancy figures are averages for the years 2017 through 2019 — the most recent period for which county-level data is available — so they are pre-pandemic.
Though each county or county equivalent on this list has the longest life expectancy at birth in its state, average life expectancies vary considerably — from as low as 78.7 years up to well over 90. The comparable national average life expectancy stands at 79.2 years.
Variations in life expectancy are tied to a number of both economic and behavioral factors. For example, tobacco use is the leading cause of preventable death in the U.S., and in a majority of counties and county equivalents on this list, the share of adults who smoke is below the corresponding statewide average. Here is a look at the American cities where the most people smoke.
Income levels are also linked to life expectancy. Poverty, for example, presents challenges and stressors that can take a cumulative toll on both physical and mental health. Additionally, lower-income Americans are less able to afford adequate health care or a range of healthy options related to diet and lifestyle. Recent studies have shown that life expectancy among the wealthiest 1% of Americans exceeds that of the poorest 1% by well over a decade. In most counties on this list, the poverty rate is below the statewide poverty rate.
Click here to see the county with the longest life expectancy in every state
Click here to see our detailed methodology
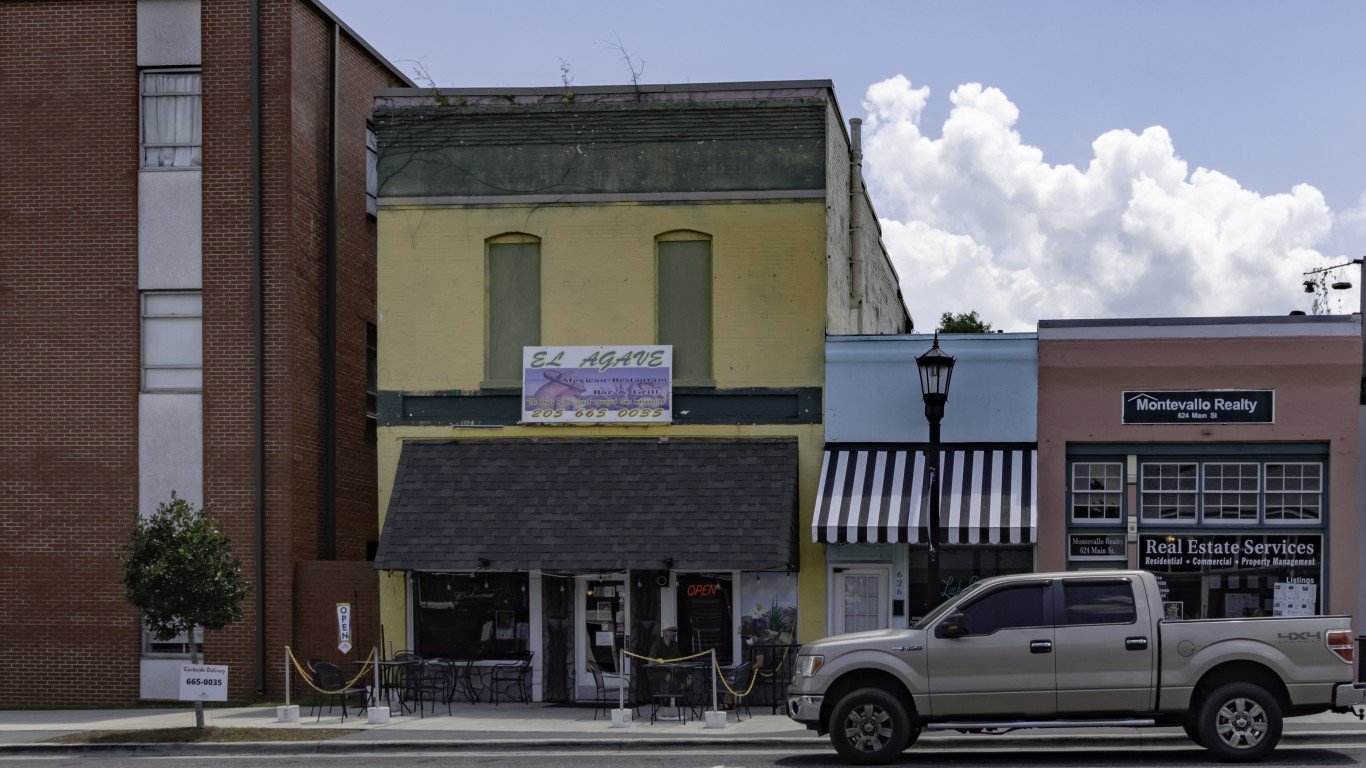
Alabama: Shelby County
> Life expectancy: 80.7 (Alabama: 75.6)
> Adults reporting poor or fair health: 14.8% (Alabama: 21.4%)
> Adult obesity rate: 37.7% (Alabama: 36.1%)
> Smoking rate: 15.0% (Alabama: 20.0%)
> Population without health insurance: 6.2% (Alabama: 9.5%)
> Median household income: $77,799 (Alabama: $50,536)
> Poverty rate: 7.5% (Alabama: 16.7%)
[in-text-ad]

Alaska: Haines Borough
> Life expectancy: 87.5 (Alaska: 79.0)
> Adults reporting poor or fair health: 13.4% (Alaska: 15.6%)
> Adult obesity rate: 29.1% (Alaska: 31.9%)
> Smoking rate: 17.9% (Alaska: 18.5%)
> Population without health insurance: 13.4% (Alaska: 13.6%)
> Median household income: $58,059 (Alaska: $77,640)
> Poverty rate: 11.3% (Alaska: 10.7%)
[recirclink id=968539]

Arizona: Santa Cruz County
> Life expectancy: 83.1 (Arizona: 80.0)
> Adults reporting poor or fair health: 27.8% (Arizona: 18.6%)
> Adult obesity rate: 30.1% (Arizona: 27.9%)
> Smoking rate: 15.7% (Arizona: 14.5%)
> Population without health insurance: 10.2% (Arizona: 10.4%)
> Median household income: $41,259 (Arizona: $58,945)
> Poverty rate: 23.3% (Arizona: 15.1%)

Arkansas: Benton County
> Life expectancy: 79.9 (Arkansas: 76.1)
> Adults reporting poor or fair health: 19.9% (Arkansas: 23.3%)
> Adult obesity rate: 31.1% (Arkansas: 35.0%)
> Smoking rate: 18.6% (Arkansas: 23.7%)
> Population without health insurance: 8.9% (Arkansas: 8.5%)
> Median household income: $66,362 (Arkansas: $47,597)
> Poverty rate: 9.4% (Arkansas: 17.0%)
[in-text-ad-2]

California: Marin County
> Life expectancy: 85.5 (California: 81.7)
> Adults reporting poor or fair health: 11.8% (California: 17.6%)
> Adult obesity rate: 17.6% (California: 24.3%)
> Smoking rate: 9.9% (California: 11.5%)
> Population without health insurance: 3.5% (California: 7.5%)
> Median household income: $115,246 (California: $75,235)
> Poverty rate: 7.2% (California: 13.4%)

Colorado: Summit County
> Life expectancy: 98.9 (Colorado: 80.6)
> Adults reporting poor or fair health: 11.9% (Colorado: 13.8%)
> Adult obesity rate: 15.4% (Colorado: 22.4%)
> Smoking rate: 14.5% (Colorado: 14.7%)
> Population without health insurance: 16.6% (Colorado: 7.6%)
> Median household income: $79,277 (Colorado: $72,331)
> Poverty rate: 8.0% (Colorado: 10.3%)
[in-text-ad]

Connecticut: Fairfield County
> Life expectancy: 83.0 (Connecticut: 80.9)
> Adults reporting poor or fair health: 11.9% (Connecticut: 13.0%)
> Adult obesity rate: 21.2% (Connecticut: 26.3%)
> Smoking rate: 11.7% (Connecticut: 12.5%)
> Population without health insurance: 8.4% (Connecticut: 5.3%)
> Median household income: $95,645 (Connecticut: $78,444)
> Poverty rate: 8.9% (Connecticut: 9.9%)
[recirclink id=935343]

Delaware: Sussex County
> Life expectancy: 78.7 (Delaware: 78.5)
> Adults reporting poor or fair health: 18.9% (Delaware: 16.3%)
> Adult obesity rate: 33.3% (Delaware: 32.4%)
> Smoking rate: 19.1% (Delaware: 17.4%)
> Population without health insurance: 6.7% (Delaware: 5.7%)
> Median household income: $63,162 (Delaware: $68,287)
> Poverty rate: 11.3% (Delaware: 11.8%)

Florida: Collier County
> Life expectancy: 86.1 (Florida: 80.2)
> Adults reporting poor or fair health: 18.3% (Florida: 19.5%)
> Adult obesity rate: 21.9% (Florida: 27.2%)
> Smoking rate: 16.0% (Florida: 14.9%)
> Population without health insurance: 15.4% (Florida: 12.8%)
> Median household income: $69,653 (Florida: $55,660)
> Poverty rate: 11.2% (Florida: 14.0%)
[in-text-ad-2]

Georgia: Echols County
> Life expectancy: 83.6 (Georgia: 77.9)
> Adults reporting poor or fair health: 26.2% (Georgia: 18.4%)
> Adult obesity rate: 34.3% (Georgia: 32.3%)
> Smoking rate: 23.2% (Georgia: 16.3%)
> Population without health insurance: 23.5% (Georgia: 13.2%)
> Median household income: $39,494 (Georgia: $58,700)
> Poverty rate: 24.1% (Georgia: 15.1%)

Hawaii: Maui County
> Life expectancy: 82.9 (Hawaii: 82.3)
> Adults reporting poor or fair health: 14.7% (Hawaii: 15.4%)
> Adult obesity rate: 24.6% (Hawaii: 24.6%)
> Smoking rate: 16.2% (Hawaii: 14.4%)
> Population without health insurance: 5.0% (Hawaii: 3.9%)
> Median household income: $80,948 (Hawaii: $81,275)
> Poverty rate: 9.3% (Hawaii: 9.4%)
[in-text-ad]

Idaho: Blaine County
> Life expectancy: 85.3 (Idaho: 79.4)
> Adults reporting poor or fair health: 16.1% (Idaho: 15.1%)
> Adult obesity rate: 16.5% (Idaho: 29.0%)
> Smoking rate: 15.3% (Idaho: 15.0%)
> Population without health insurance: 12.8% (Idaho: 10.6%)
> Median household income: $56,694 (Idaho: $55,785)
> Poverty rate: 12.5% (Idaho: 13.1%)
[recirclink id=952318]

Illinois: DuPage County
> Life expectancy: 82.5 (Illinois: 79.4)
> Adults reporting poor or fair health: 12.0% (Illinois: 15.9%)
> Adult obesity rate: 26.3% (Illinois: 29.7%)
> Smoking rate: 14.2% (Illinois: 15.9%)
> Population without health insurance: 5.3% (Illinois: 6.8%)
> Median household income: $92,809 (Illinois: $65,886)
> Poverty rate: 6.4% (Illinois: 12.5%)

Indiana: Hamilton County
> Life expectancy: 82.0 (Indiana: 77.1)
> Adults reporting poor or fair health: 12.0% (Indiana: 18.2%)
> Adult obesity rate: 25.7% (Indiana: 33.9%)
> Smoking rate: 13.9% (Indiana: 21.7%)
> Population without health insurance: 4.4% (Indiana: 8.4%)
> Median household income: $98,173 (Indiana: $56,303)
> Poverty rate: 4.6% (Indiana: 13.4%)
[in-text-ad-2]

Iowa: Sioux County
> Life expectancy: 83.9 (Iowa: 79.4)
> Adults reporting poor or fair health: 12.3% (Iowa: 13.5%)
> Adult obesity rate: 28.4% (Iowa: 34.3%)
> Smoking rate: 17.1% (Iowa: 17.4%)
> Population without health insurance: 4.2% (Iowa: 4.7%)
> Median household income: $69,844 (Iowa: $60,523)
> Poverty rate: 6.3% (Iowa: 11.5%)
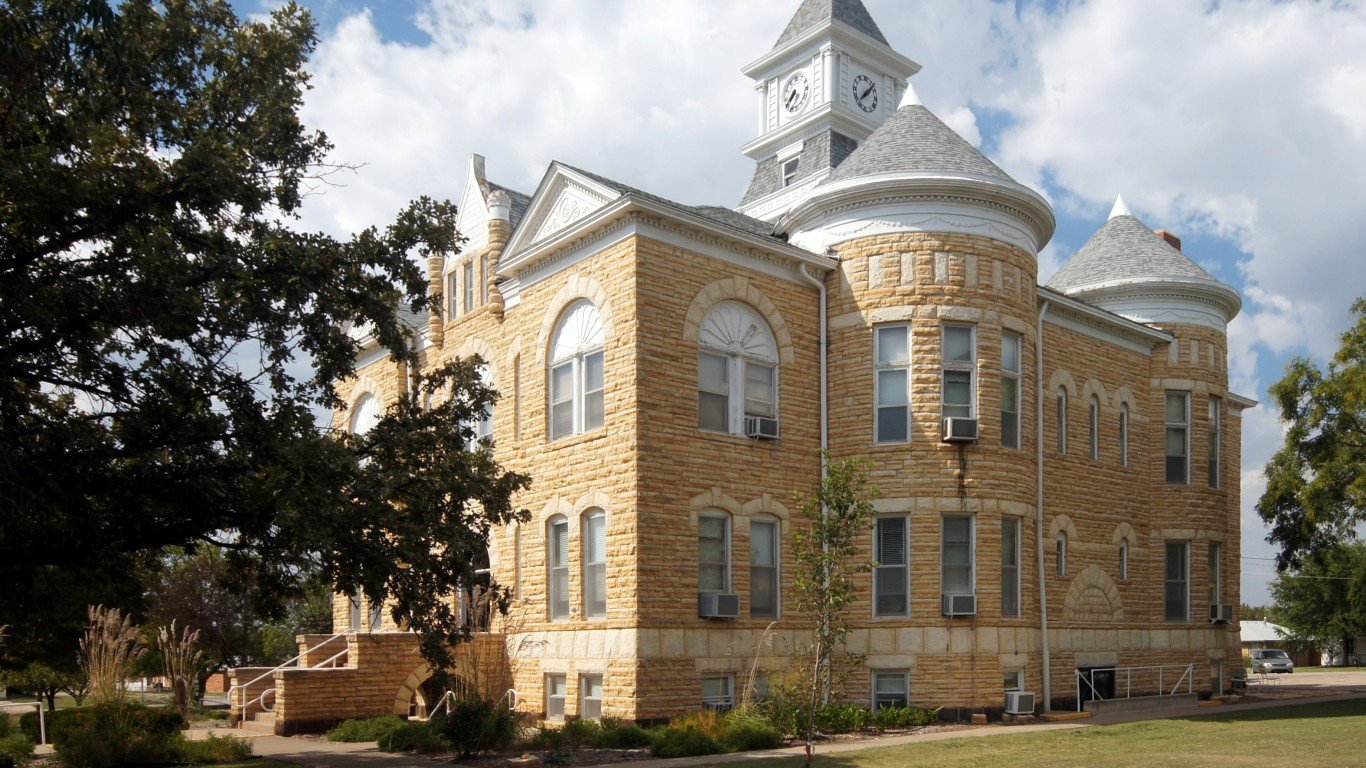
Kansas: Lincoln County
> Life expectancy: 82.6 (Kansas: 78.5)
> Adults reporting poor or fair health: 15.5% (Kansas: 16.3%)
> Adult obesity rate: 31.2% (Kansas: 33.0%)
> Smoking rate: 19.9% (Kansas: 17.9%)
> Population without health insurance: 8.7% (Kansas: 8.8%)
> Median household income: $45,076 (Kansas: $59,597)
> Poverty rate: 9.2% (Kansas: 12.0%)
[in-text-ad]

Kentucky: Oldham County
> Life expectancy: 79.8 (Kentucky: 75.6)
> Adults reporting poor or fair health: 14.8% (Kentucky: 21.8%)
> Adult obesity rate: 22.7% (Kentucky: 34.6%)
> Smoking rate: 16.4% (Kentucky: 24.1%)
> Population without health insurance: 3.5% (Kentucky: 5.7%)
> Median household income: $99,128 (Kentucky: $50,589)
> Poverty rate: 5.9% (Kentucky: 17.3%)
[recirclink id=941091]

Louisiana: Cameron Parish
> Life expectancy: 81.7 (Louisiana: 76.1)
> Adults reporting poor or fair health: 20.7% (Louisiana: 21.4%)
> Adult obesity rate: 39.1% (Louisiana: 36.3%)
> Smoking rate: 24.3% (Louisiana: 21.1%)
> Population without health insurance: 9.7% (Louisiana: 9.5%)
> Median household income: $53,423 (Louisiana: $49,469)
> Poverty rate: 9.9% (Louisiana: 19.2%)

Maine: Lincoln County
> Life expectancy: 80.2 (Maine: 78.7)
> Adults reporting poor or fair health: 14.5% (Maine: 17.1%)
> Adult obesity rate: 25.4% (Maine: 29.8%)
> Smoking rate: 18.5% (Maine: 19.4%)
> Population without health insurance: 10.0% (Maine: 7.9%)
> Median household income: $57,720 (Maine: $57,918)
> Poverty rate: 12.3% (Maine: 11.8%)
[in-text-ad-2]

Maryland: Montgomery County
> Life expectancy: 84.6 (Maryland: 79.2)
> Adults reporting poor or fair health: 12.3% (Maryland: 15.2%)
> Adult obesity rate: 21.9% (Maryland: 31.6%)
> Smoking rate: 9.2% (Maryland: 12.6%)
> Population without health insurance: 7.1% (Maryland: 6.1%)
> Median household income: $108,820 (Maryland: $84,805)
> Poverty rate: 6.8% (Maryland: 9.2%)

Massachusetts: Nantucket County
> Life expectancy: 83.3 (Massachusetts: 80.6)
> Adults reporting poor or fair health: 12.0% (Massachusetts: 13.5%)
> Adult obesity rate: 25.1% (Massachusetts: 25.0%)
> Smoking rate: 13.2% (Massachusetts: 13.7%)
> Population without health insurance: 4.4% (Massachusetts: 2.7%)
> Median household income: $107,717 (Massachusetts: $81,215)
> Poverty rate: 8.7% (Massachusetts: 10.3%)
[in-text-ad]

Michigan: Leelanau County
> Life expectancy: 82.7 (Michigan: 78.1)
> Adults reporting poor or fair health: 13.5% (Michigan: 18.3%)
> Adult obesity rate: 26.8% (Michigan: 32.4%)
> Smoking rate: 17.1% (Michigan: 20.1%)
> Population without health insurance: 5.2% (Michigan: 5.5%)
> Median household income: $65,249 (Michigan: $57,144)
> Poverty rate: 6.1% (Michigan: 14.4%)
[recirclink id=916524]

Minnesota: Carver County
> Life expectancy: 83.3 (Minnesota: 80.9)
> Adults reporting poor or fair health: 9.9% (Minnesota: 12.9%)
> Adult obesity rate: 26.2% (Minnesota: 29.0%)
> Smoking rate: 12.9% (Minnesota: 15.5%)
> Population without health insurance: 3.0% (Minnesota: 4.5%)
> Median household income: $101,496 (Minnesota: $71,306)
> Poverty rate: 4.1% (Minnesota: 9.7%)

Mississippi: Lamar County
> Life expectancy: 79.9 (Mississippi: 74.9)
> Adults reporting poor or fair health: 17.4% (Mississippi: 22.1%)
> Adult obesity rate: 36.0% (Mississippi: 39.1%)
> Smoking rate: 18.0% (Mississippi: 21.0%)
> Population without health insurance: 13.2% (Mississippi: 12.3%)
> Median household income: $60,328 (Mississippi: $45,081)
> Poverty rate: 18.3% (Mississippi: 20.3%)
[in-text-ad-2]

Missouri: Ralls County
> Life expectancy: 80.9 (Missouri: 77.3)
> Adults reporting poor or fair health: 20.0% (Missouri: 19.5%)
> Adult obesity rate: 26.3% (Missouri: 32.5%)
> Smoking rate: 23.2% (Missouri: 20.1%)
> Population without health insurance: 8.3% (Missouri: 9.3%)
> Median household income: $55,377 (Missouri: $55,461)
> Poverty rate: 13.7% (Missouri: 13.7%)

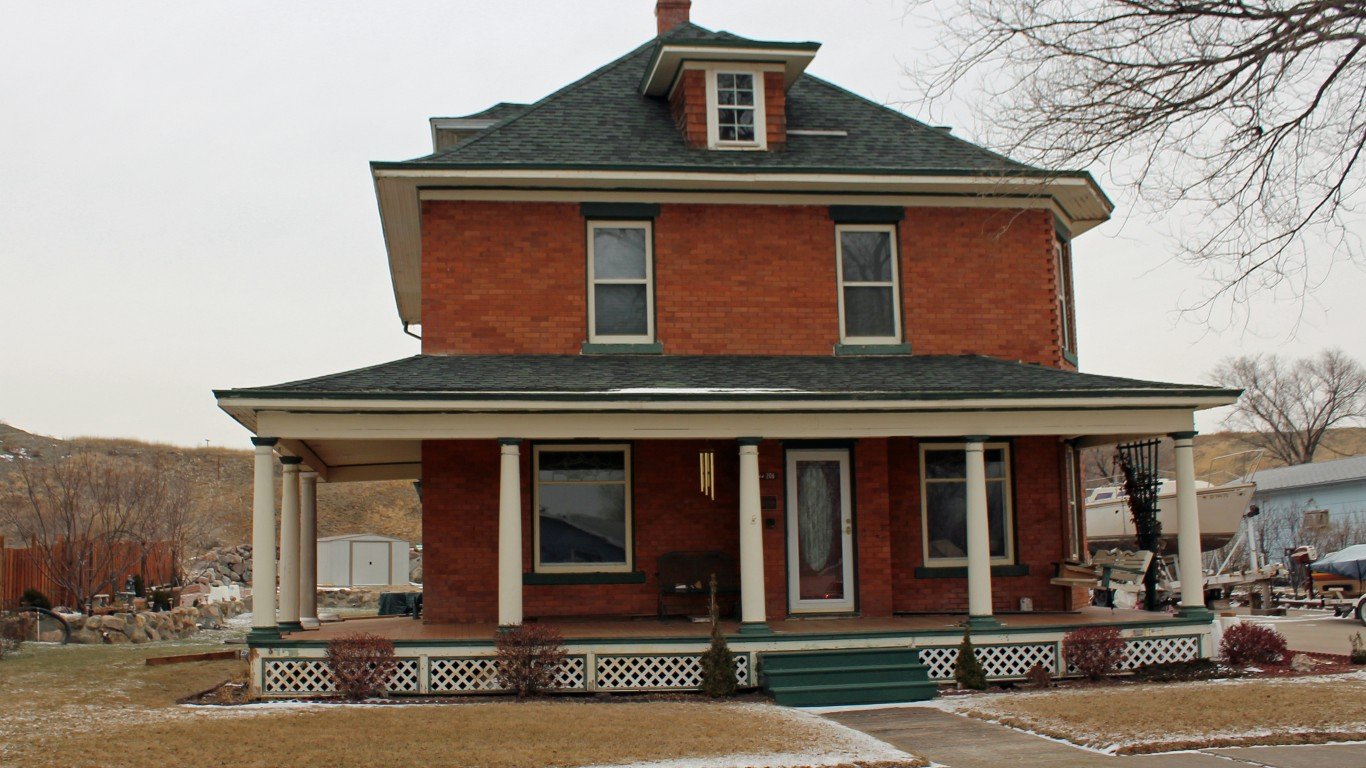
Montana: Liberty County
> Life expectancy: 91.2 (Montana: 78.9)
> Adults reporting poor or fair health: 19.0% (Montana: 14.1%)
> Adult obesity rate: 37.0% (Montana: 27.1%)
> Smoking rate: 23.5% (Montana: 18.9%)
> Population without health insurance: 8.6% (Montana: 9.0%)
> Median household income: $44,875 (Montana: $54,970)
> Poverty rate: 16.2% (Montana: 13.1%)
[in-text-ad]

Nebraska: Frontier County
> Life expectancy: 85.5 (Nebraska: 79.6)
> Adults reporting poor or fair health: 13.5% (Nebraska: 13.8%)
> Adult obesity rate: 38.9% (Nebraska: 33.4%)
> Smoking rate: 17.0% (Nebraska: 16.6%)
> Population without health insurance: 9.6% (Nebraska: 8.2%)
> Median household income: $54,659 (Nebraska: $61,439)
> Poverty rate: 9.0% (Nebraska: 11.1%)
[recirclink id=968539]

Nevada: Lincoln County
> Life expectancy: 83.1 (Nevada: 78.7)
> Adults reporting poor or fair health: 18.1% (Nevada: 19.1%)
> Adult obesity rate: 27.6% (Nevada: 27.1%)
> Smoking rate: 20.8% (Nevada: 15.7%)
> Population without health insurance: 9.4% (Nevada: 11.1%)
> Median household income: $58,462 (Nevada: $60,365)
> Poverty rate: 5.5% (Nevada: 13.1%)

New Hampshire: Rockingham County
> Life expectancy: 80.9 (New Hampshire: 79.7)
> Adults reporting poor or fair health: 11.5% (New Hampshire: 12.8%)
> Adult obesity rate: 27.2% (New Hampshire: 28.6%)
> Smoking rate: 14.2% (New Hampshire: 16.6%)
> Population without health insurance: 4.4% (New Hampshire: 5.9%)
> Median household income: $93,756 (New Hampshire: $76,768)
> Poverty rate: 4.6% (New Hampshire: 7.6%)
[in-text-ad-2]

New Jersey: Hunterdon County
> Life expectancy: 83.6 (New Jersey: 80.5)
> Adults reporting poor or fair health: 12.3% (New Jersey: 15.5%)
> Adult obesity rate: 22.3% (New Jersey: 27.0%)
> Smoking rate: 12.9% (New Jersey: 13.2%)
> Population without health insurance: 2.6% (New Jersey: 7.8%)
> Median household income: $115,379 (New Jersey: $82,545)
> Poverty rate: 4.5% (New Jersey: 10.0%)

New Mexico: Los Alamos County
> Life expectancy: 83.8 (New Mexico: 78.0)
> Adults reporting poor or fair health: 9.4% (New Mexico: 20.3%)
> Adult obesity rate: 23.4% (New Mexico: 27.3%)
> Smoking rate: 9.6% (New Mexico: 15.9%)
> Population without health insurance: 3.2% (New Mexico: 9.6%)
> Median household income: $121,324 (New Mexico: $49,754)
> Poverty rate: 4.4% (New Mexico: 19.1%)
[in-text-ad]

New York: New York County
> Life expectancy: 85.3 (New York: 81.4)
> Adults reporting poor or fair health: 15.6% (New York: 16.3%)
> Adult obesity rate: 15.6% (New York: 26.4%)
> Smoking rate: 11.9% (New York: 13.0%)
> Population without health insurance: 5.2% (New York: 5.8%)
> Median household income: $86,553 (New York: $68,486)
> Poverty rate: 15.8% (New York: 14.1%)
[recirclink id=935343]

North Carolina: Orange County
> Life expectancy: 82.3 (North Carolina: 78.1)
> Adults reporting poor or fair health: 13.8% (North Carolina: 18.0%)
> Adult obesity rate: 21.8% (North Carolina: 32.3%)
> Smoking rate: 15.1% (North Carolina: 17.9%)
> Population without health insurance: 7.0% (North Carolina: 10.7%)
> Median household income: $71,723 (North Carolina: $54,602)
> Poverty rate: 13.7% (North Carolina: 14.7%)

North Dakota: Golden Valley County
> Life expectancy: 90.6 (North Dakota: 79.7)
> Adults reporting poor or fair health: 14.6% (North Dakota: 13.6%)
> Adult obesity rate: 29.2% (North Dakota: 33.9%)
> Smoking rate: 19.1% (North Dakota: 19.7%)
> Population without health insurance: 9.1% (North Dakota: 7.4%)
> Median household income: $58,690 (North Dakota: $64,894)
> Poverty rate: 7.5% (North Dakota: 10.7%)
[in-text-ad-2]

Ohio: Delaware County
> Life expectancy: 82.3 (Ohio: 77.0)
> Adults reporting poor or fair health: 11.8% (Ohio: 17.8%)
> Adult obesity rate: 29.6% (Ohio: 33.5%)
> Smoking rate: 15.3% (Ohio: 21.4%)
> Population without health insurance: 3.7% (Ohio: 6.1%)
> Median household income: $106,908 (Ohio: $56,602)
> Poverty rate: 4.8% (Ohio: 14.0%)

Oklahoma: Cimarron County
> Life expectancy: 81.1 (Oklahoma: 76.1)
> Adults reporting poor or fair health: 22.1% (Oklahoma: 20.9%)
> Adult obesity rate: 26.9% (Oklahoma: 34.5%)
> Smoking rate: 21.2% (Oklahoma: 19.9%)
> Population without health insurance: 14.8% (Oklahoma: 14.1%)
> Median household income: $46,328 (Oklahoma: $52,919)
> Poverty rate: 16.8% (Oklahoma: 15.7%)
[in-text-ad]

Oregon: Gilliam County
> Life expectancy: 84.6 (Oregon: 79.9)
> Adults reporting poor or fair health: 18.7% (Oregon: 18.2%)
> Adult obesity rate: 31.1% (Oregon: 29.3%)
> Smoking rate: 19.5% (Oregon: 15.7%)
> Population without health insurance: 7.0% (Oregon: 6.7%)
> Median household income: $47,500 (Oregon: $62,818)
> Poverty rate: 10.4% (Oregon: 13.2%)
[recirclink id=952318]

Pennsylvania: Centre County
> Life expectancy: 83.0 (Pennsylvania: 78.5)
> Adults reporting poor or fair health: 16.0% (Pennsylvania: 17.6%)
> Adult obesity rate: 24.0% (Pennsylvania: 30.8%)
> Smoking rate: 18.5% (Pennsylvania: 17.9%)
> Population without health insurance: 5.6% (Pennsylvania: 5.7%)
> Median household income: $60,403 (Pennsylvania: $61,744)
> Poverty rate: 18.2% (Pennsylvania: 12.4%)

Rhode Island: Newport County
> Life expectancy: 81.6 (Rhode Island: 79.8)
> Adults reporting poor or fair health: 12.1% (Rhode Island: 16.5%)
> Adult obesity rate: 25.4% (Rhode Island: 28.5%)
> Smoking rate: 14.9% (Rhode Island: 15.2%)
> Population without health insurance: 3.8% (Rhode Island: 4.5%)
> Median household income: $79,454 (Rhode Island: $67,167)
> Poverty rate: 8.7% (Rhode Island: 12.4%)
[in-text-ad-2]

South Carolina: Beaufort County
> Life expectancy: 82.9 (South Carolina: 77.1)
> Adults reporting poor or fair health: 14.4% (South Carolina: 17.8%)
> Adult obesity rate: 25.0% (South Carolina: 34.0%)
> Smoking rate: 16.4% (South Carolina: 18.7%)
> Population without health insurance: 10.7% (South Carolina: 10.5%)
> Median household income: $68,377 (South Carolina: $53,199)
> Poverty rate: 10.2% (South Carolina: 15.2%)
South Dakota: Stanley County
> Life expectancy: 89.2 (South Dakota: 78.9)
> Adults reporting poor or fair health: 10.9% (South Dakota: 13.4%)
> Adult obesity rate: 25.9% (South Dakota: 32.4%)
> Smoking rate: 16.1% (South Dakota: 20.2%)
> Population without health insurance: 3.8% (South Dakota: 9.5%)
> Median household income: $71,382 (South Dakota: $58,275)
> Poverty rate: 4.7% (South Dakota: 13.1%)
[in-text-ad]

Tennessee: Williamson County
> Life expectancy: 81.7 (Tennessee: 76.0)
> Adults reporting poor or fair health: 12.2% (Tennessee: 21.2%)
> Adult obesity rate: 22.5% (Tennessee: 33.3%)
> Smoking rate: 13.9% (Tennessee: 20.8%)
> Population without health insurance: 4.5% (Tennessee: 9.7%)
> Median household income: $112,962 (Tennessee: $53,320)
> Poverty rate: 4.4% (Tennessee: 15.2%)
[recirclink id=941091]
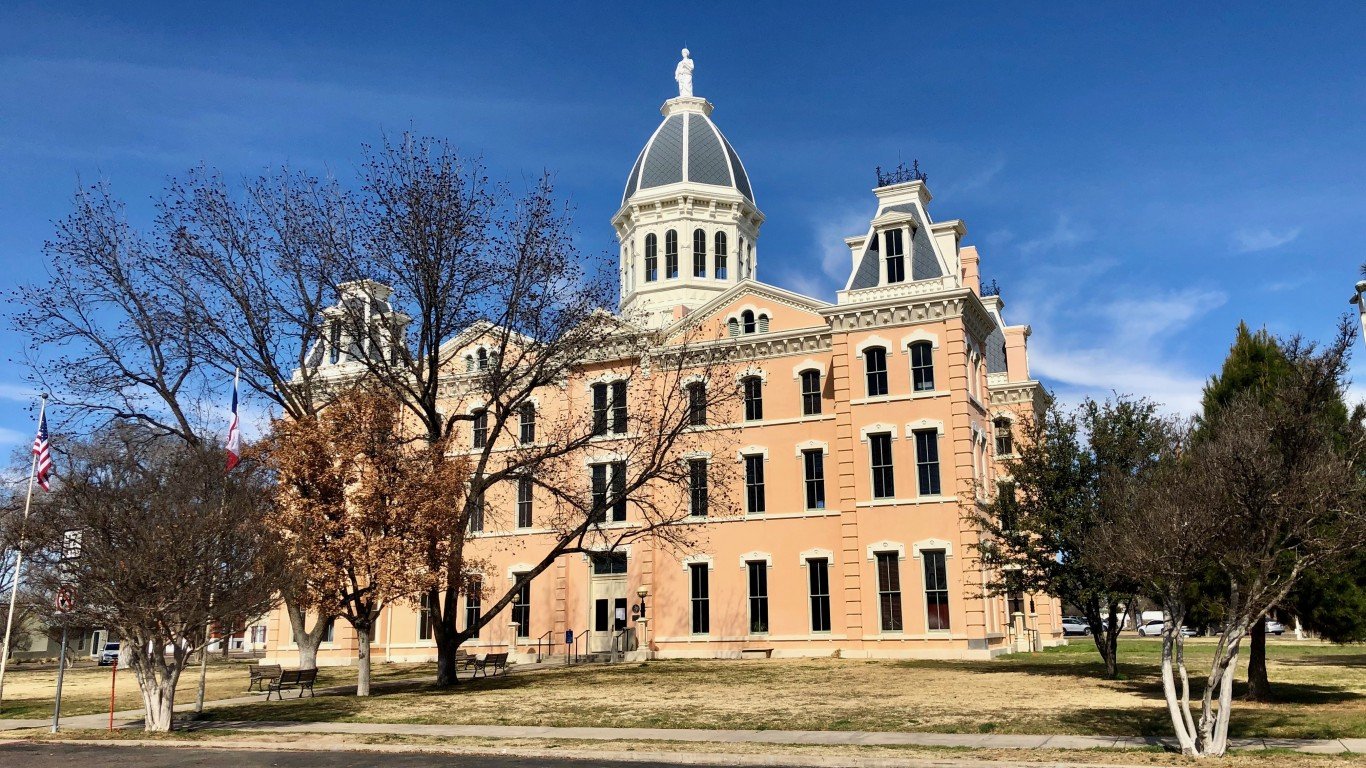
Texas: Presidio County
> Life expectancy: 88.8 (Texas: 79.2)
> Adults reporting poor or fair health: 39.9% (Texas: 18.7%)
> Adult obesity rate: 30.0% (Texas: 31.4%)
> Smoking rate: 21.9% (Texas: 14.2%)
> Population without health insurance: 26.1% (Texas: 17.2%)
> Median household income: $25,098 (Texas: $61,874)
> Poverty rate: 39.0% (Texas: 14.7%)

Utah: Summit County
> Life expectancy: 85.1 (Utah: 80.1)
> Adults reporting poor or fair health: 10.9% (Utah: 14.8%)
> Adult obesity rate: 14.5% (Utah: 27.0%)
> Smoking rate: 8.3% (Utah: 9.1%)
> Population without health insurance: 6.7% (Utah: 9.4%)
> Median household income: $102,958 (Utah: $71,621)
> Poverty rate: 5.6% (Utah: 9.8%)
[in-text-ad-2]

Vermont: Chittenden County
> Life expectancy: 81.8 (Vermont: 79.8)
> Adults reporting poor or fair health: 11.2% (Vermont: 12.8%)
> Adult obesity rate: 22.4% (Vermont: 27.0%)
> Smoking rate: 12.5% (Vermont: 14.7%)
> Population without health insurance: 3.1% (Vermont: 4.0%)
> Median household income: $73,647 (Vermont: $61,973)
> Poverty rate: 12.1% (Vermont: 10.9%)
Virginia: Manassas Park city
> Life expectancy: 86.5 (Virginia: 79.6)
> Adults reporting poor or fair health: 20.4% (Virginia: 16.6%)
> Adult obesity rate: 28.3% (Virginia: 30.5%)
> Smoking rate: 16.7% (Virginia: 15.1%)
> Population without health insurance: 17.1% (Virginia: 8.6%)
> Median household income: $88,046 (Virginia: $74,222)
> Poverty rate: 6.4% (Virginia: 10.6%)
[in-text-ad]

Washington: San Juan County
> Life expectancy: 86.2 (Washington: 80.4)
> Adults reporting poor or fair health: 13.0% (Washington: 15.0%)
> Adult obesity rate: 20.1% (Washington: 28.6%)
> Smoking rate: 11.6% (Washington: 12.1%)
> Population without health insurance: 6.4% (Washington: 6.3%)
> Median household income: $63,622 (Washington: $73,775)
> Poverty rate: 10.2% (Washington: 10.8%)
[recirclink id=916524]

West Virginia: Doddridge County
> Life expectancy: 80.6 (West Virginia: 74.8)
> Adults reporting poor or fair health: 23.4% (West Virginia: 23.6%)
> Adult obesity rate: 37.6% (West Virginia: 37.8%)
> Smoking rate: 26.0% (West Virginia: 26.9%)
> Population without health insurance: 7.2% (West Virginia: 6.0%)
> Median household income: $45,545 (West Virginia: $46,711)
> Poverty rate: 15.7% (West Virginia: 17.6%)

Wisconsin: Pepin County
> Life expectancy: 82.9 (Wisconsin: 79.5)
> Adults reporting poor or fair health: 16.3% (Wisconsin: 14.8%)
> Adult obesity rate: 27.2% (Wisconsin: 31.7%)
> Smoking rate: 21.1% (Wisconsin: 17.2%)
> Population without health insurance: 7.7% (Wisconsin: 5.4%)
> Median household income: $54,583 (Wisconsin: $61,747)
> Poverty rate: 10.5% (Wisconsin: 11.3%)
[in-text-ad-2]

Wyoming: Teton County
> Life expectancy: 87.5 (Wyoming: 78.9)
> Adults reporting poor or fair health: 11.4% (Wyoming: 15.3%)
> Adult obesity rate: 11.0% (Wyoming: 29.2%)
> Smoking rate: 12.9% (Wyoming: 19.2%)
> Population without health insurance: 12.7% (Wyoming: 11.4%)
> Median household income: $84,678 (Wyoming: $64,049)
> Poverty rate: 6.1% (Wyoming: 11.0%)
Methodology
To determine the county with the longest life expectancy in every state, 24/7 Tempo reviewed life expectancy — the average number of years a person can expect to live — data from the Robert Wood Johnson Foundation and the University of Wisconsin Population Health Institute joint program’s 2021 County Health Rankings & Roadmaps report. While the CHR report is from 2021, life expectancy data published in the report are from 2017-2019.
Of the 3,220 counties or county equivalents, 3,141 had boundaries that fell within one of the 50 states, while the rest were in the District of Columbia or Puerto Rico. Counties were excluded if life expectancy data was unavailable, if the confidence interval for the estimate was deemed too large, or if the county’s 2019 five-year population estimate from the U.S. Census Bureau was less than 1,000.
The remaining 3,069 places were ranked within their state based on life expectancy. Additional information on the share of adults reporting poor or fair health, the share of adults 20 years and older who report a body mass index of 30 kg/m2 or higher (adult obesity rate), and the share of adults who are current smokers are also from the 2021 CHR. The share of the civilian noninstitutionalized population without health insurance, median household income, and poverty rates are five-year estimates from the U.S. Census Bureau’s 2019 American Community Survey.
Contact [email protected] for any questions or corrections.