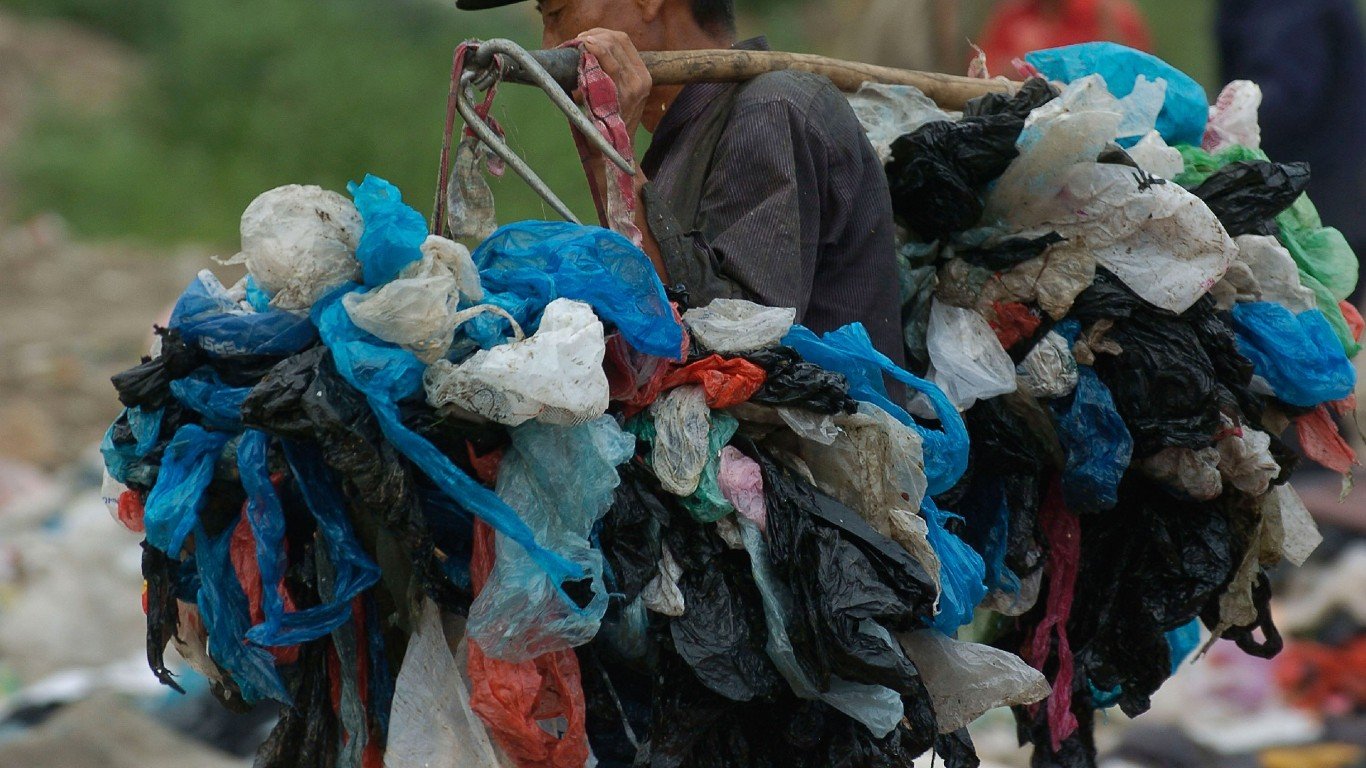
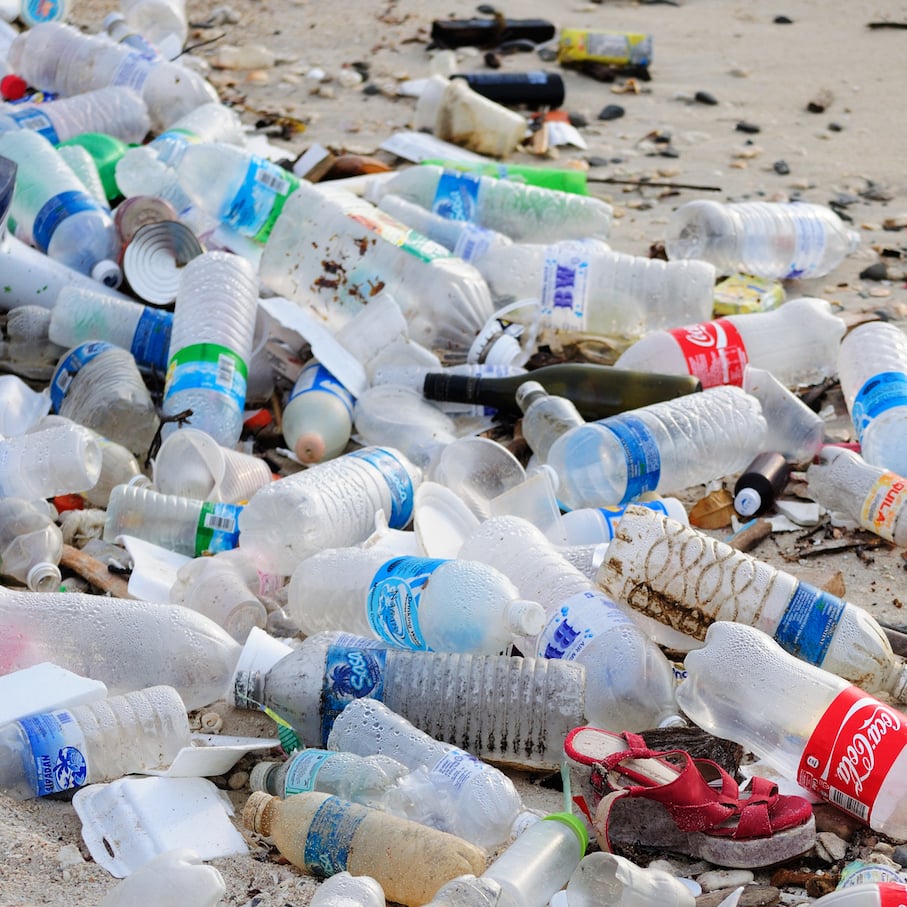
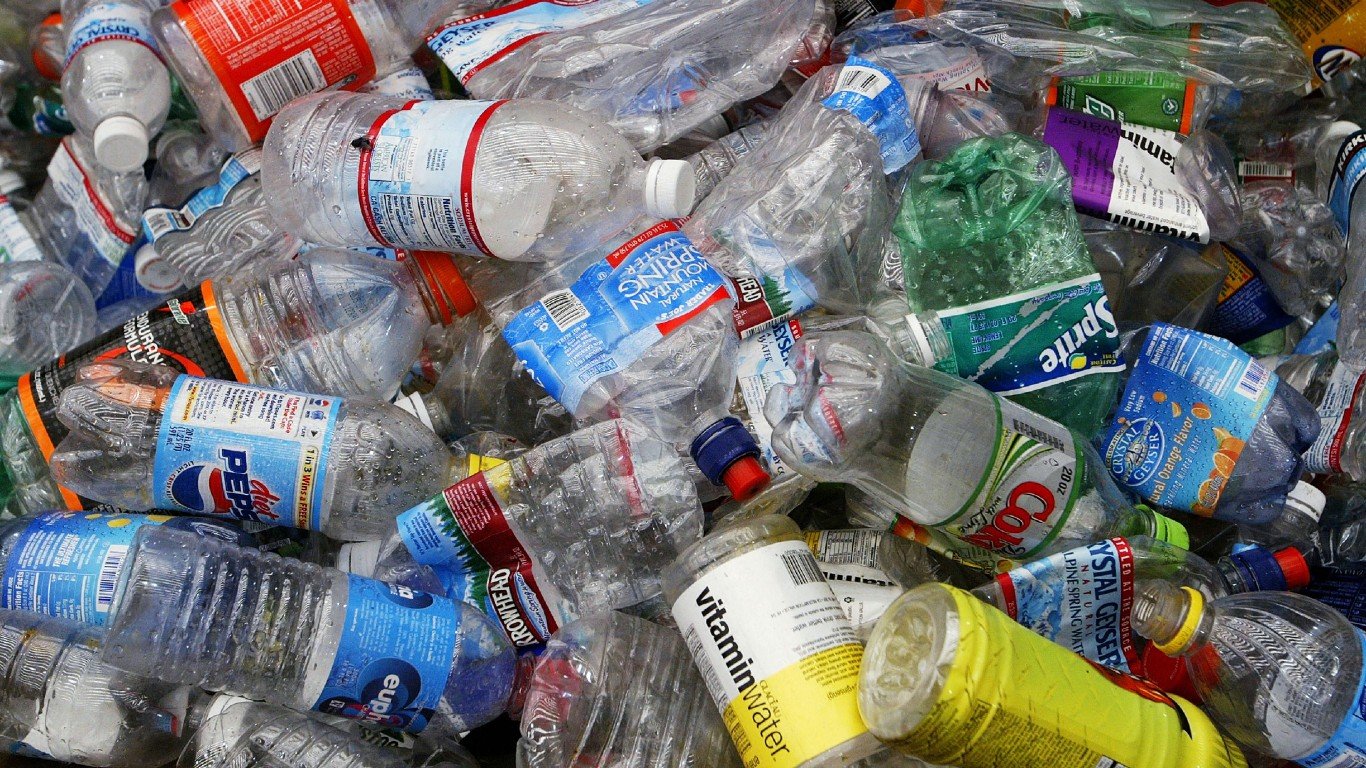
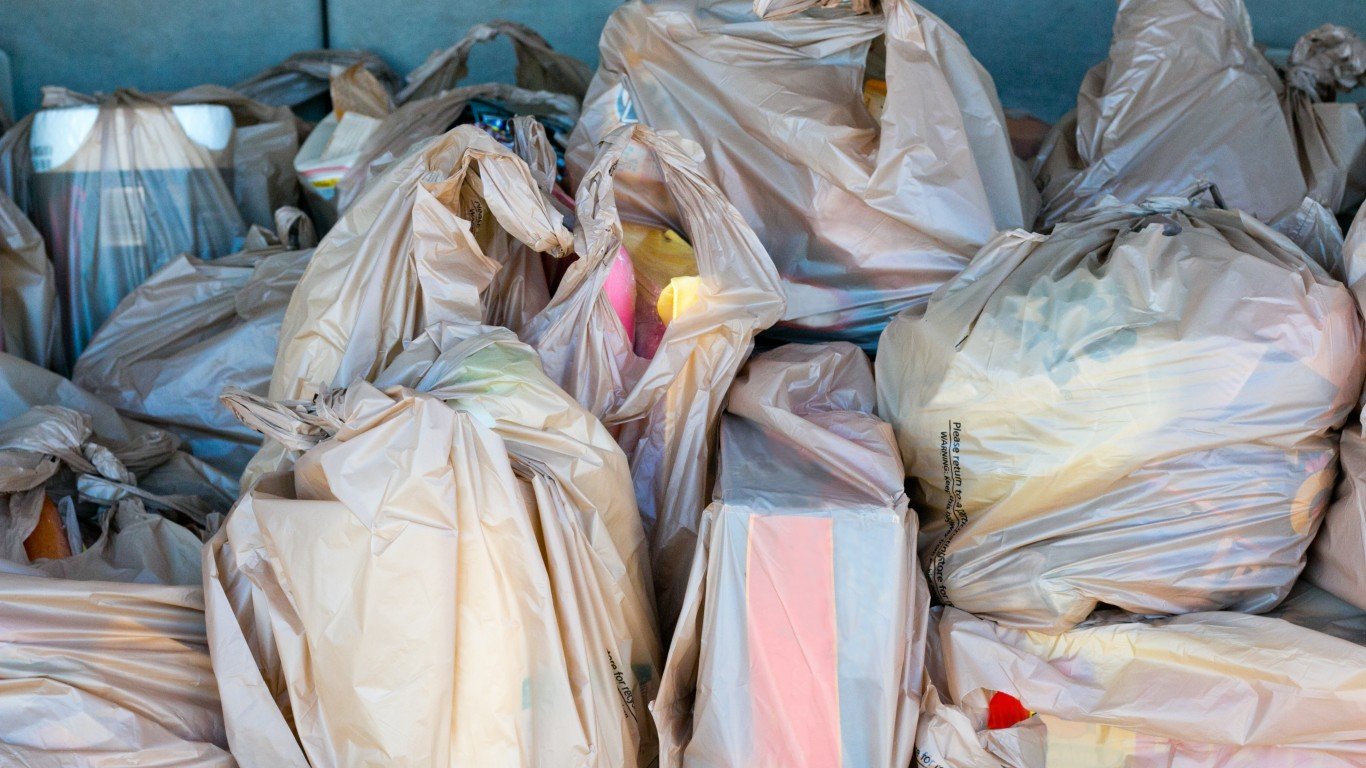
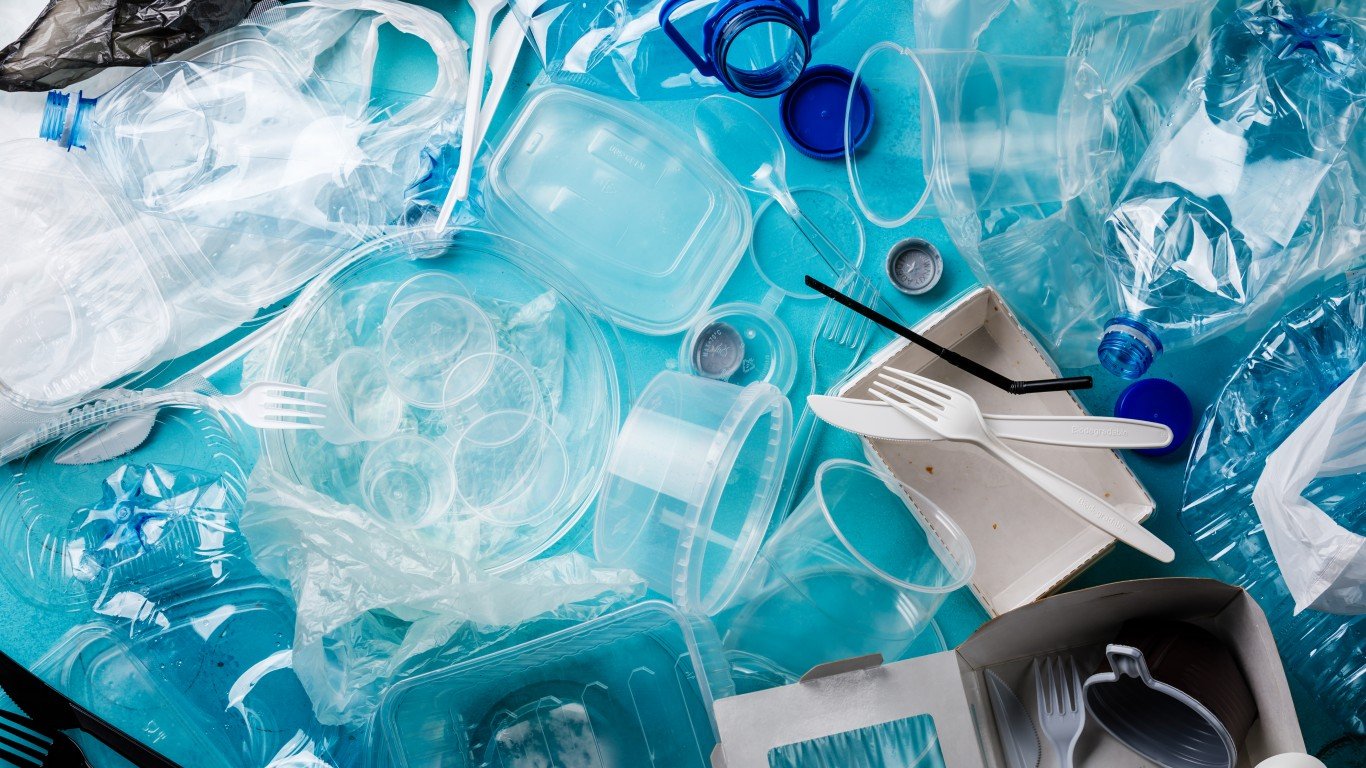
Plastics, plastics, everywhere — and a lot of the plastic products we use and discard end up as waste in our landfills and waterways. The American Chemistry Council recorded 35.7 million tons of plastic generation in the U.S. in 2018. That same year, plastics accounted for 12.2% of municipal solid waste generation, with 14.8 tons attributed to single-use containers and packaging (bags, sacks, bottles, jars) alone, the U.S. Environmental Protection Agency reported.
The American Chemistry Council notes that 96% of all manufactured goods have a direct connection with the chemistry business, which isn’t surprising when you consider the amount of plastic in everyday items. See the 50 banks enabling the single use plastic crisis.
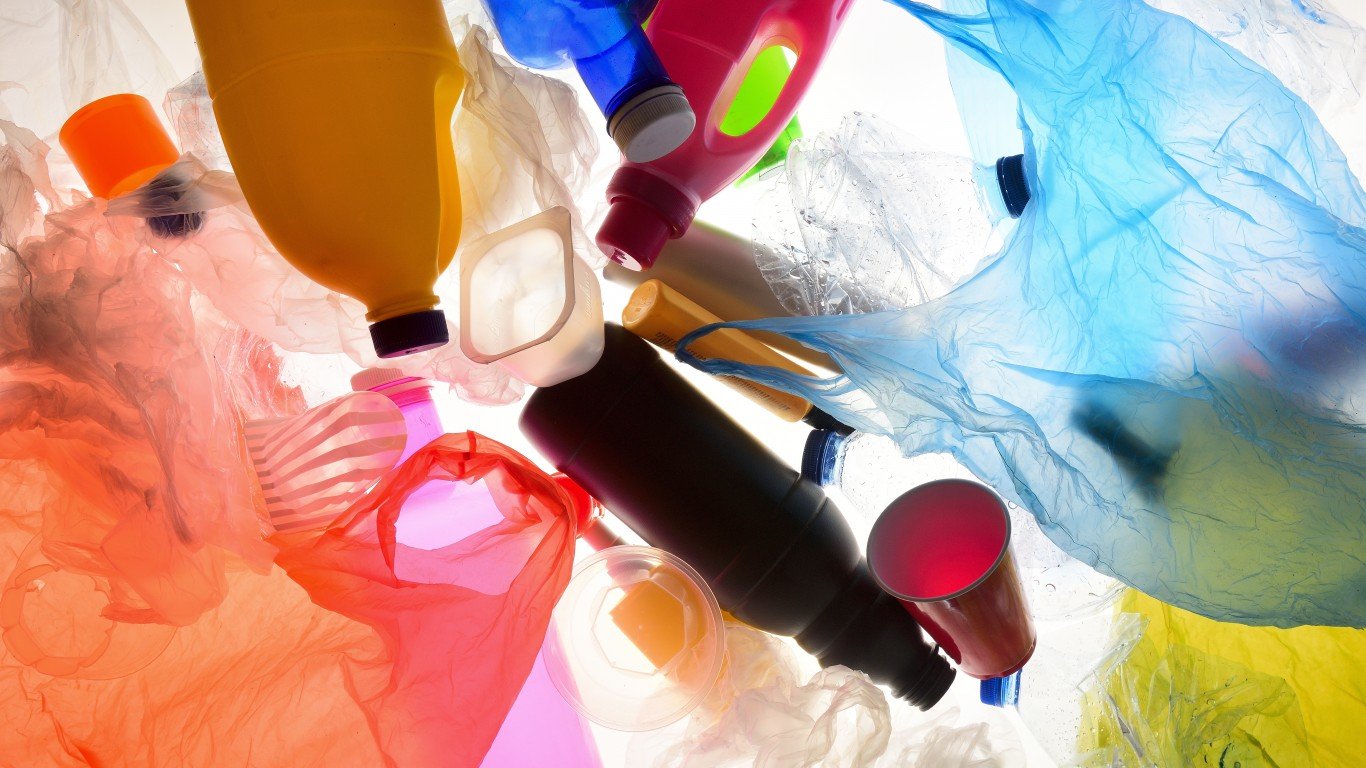
Plastics cover a wide range of synthetic polymeric materials (a substance with large molecules) and associated additives made from petrochemical, natural gas, or biologically based feedstocks with thermoplastic, thermoset, or elastomeric properties. You’ll find plastics in everything from packaging, building and construction materials, household and sports equipment, as well as vehicles, electronics, and agriculture.
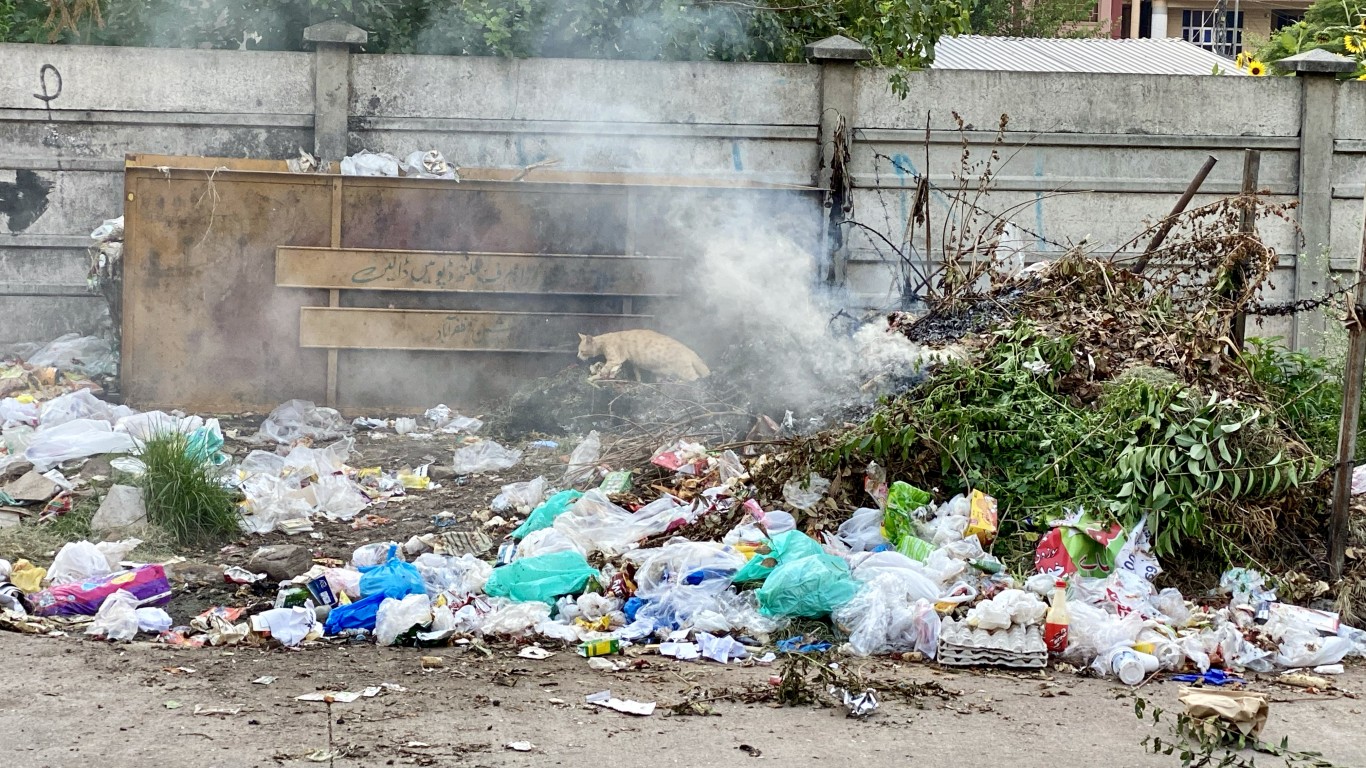
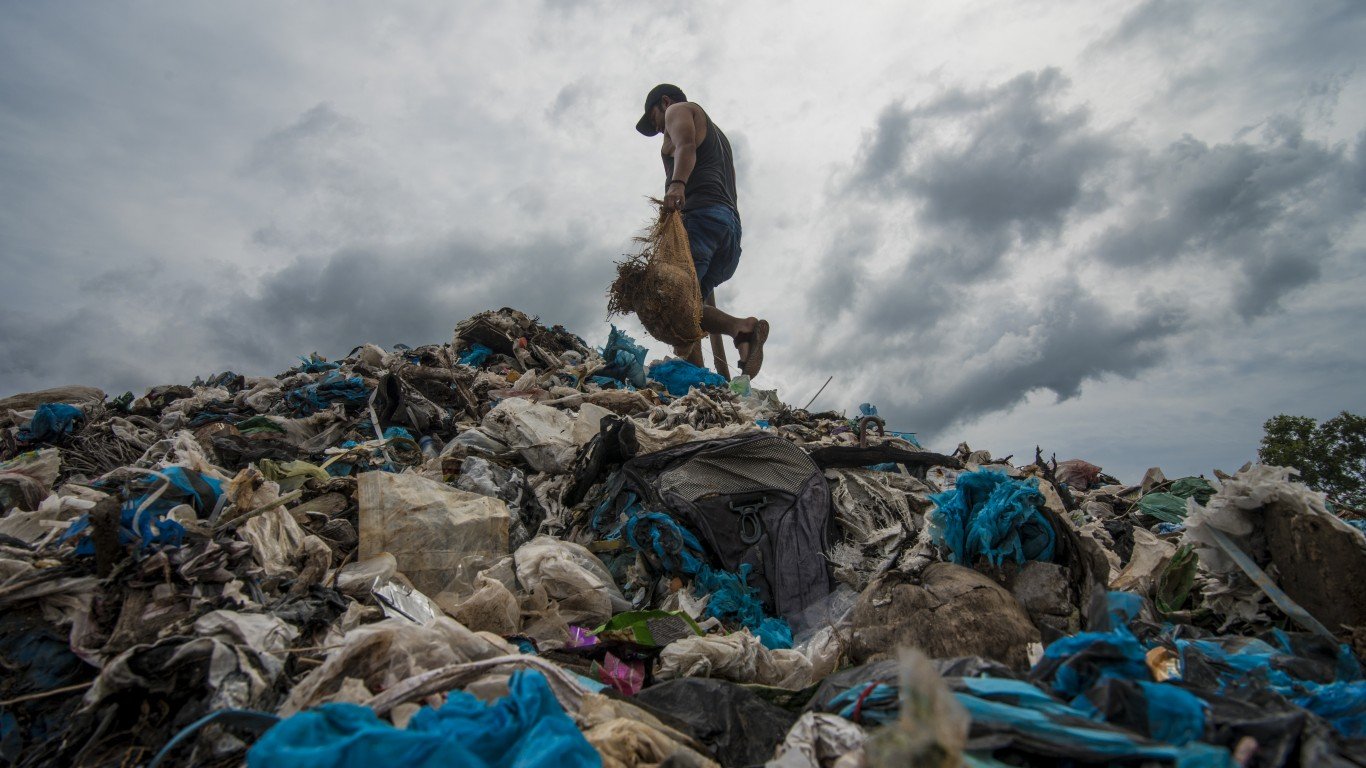
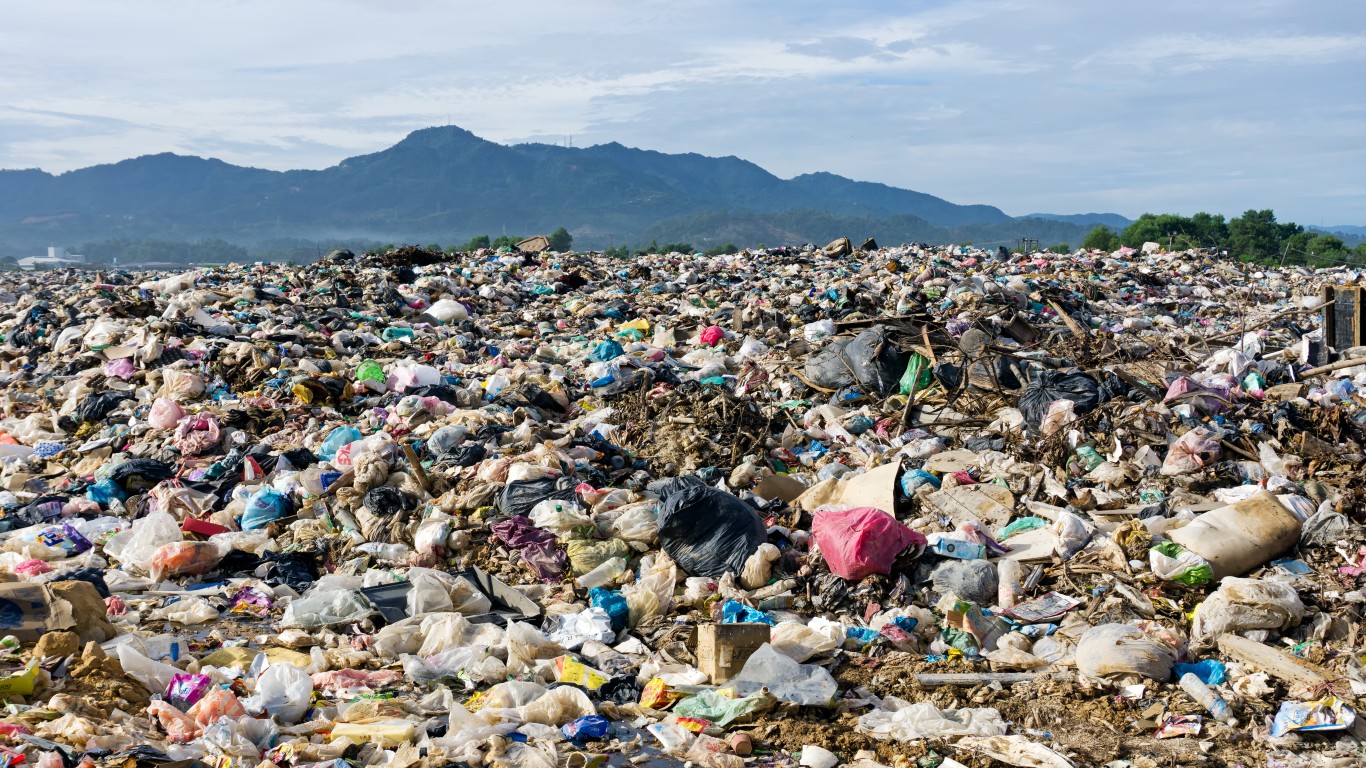
Excess plastic becomes waste when the product is, intentionally or unintentionally, taken out of use and is entered into a waste stream as part of a waste management process or released into the environment.
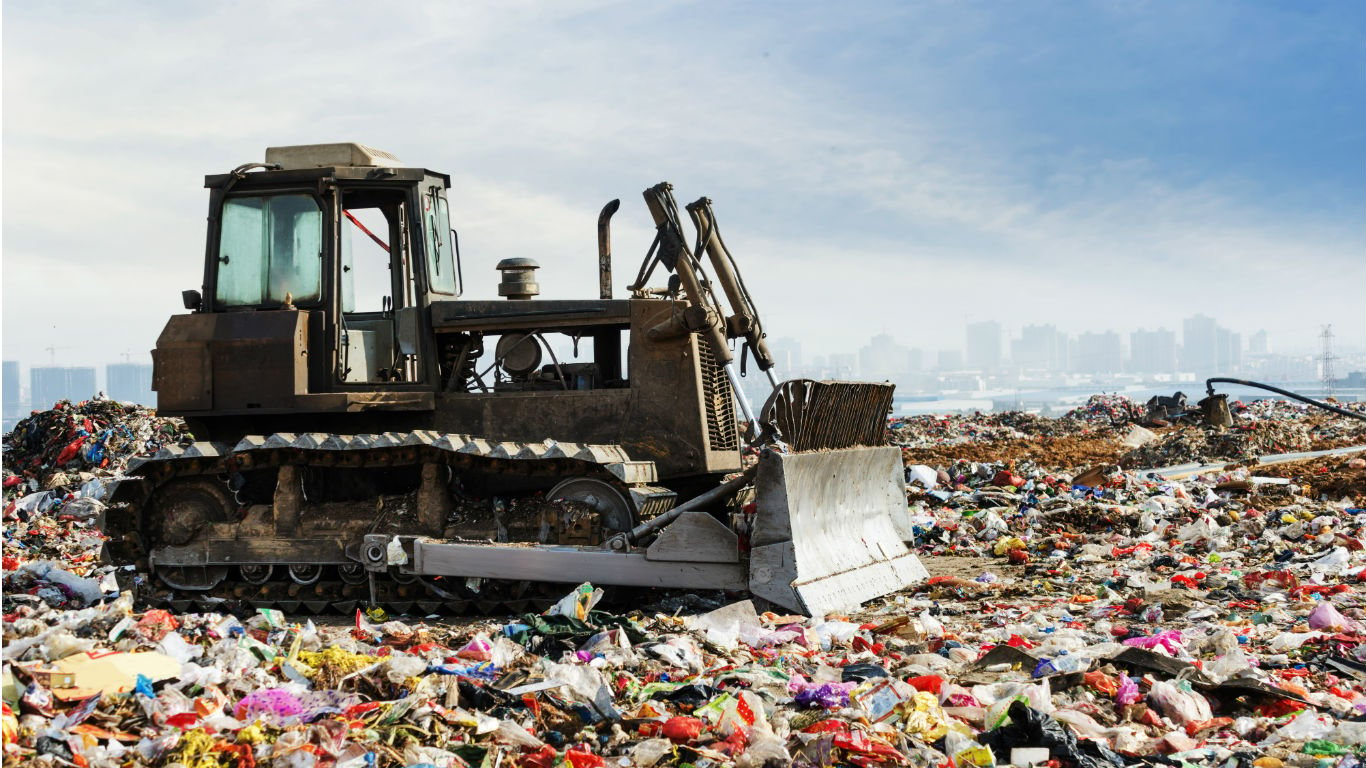
Plastic waste in the environment is typically characterized according to size. Plastic waste is part of solid waste, which is defined as any residential, commercial, and institutional refuse. Solid waste excludes any discarded industrial, medical, hazardous, electronic, and construction and demolition materials. (This is the company that produces the most plastic waste in the world.)
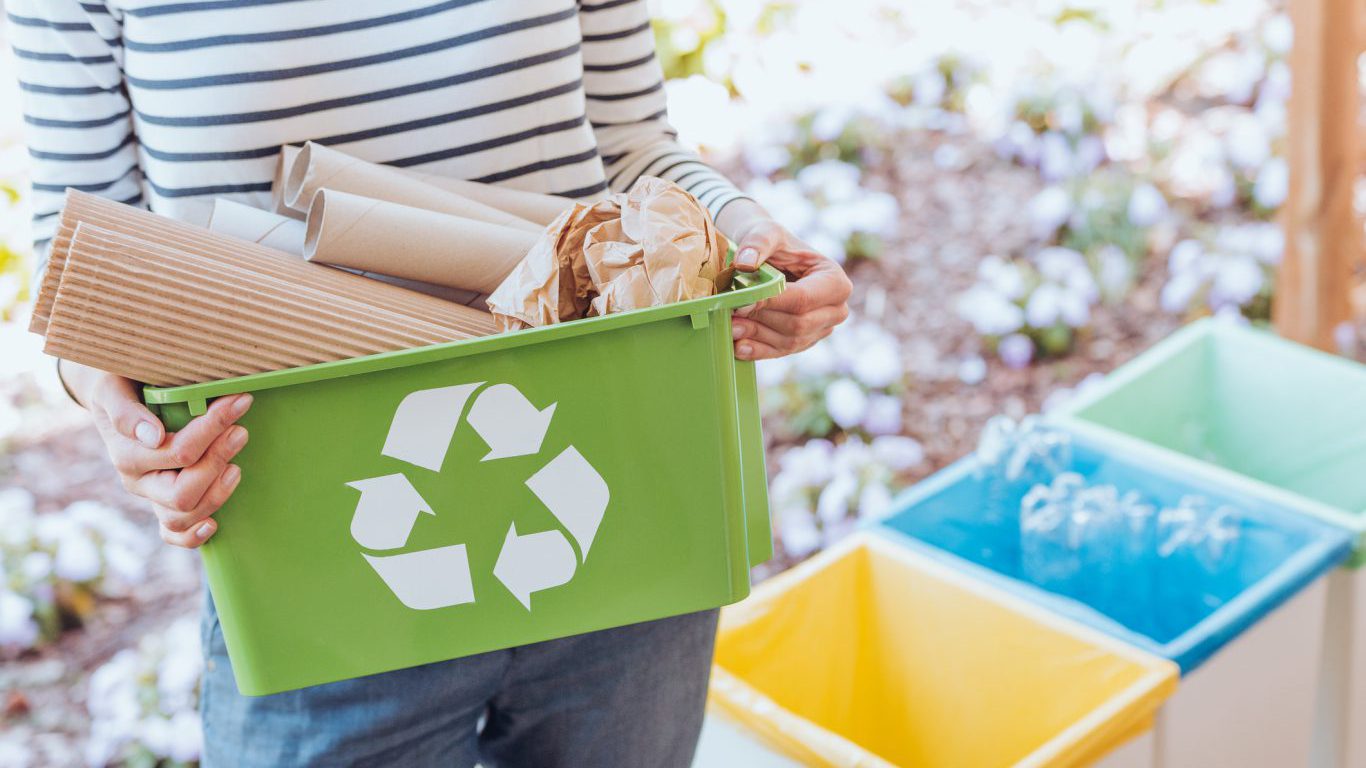
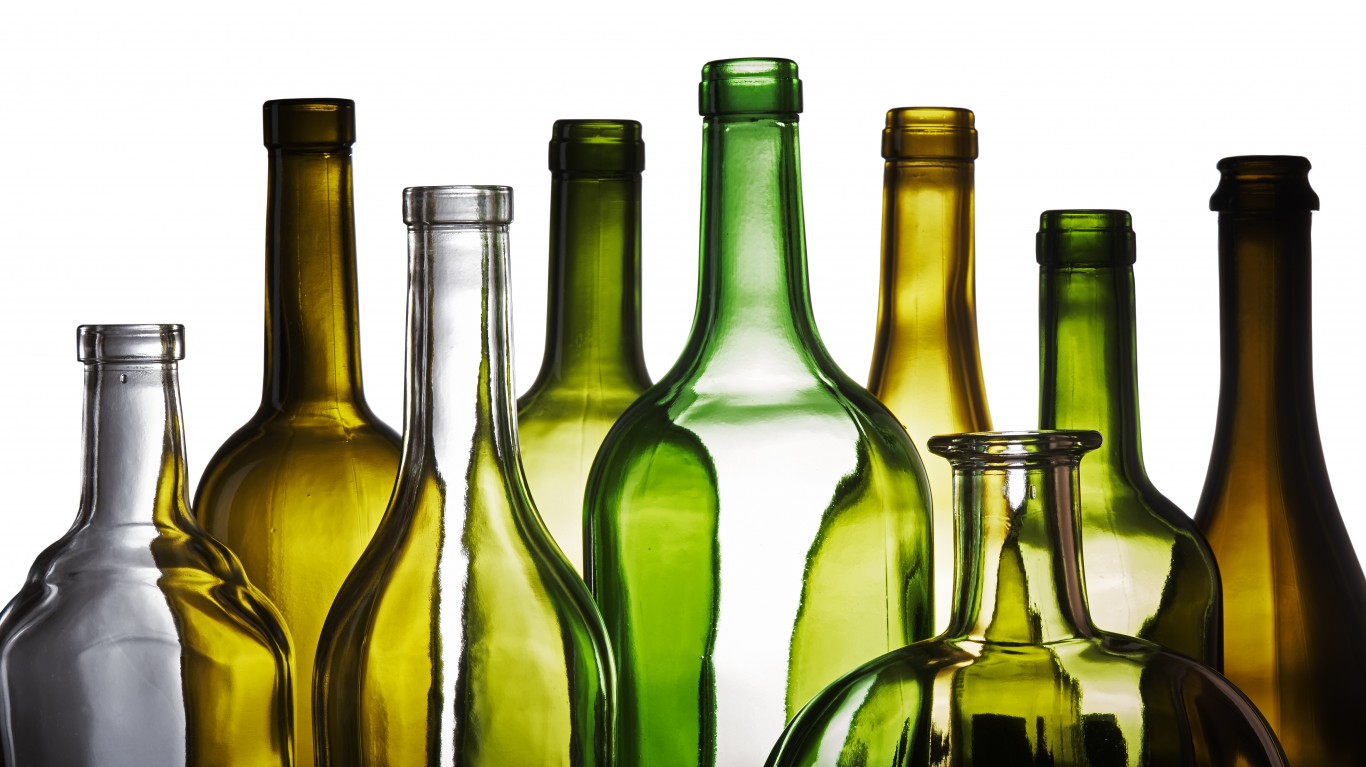
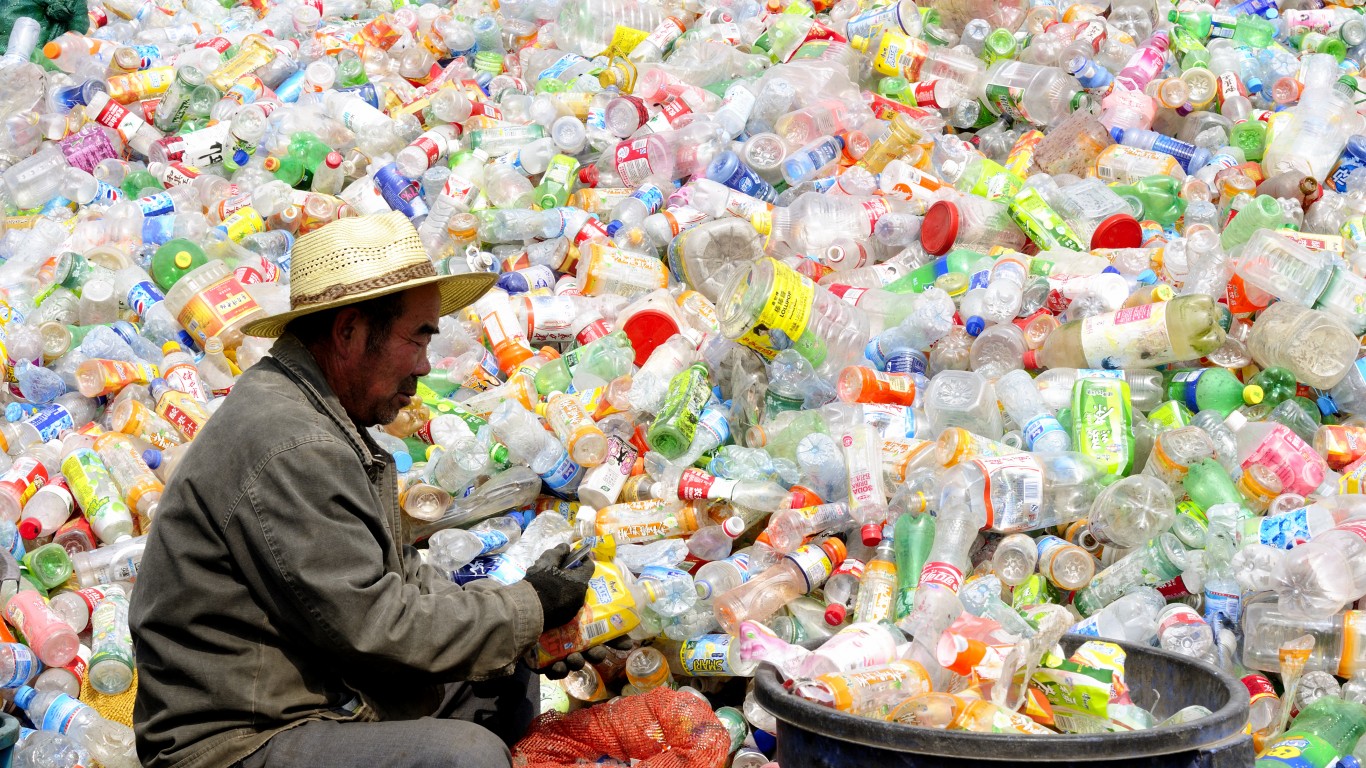
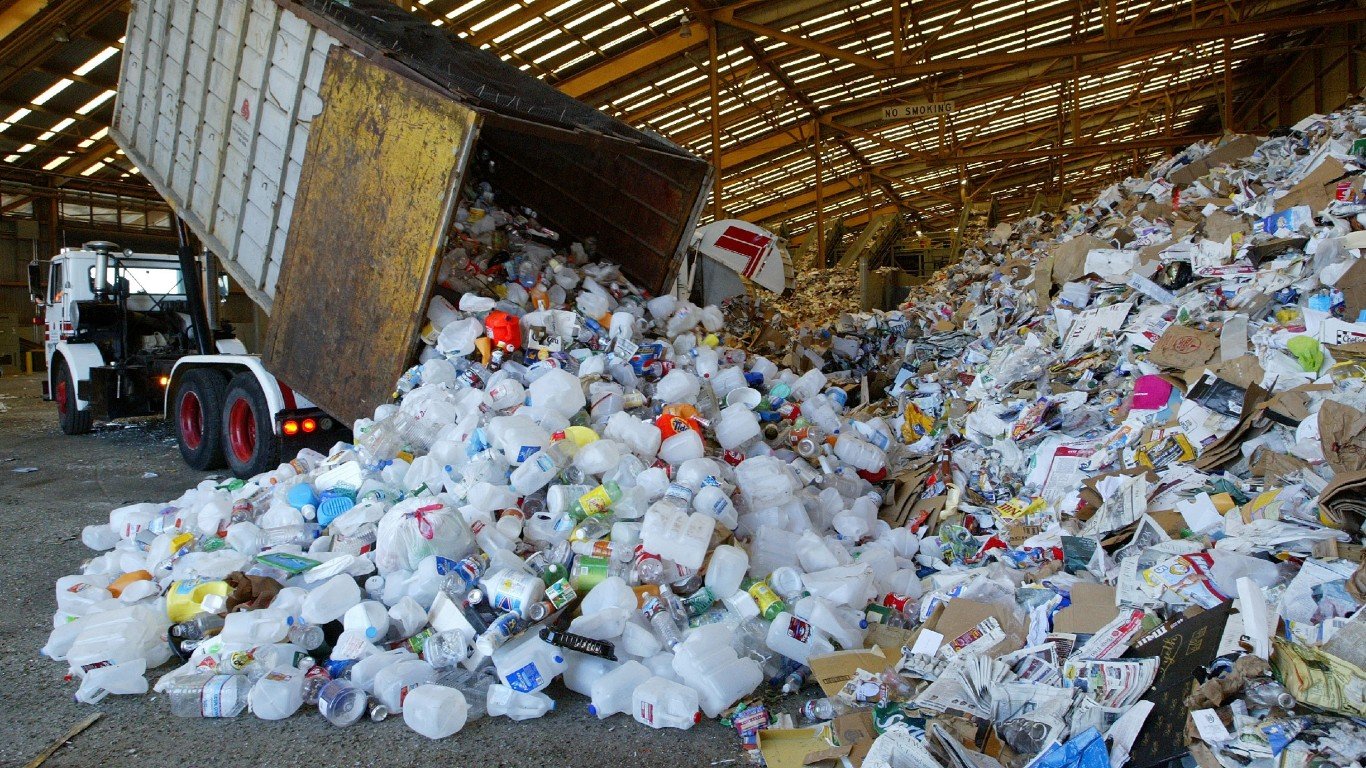
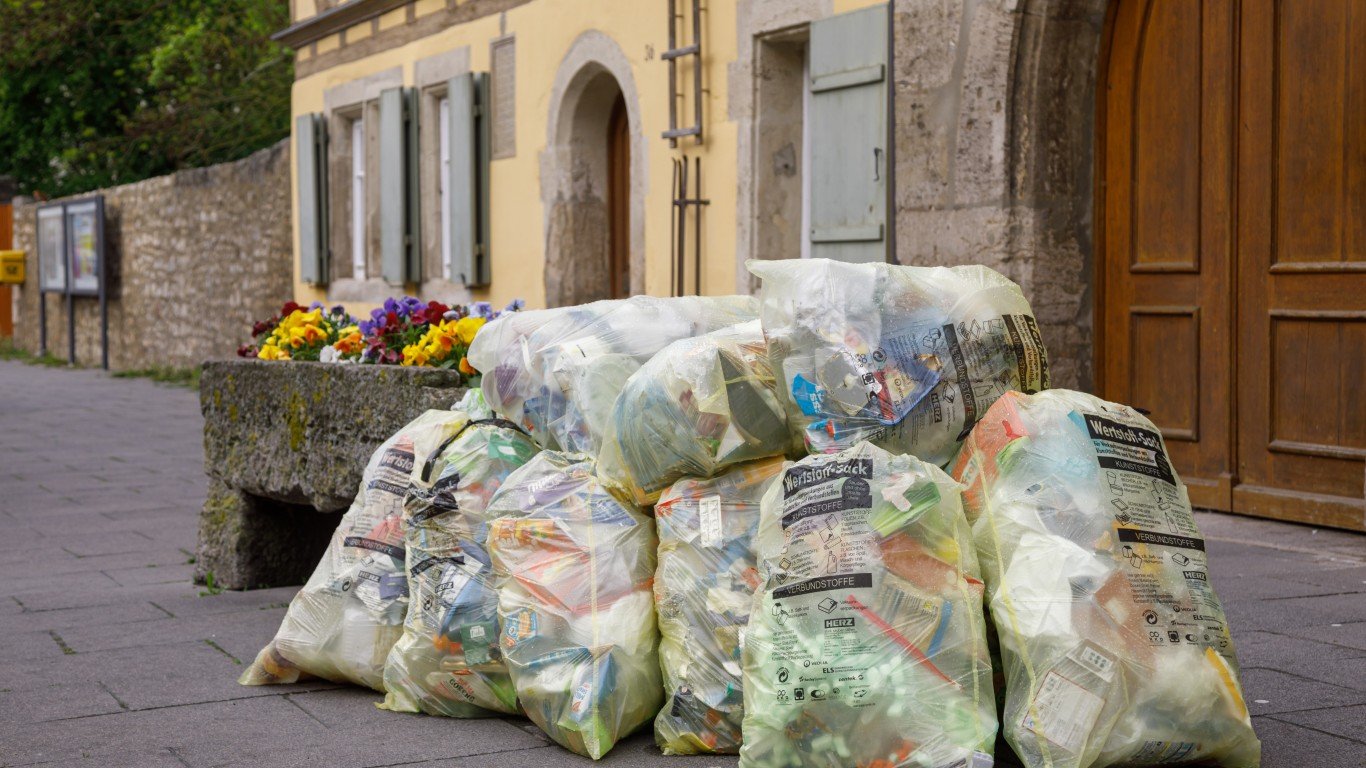
Despite recycling efforts, not much plastic gets reused or repurposed in the U.S. In 2018, about 3 million tons were recycled for an 8.7% recycling rate, the EPA estimates. However, some items, such as PET (polyethylene terephthalate) bottles and jars and HDPE (high-density polyethylene) natural bottles each had a nearly 30% recycling rate. So at least we’re recycling some plastic items.
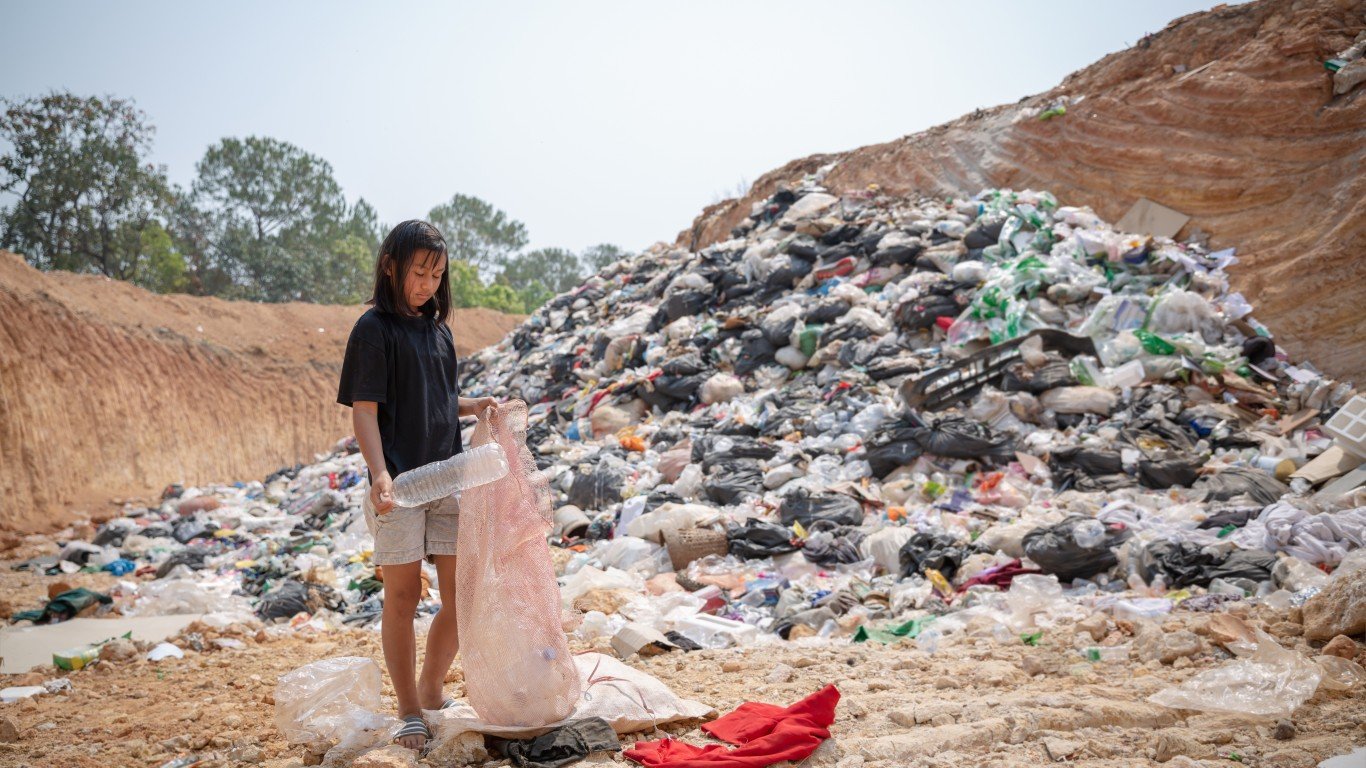
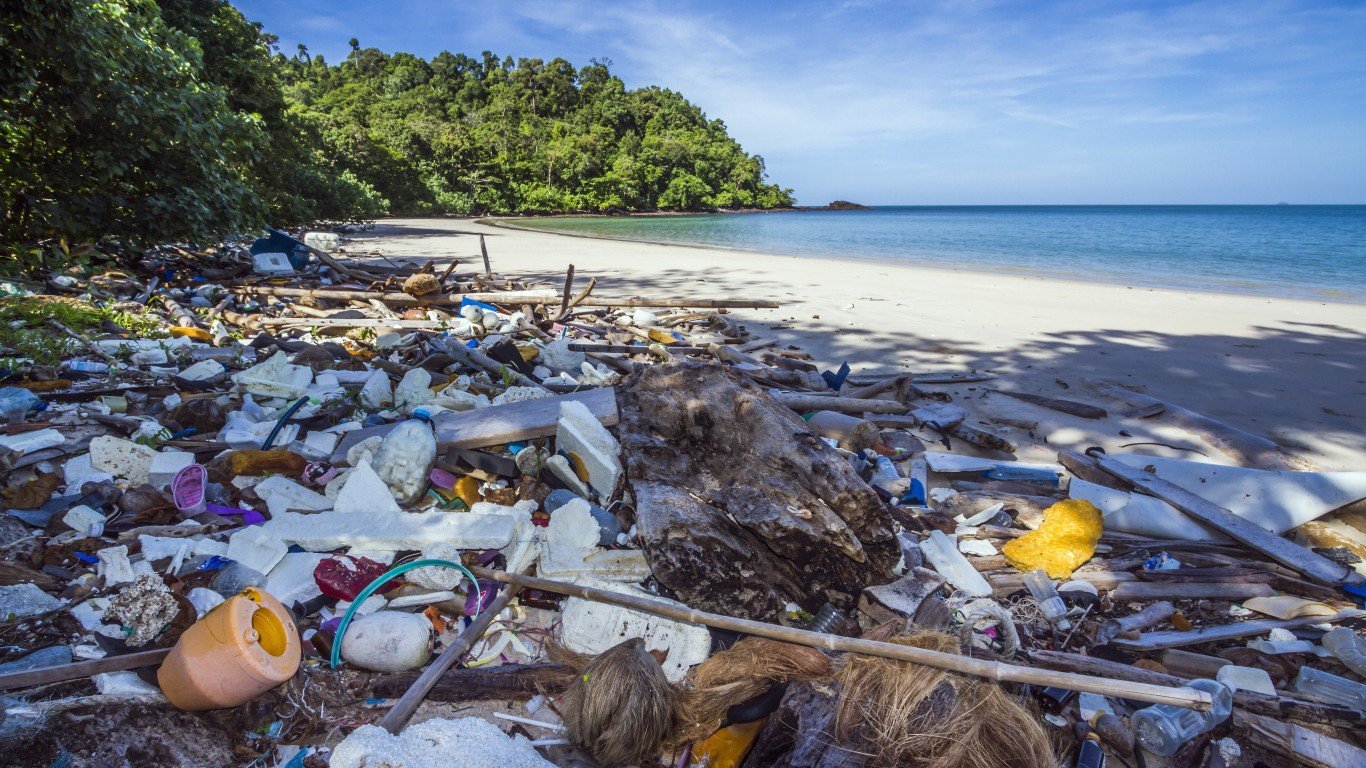
To find how much plastic waste countries generate, 24/7 Wall St. reviewed “Reckoning with the U.S. Role in Global Ocean Plastic Waste” (2021), a study published by The National Academies Press. Countries are ranked by annual plastic waste generation (in kilograms) per capita.
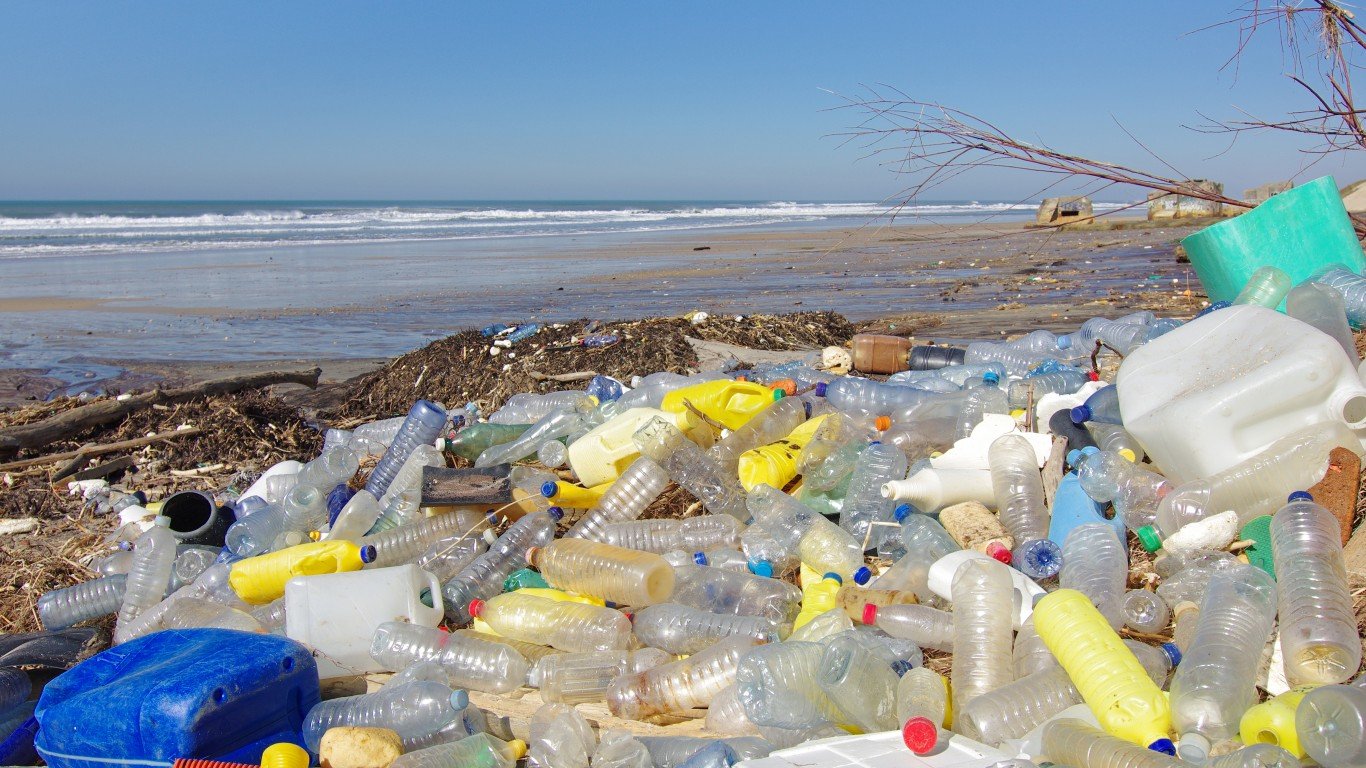
Of the 20 countries and one region reviewed, the U.S. generated the most plastic waste in 2016. U.S. plastic waste generation totaled 42 million metric tons, or 130.9 kg (288.6 pounds) per capita. China and India generated about half as much total plastic waste for a much lower per capita figure.
Five of the six countries generating the least plastic waste per capita are in Asia, while the 10 countries generating the most plastic waste per capita include several European countries and the U.S. Plastic waste comprises between 9% and nearly 24% of total waste among countries on the list.
The U.S. also generates the most waste in total, at 4.5 to 6 pounds per person per day. That’s two to eight times more than many other countries. The U.S. generated over 320 million tons in total waste, about 100 million tons more than China and 43 million tons more than India. Collectively, the EU-28 generated nearly 244 million tons of waste.
Click here to see plastic waste generation values across countries
21. Pakistan
> Per capita plastic waste generation: 13.42 kg/year
> Plastic waste generation: 2,731,768 metric tons
> Total waste generation: 30,352,981 metric tons
> Pct. plastic in solid waste: 9.0%
[in-text-ad]
20. China
> Per capita plastic waste generation: 15.67 kg/year
> Plastic waste generation: 21,599,465 metric tons
> Total waste generation: 220,402,706 metric tons
> Pct. plastic in solid waste: 9.8%
[recirclink id=919843]
19. India
> Per capita plastic waste generation: 19.88 kg/year
> Plastic waste generation: 26,327,933 metric tons
> Total waste generation: 277,136 metric tons
> Pct. plastic in solid waste: 9.5%
18. Egypt, Arab Rep.
> Per capita plastic waste generation: 32.16 kg/year
> Plastic waste generation: 3,037,675 metric tons
> Total waste generation: 23,366,729 metric tons
> Pct. plastic in solid waste: 13.0%
[in-text-ad-2]
17. Indonesia
> Per capita plastic waste generation: 34.90 kg/year
> Plastic waste generation: 9,128,000 metric tons
> Total waste generation: 65,200,000 metric tons
> Pct. plastic in solid waste: 14.0%

16. Japan
> Per capita plastic waste generation: 38.44 kg/year
> Plastic waste generation: 4,881,161 metric tons
> Total waste generation: 44,374,189 metric tons
> Pct. plastic in solid waste: 11.0%
[in-text-ad]
15. Spain
> Per capita plastic waste generation: 39.42 kg/year
> Plastic waste generation: 1,832,533 metric tons
> Total waste generation: 20,361,483 metric tons
> Pct. plastic in solid waste: 9.0%
[recirclink id=986904]
14. France
> Per capita plastic waste generation: 43.81 kg/year
> Plastic waste generation: 2,929,042 metric tons
> Total waste generation: 32,544,914 metric tons
> Pct. plastic in solid waste: 9.0%
13. Mexico
> Per capita plastic waste generation: 47.86 kg/year
> Plastic waste generation: 5,902,490 metric tons
> Total waste generation: 54,151,287 metric tons
> Pct. plastic in solid waste: 10.9%
[in-text-ad-2]

12. Algeria
> Per capita plastic waste generation: 51.59 kg/year
> Plastic waste generation: 2,092,007 metric tons
> Total waste generation: 12,378,740 metric tons
> Pct. plastic in solid waste: 16.9%
11. Brazil
> Per capita plastic waste generation: 51.78 kg/year
> Plastic waste generation: 10,675,989 metric tons
> Total waste generation: 79,081,401 metric tons
> Pct. plastic in solid waste: 13.5%
[in-text-ad]
10. EU-28
> Per capita plastic waste generation: 54.56 kg/year
> Plastic waste generation: 29,890,143 metric tons
> Total waste generation: 243,737,466 metric tons
> Pct. plastic in solid waste: 11.7%
[recirclink id=1007275]
9. Italy
> Per capita plastic waste generation: 55.51 kg/year
> Plastic waste generation: 3,365,130 metric tons
> Total waste generation: 29,009,742 metric tons
> Pct. plastic in solid waste: 11.6%
8. Russian Federation
> Per capita plastic waste generation: 58.66 kg/year
> Plastic waste generation: 8,467,156 metric tons
> Total waste generation: 59,585,899 metric tons
> Pct. plastic in solid waste: 14.2%
[in-text-ad-2]

7. Argentina
> Per capita plastic waste generation: 60.95 kg/year
> Plastic waste generation: 2,656,771 metric tons
> Total waste generation: 18,184,606 metric tons
> Pct. plastic in solid waste: 14.6%
6. Malaysia
> Per capita plastic waste generation: 67.09 kg/year
> Plastic waste generation: 2,058,501 metric tons
> Total waste generation: 13,723,342 metric tons
> Pct. plastic in solid waste: 15.0%
[in-text-ad]
5. Thailand
> Per capita plastic waste generation: 69.54 kg/year
> Plastic waste generation: 4,796,494 metric tons
> Total waste generation: 27,268,302 metric tons
> Pct. plastic in solid waste: 17.6%
[recirclink id=1000524]
4. Germany
> Per capita plastic waste generation: 81.16 kg/year
> Plastic waste generation: 6,683,412 metric tons
> Total waste generation: 51,410,863 metric tons
> Pct. plastic in solid waste: 13.0%

3. Korea, Rep.
> Per capita plastic waste generation: 88.09 kg/year
> Plastic waste generation: 4,514,186 metric tons
> Total waste generation: 18,576,898 metric tons
> Pct. plastic in solid waste: 24.3%
[in-text-ad-2]

2. United Kingdom
> Per capita plastic waste generation: 98.66 kg/year
> Plastic waste generation: 6,471,650 metric tons
> Total waste generation: 32,037,871 metric tons
> Pct. plastic in solid waste: 20.2%
1. United States
> Per capita plastic waste generation: 130.09 kg/year
> Plastic waste generation: 42,027,215 metric tons
> Total waste generation: 320,818,436 metric tons
> Pct. plastic in solid waste: 13.1%
Contact [email protected] for any questions or corrections.