Life expectancy fell by 1.5 years in the United States in 2020. The decline, driven by the COVID-19 pandemic and the opioid crisis, represents the worst regression in public health in the United States since World War II.
While the most recent dip in life expectancy in the U.S. is alarming, there are many parts of the country where poor health outcomes and other socioeconomic hardships have long been the norm.
Life expectancy at birth, along with educational attainment and per capita income, are the three core measures used by the United Nations Development Programme’s Human Development Index — a tool used for gauging and comparing quality of life across geographies. Inspired by the HDI, 24/7 Wall St. created an index consisting of three measures — life expectancy at birth, bachelor’s degree attainment, and poverty rate — to identify the worst counties to live in in every state. Our list also includes independent cities that do not fall within the boundaries of a county or county equivalent. Only independent cities, counties, and county equivalents with populations of 10,000 or more were considered.
In most cases, the county that ranks as the worst place to live in a given state struggles with other socioeconomic problems beyond those used in the index. For example, the majority of counties on this list have higher unemployment than the state as a whole. Each county also has a lower median household income than the state as a whole. The majority of counties on this list are also shrinking and are home to fewer people today than five years ago. Here is a look at the fastest shrinking place in every state.
Several counties on this list fall entirely or partially within Indian Reservations. For a number of reasons — including historical mistreatment, mismanagement, and convoluted barriers to economic development — Indian Reservations are often among the poorest places in the country. Here is a look at the states with the most Indian Reservations and tribal areas.
Click here to see the worst county to live in every state
Click here to read our detailed methodology
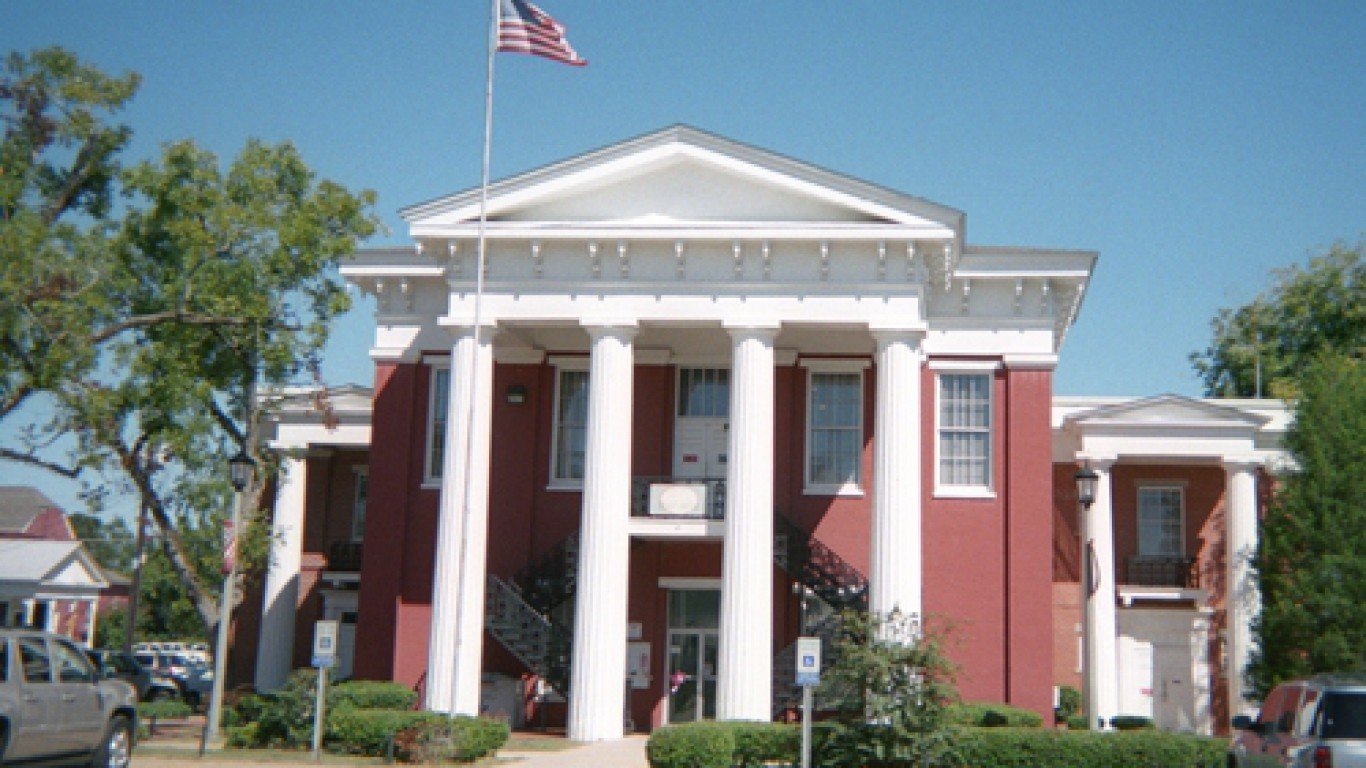
Alabama: Wilcox County
> Largest place in county: Camden
> 5-yr. population change: -6.0% (state: +1.2%)
> Poverty rate: 30.1% (state: 16.7%)
> Adults with a bachelor’s degree: 12.5% (state: 25.5%)
> Life expectancy at birth: 70.8 years (state: 75.5 years)
Based on several key socioeconomic indicators, Wilcox County ranks as the worst county to live in Alabama. The local poverty rate of 30.1% means that local residents are nearly twice as likely to face serious financial hardship than the typical Alabama resident. High poverty in the area is partially the result of a weak job market. As of May 2021, the local unemployment rate stood at 8.8%, more than double the 3.4% jobless rate across the state.
In low-income areas, residents are less likely to be able to afford health care as well as a wide range of healthy options related to diet and lifestyle, and health outcomes suffer as a result. In Wilcox County, life expectancy at birth is just 70.8 years, nearly half a decade below the 75.5 year state average.
[in-text-ad]

Alaska: Bethel Census Area
> Largest place in census area: Bethel
> 5-yr. population change: +3.2% (state: +1.2%)
> Poverty rate: 28.3% (state: 10.7%)
> Adults with a bachelor’s degree: 11.9% (state: 29.6%)
> Life expectancy at birth: 71.6 years (state: 79.0 years)
The Bethel Census Area, located in southwestern Alaska, ranks as the worst county equivalent to live in in the state. Life expectancy at birth in the area is just 71.6 years, well below the statewide average of 79.0 years. Additionally, the local poverty rate of 28.3% is nearly three times higher than the state rate of 10.7%.
Higher educational attainment is closely linked to both improved health outcomes and increased financial security. In the Bethel Census Area, only 11.9% of adults have a bachelor’s degree or higher, compared to nearly 30% of adults in Alaska.
[recirclink id=824405]

Arizona: Apache County
> Largest place in county: Chinle
> 5-yr. population change: -0.9% (state: +7.4%)
> Poverty rate: 35.5% (state: 15.1%)
> Adults with a bachelor’s degree: 12.3% (state: 29.5%)
> Life expectancy at birth: 73.1 years (state: 80.0 years)
Apache County, which spans over much of Arizona’s eastern border, ranks as the worst place to live in the state. An estimated 11.9% of the local labor force are unemployed, well above the 6.7% jobless rate across Arizona. A lack of sufficient employment opportunities may partly explain the county’s high poverty rate, which at 35.5% is more than double the 15.1% poverty rate across Arizona.
Financial hardship and job scarcity may be pushing people out of Apache County. In the last five years, the local population has contracted by 0.9%, even as Arizona’s population expanded by 7.4% over the same period.
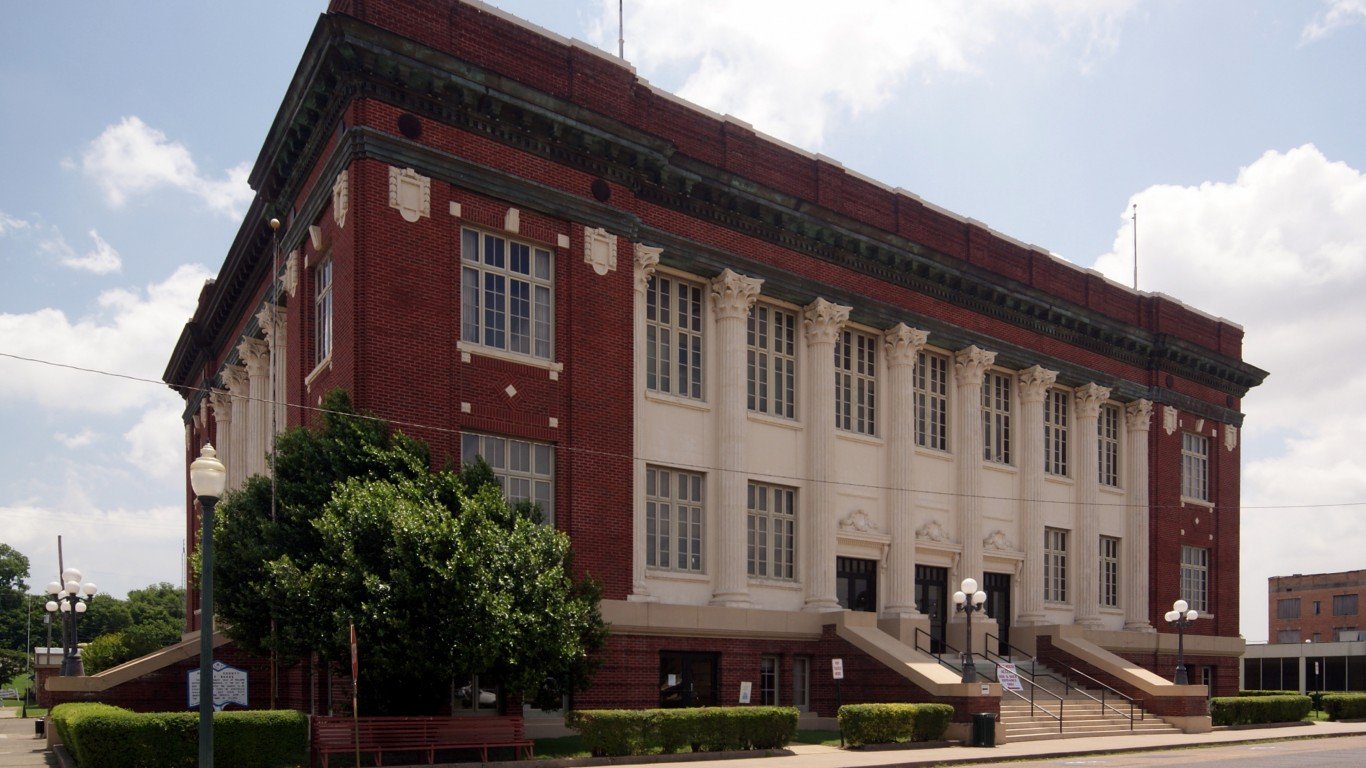
Arkansas: Phillips County
> Largest place in county: West Helena
> 5-yr. population change: -10.7% (state: +1.8%)
> Poverty rate: 34.5% (state: 17.0%)
> Adults with a bachelor’s degree: 13.8% (state: 23.0%)
> Life expectancy at birth: 71.1 years (state: 76.0 years)
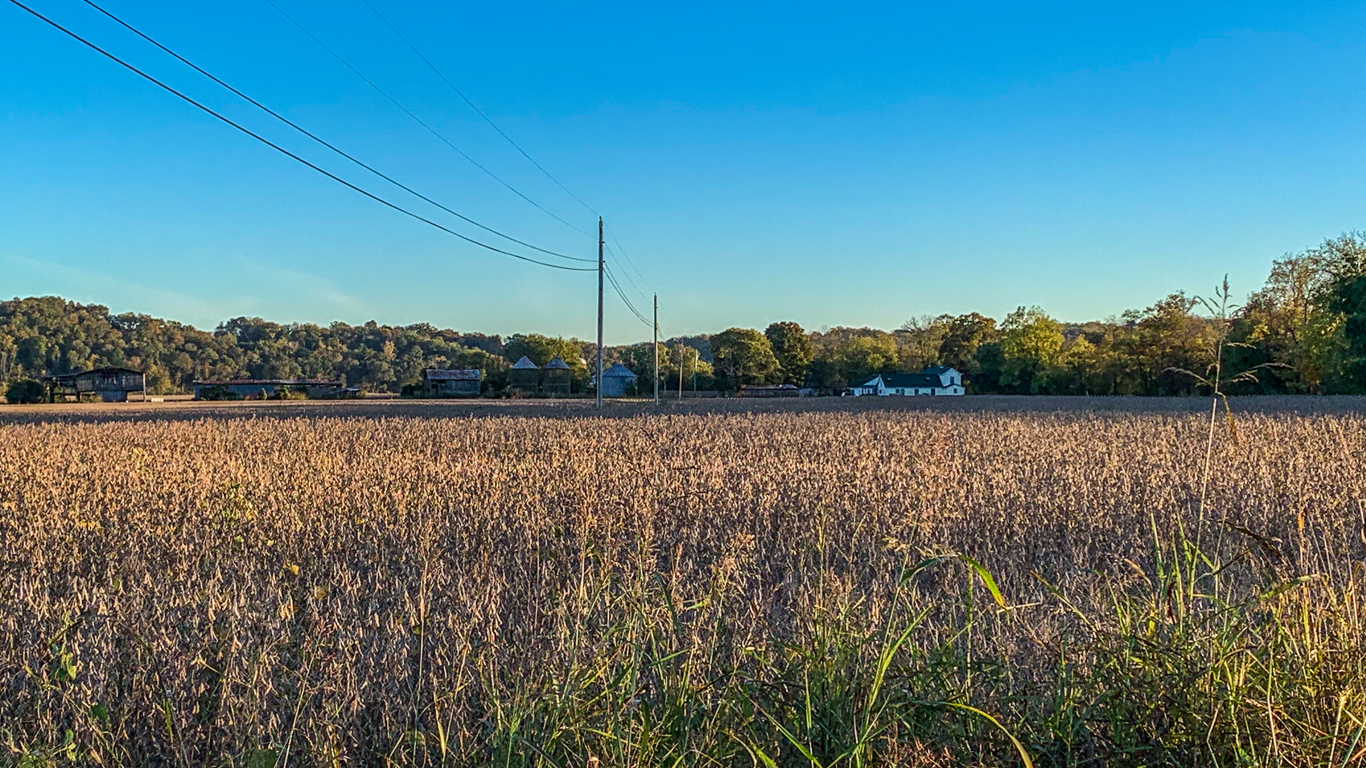
Phillips County ranks as the worst place to live in Arkansas. Located in the state’s Delta region, Phillips County is a former agricultural and transportation hub with a history of racial tensions and violence. After decades of economic decline, the local poverty rate stands at 34.5%, more than double the 17.0% state poverty rate. Well-educated areas tend to have lower rates of financial hardship, and only 13.8% of adults in the county have a bachelor’s degree, compared to 23.0% of adults in Arkansas.
As is often the case in parts of the country with high poverty, Phillips County is in a period of population decline. Over the last five years, the number of people living in the county has fallen by 10.7%, even as Arkansas’ population expanded by 1.8%.
[in-text-ad-2]
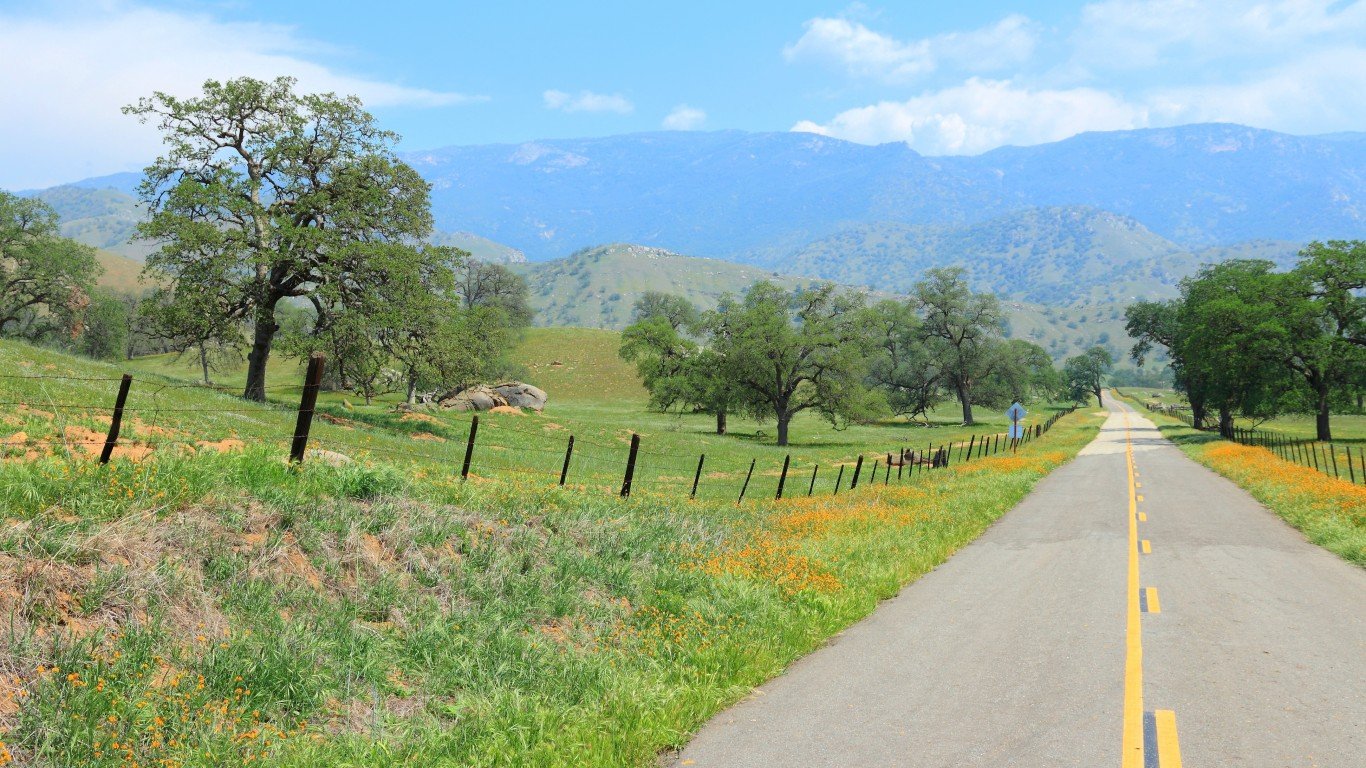
California: Tulare County
> Largest place in county: Visalia
> 5-yr. population change: +2.4% (state: +3.2%)
> Poverty rate: 23.8% (state: 13.4%)
> Adults with a bachelor’s degree: 14.6% (state: 33.9%)
> Life expectancy at birth: 78.7 years (state: 81.7 years)
Tulare County, centrally located in California’s Central Valley, ranks as the worst county to live in the state. Though the area is both an agricultural and manufacturing hub, the county struggles with both unemployment and poverty.. The county’s May 2021 unemployment rate of 10.2% is well above both the 5.8% national rate and 7.7% state rate. Additionally, 23.8% of the local population live below the poverty line, compared to California’s 13.4% poverty rate.
Economic security tends to improve with greater educational attainment, and across Tulare County, only 14.6% of adults have a bachelor’s degree or higher, compared to 33.9% of adults in California.
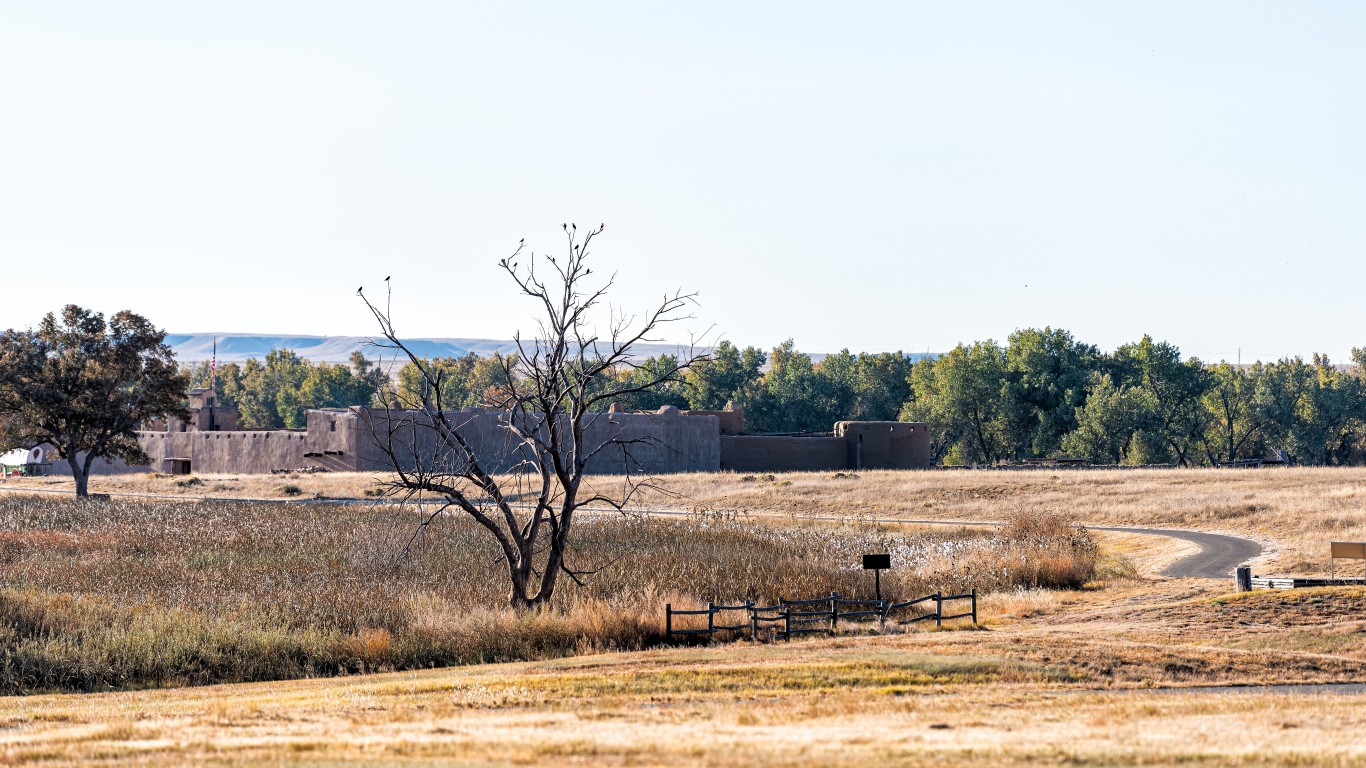
Colorado: Otero County
> Largest place in county: La Junta
> 5-yr. population change: -2.3% (state: +7.9%)
> Poverty rate: 23.7% (state: 10.3%)
> Adults with a bachelor’s degree: 18.6% (state: 40.9%)
> Life expectancy at birth: 74.0 years (state: 80.6 years)
Otero County is located in southeastern Colorado. Due to several key socioeconomic indicators, it ranks as the worst county to live in the state. At just 74 years, life expectancy at birth in the county is nearly seven years shy of the statewide average.
The area’s lower than average life expectancy is likely closely tied to the high poverty rate. Low-income Americans are less likely to be able to afford necessary and preventative medical care and healthy lifestyle choices. In Otero County, 23.7% of the population live below the poverty line, more than double the 10.3% state poverty rate.
[in-text-ad]

Connecticut: Windham County
> Largest place in county: Willimantic
> 5-yr. population change: -1.1% (state: -0.5%)
> Poverty rate: 11.4% (state: 9.9%)
> Adults with a bachelor’s degree: 24.3% (state: 39.3%)
> Life expectancy at birth: 78.5 years (state: 80.9 years)
Of the eight counties in Connecticut, Windham County, located in the northeastern corner along the Massachusetts and Rhode Island borders, ranks as the worst to live in. At 78.5 years, life expectancy at birth in the county is about 2.5 years shy of the state average. Windham County residents are also less likely to have a college education and more likely to live below the poverty line than the typical Connecticut resident.
Connecticut is one of only five states to report population decline over the last five years, contracting by 0.5% over that period. Windham County is losing residents even faster than the state as a whole, reporting a 1.1% contraction in the last half decade.
[recirclink id=880865]

Delaware: Kent County
> Largest place in county: Dover
> 5-yr. population change: +5.5% (state: +4.4%)
> Poverty rate: 13.5% (state: 11.8%)
> Adults with a bachelor’s degree: 23.7% (state: 32.0%)
> Life expectancy at birth: 77.8 years (state: 78.5 years)
A geographically small state, Delaware has only three counties. As a result, even though Kent County ranks as the worst county to live in the state, the disparity between the county and the state as a whole in several key socioeconomic indicators is not especially pronounced. The county’s poverty rate of 13.5% is only slightly higher than the 11.8% state rate. Similarly, at 77.8 years, life expectancy at birth in Kent County is less than a year below the 78.5 year average across Delaware.
However, adults living in Kent are considerably less likely to have a four-year college degree than the typical adult in Delaware. Only 23.7% of the county’s 25 and older population have a bachelor’s degree compared to 32.0% of Delaware’s 25 and older population.

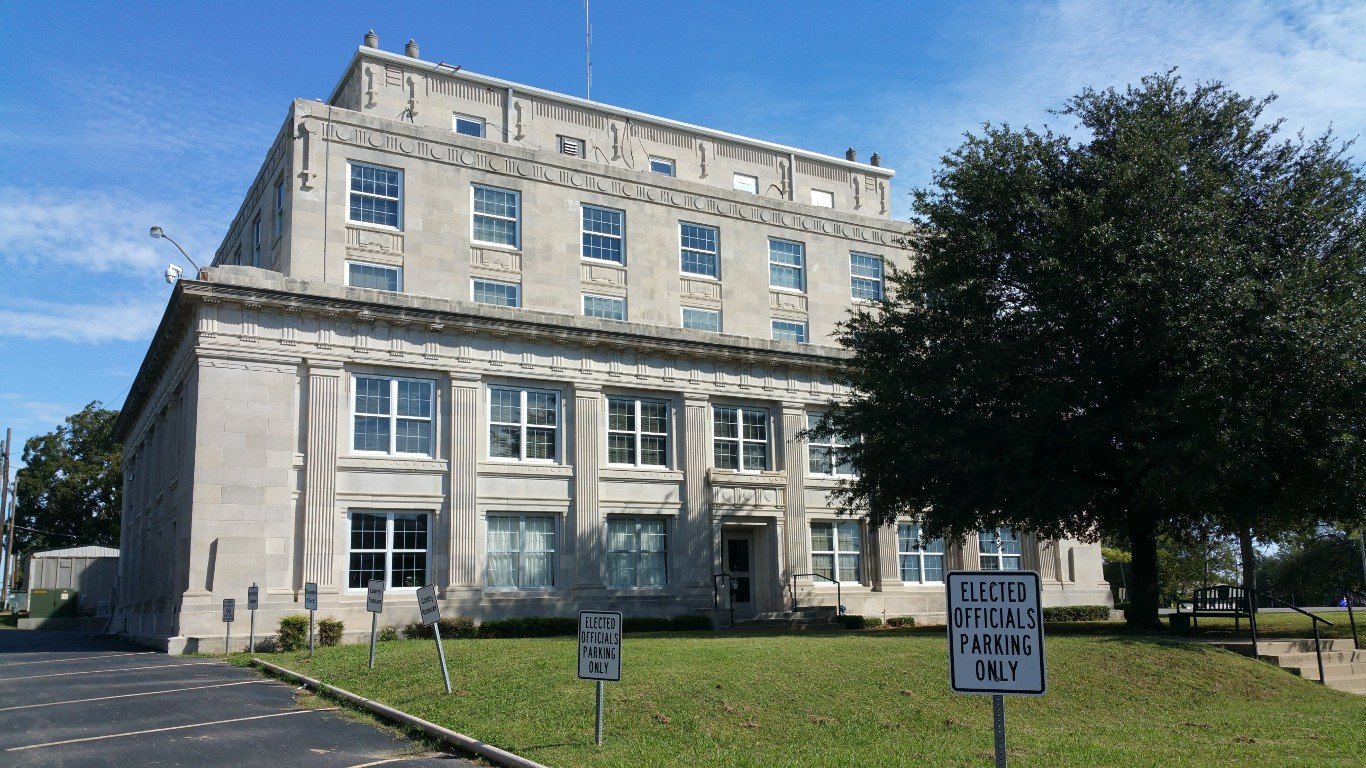
Florida: Hamilton County
> Largest place in county: Jasper
> 5-yr. population change: -1.0% (state: +8.0%)
> Poverty rate: 29.9% (state: 14.0%)
> Adults with a bachelor’s degree: 7.9% (state: 29.9%)
> Life expectancy at birth: 76.2 years (state: 80.2 years)
Florida is one of the fastest growing states in the country, reporting 8% population growth over the last five years. Hamilton County, however, located in northern Florida along the Georgia border, is bucking the state trend, reporting a 1% population decline over the same period.
The worst county to live in in the Sunshine State, Hamilton has a poverty rate of 29.9% — more than double the statewide rate of 14.0%. Health outcomes are also lagging in the county as the local life expectancy at birth is 76.2 years, four years shy of the statewide average.
[in-text-ad-2]
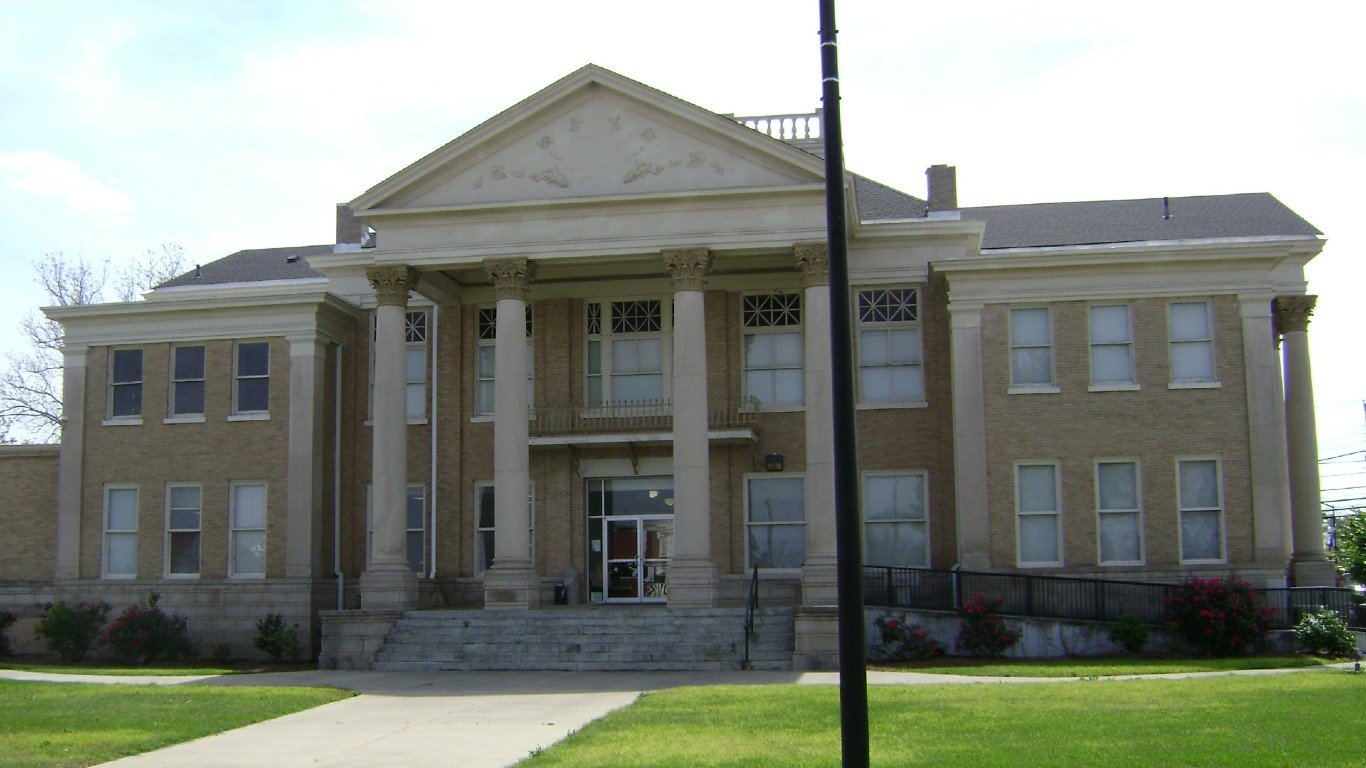
Georgia: Ben Hill County
> Largest place in county: Fitzgerald
> 5-yr. population change: -2.9% (state: +5.0%)
> Poverty rate: 29.6% (state: 15.1%)
> Adults with a bachelor’s degree: 11.2% (state: 31.3%)
> Life expectancy at birth: 73.0 years (state: 77.9 years)
Ben Hill County, located in south-central Georgia, ranks as the worst place to live in the state. Health outcomes in the state lag considerably behind much of the rest of the state, as local life expectancy at birth is just 73 years, compared to about 78 years across Georgia.
Poverty can have a negative impact on health outcomes, including life expectancy, as poorer Americans often struggle to afford health care and healthy lifestyle choices. The poverty rate in Ben Hill County of 29.6% is nearly double the 15.1% poverty rate across Georgia.

Hawaii: Hawaii County
> Largest place in county: Hilo
> 5-yr. population change: +5.3% (state: +2.1%)
> Poverty rate: 15.6% (state: 9.4%)
> Adults with a bachelor’s degree: 29.4% (state: 33.0%)
> Life expectancy at birth: 80.6 years (state: 82.3 years)
Hawaii is a geographically small state of only five counties, and as a result, variation in socioeconomic outcomes between a given county and the state as a whole are relatively small. Still, based on several key measures, Hawaii County, coterminous with the Island of Hawaii — the largest by landmass in the archipelago — ranks behind the other counties in the state.
The local poverty rate of 15.6% is the highest among the counties in Hawaii and well above the 9.4% state poverty rate. Additionally, even though at 80.6 years, life expectancy at birth is higher than the 79.2 year national average, it is lower than the statewide average life expectancy of 82.3 years.
[in-text-ad]
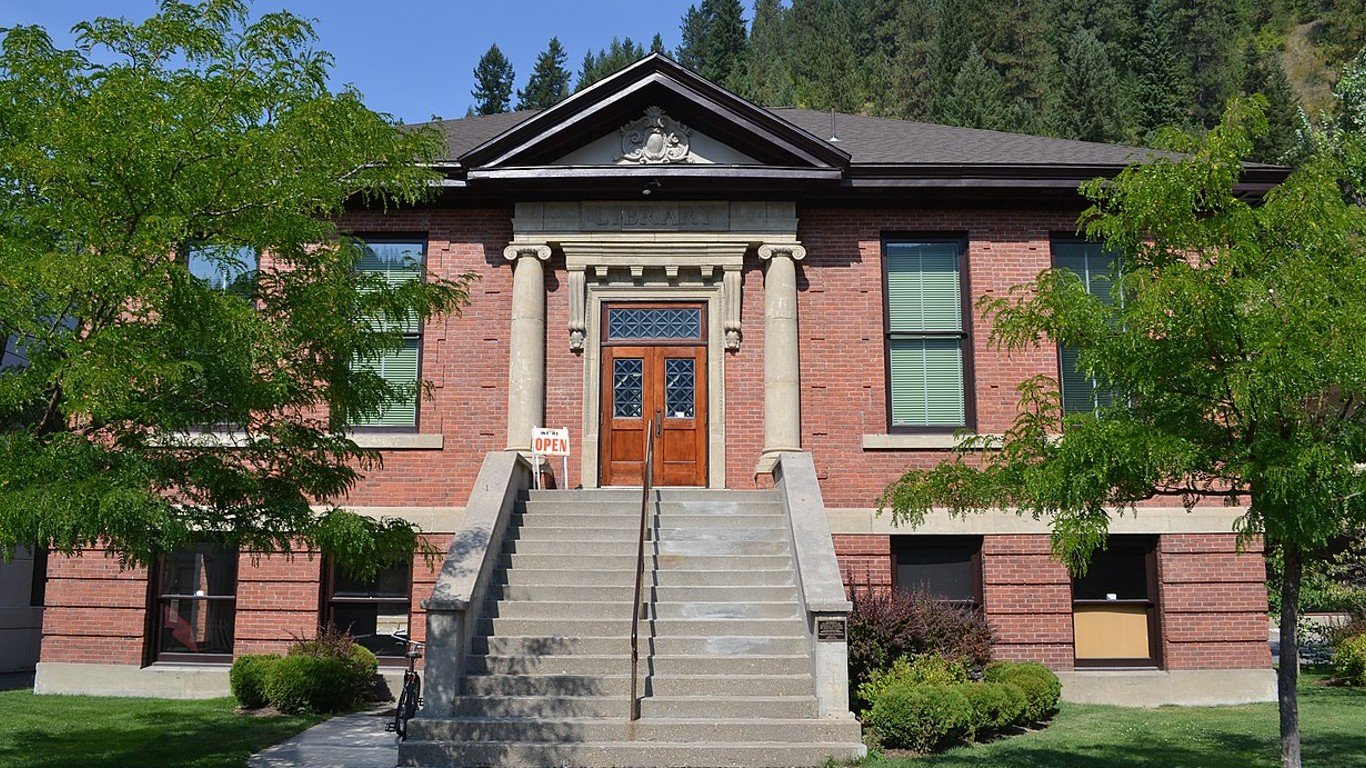
Idaho: Shoshone County
> Largest place in county: Kellogg
> 5-yr. population change: -0.2% (state: +7.4%)
> Poverty rate: 19.4% (state: 13.1%)
> Adults with a bachelor’s degree: 11.5% (state: 27.6%)
> Life expectancy at birth: 75.5 years (state: 79.4 years)
Idaho is one of the fastest growing states in the country, reporting 7.4% population growth over the last five years. Shoshone County, however, a mining region located in northern Idaho along the Montana border, is bucking the trend, reporting a 0.2% population decline over the same period.
Prevailing economic hardships in the area contribute to its ranking as the worst county to live in in the state and may explain population decline. An estimated 19.4% of the population live below the poverty line, compared to 13.1% of Idaho residents. The greater likelihood of poverty means many county residents are less likely to be able to afford health care or healthy lifestyles, which may result in poorer health outcomes. For example, life expectancy at birth in Shoshone County is 75.5 years, about four years shy of the state average.
[recirclink id=880688]
Illinois: Saline County
> Largest place in county: Harrisburg
> 5-yr. population change: -3.5% (state: -0.8%)
> Poverty rate: 21.1% (state: 12.5%)
> Adults with a bachelor’s degree: 19.2% (state: 34.7%)
> Life expectancy at birth: 73.4 years (state: 79.4 years)
The southern Illinois county of Saline, named after the Saline River, ranks as the worst of the state’s 102 counties to live in. An estimated 21.1% of local residents live below the poverty line, well above the 12.5% state poverty rate.
Poverty can have a negative impact on health outcomes, including life expectancy, as poorer Americans often struggle to afford health care and healthy lifestyle choices. Partially as a result, at just 73.4 years, life expectancy at birth in the county is six years below the state average.
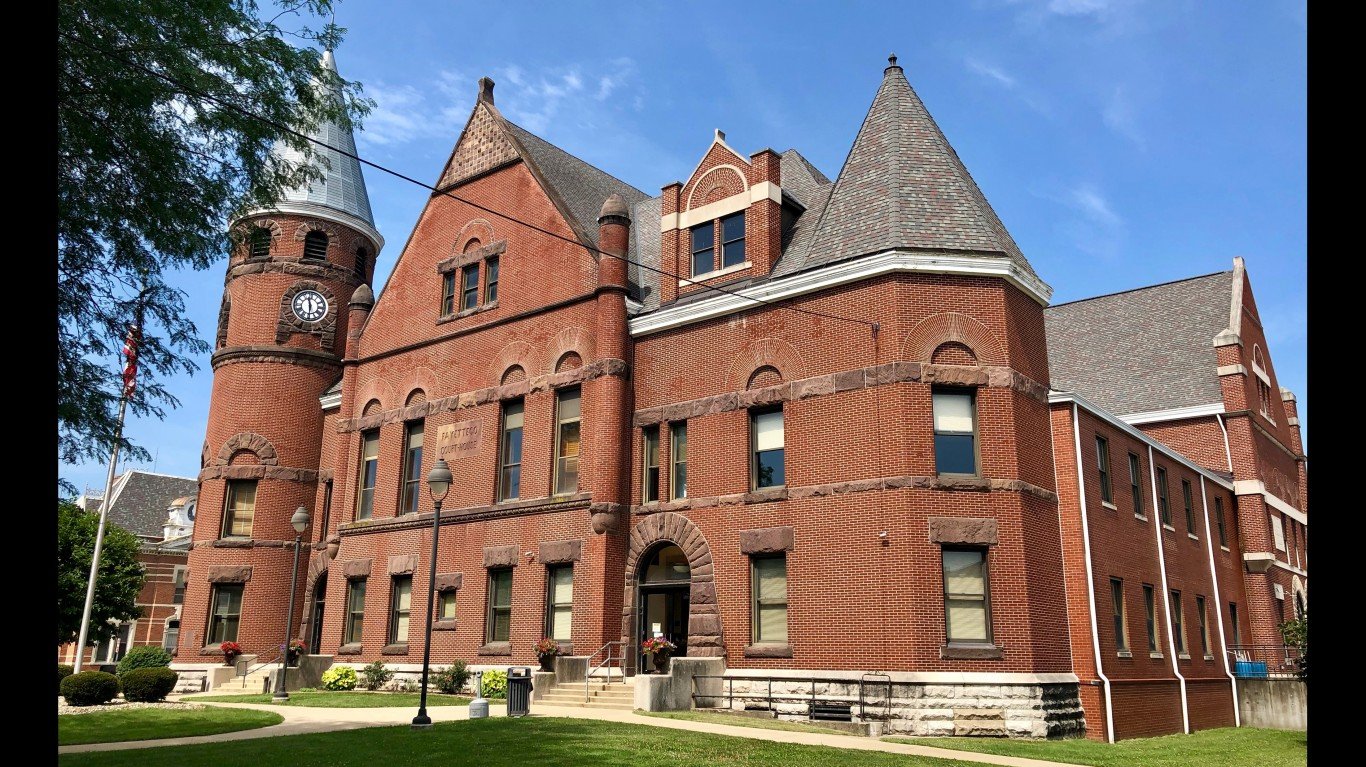
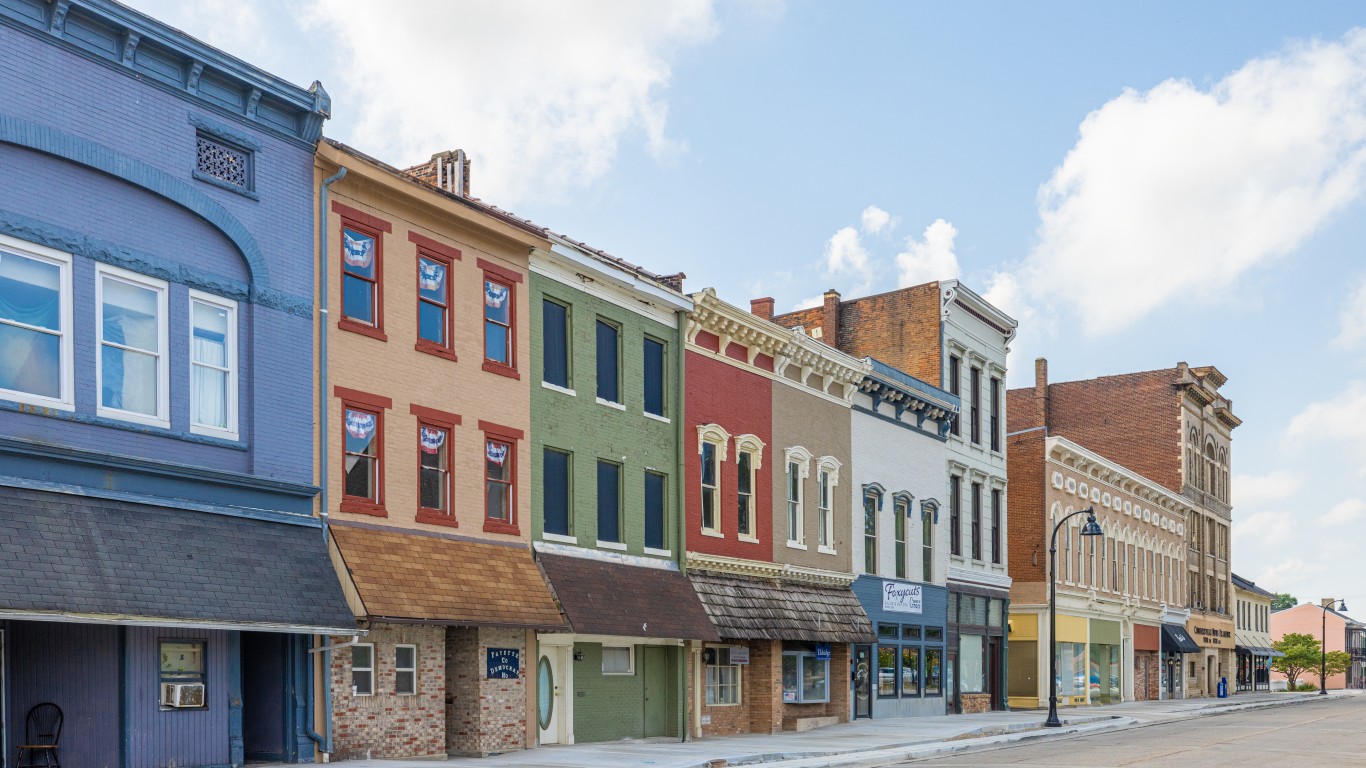
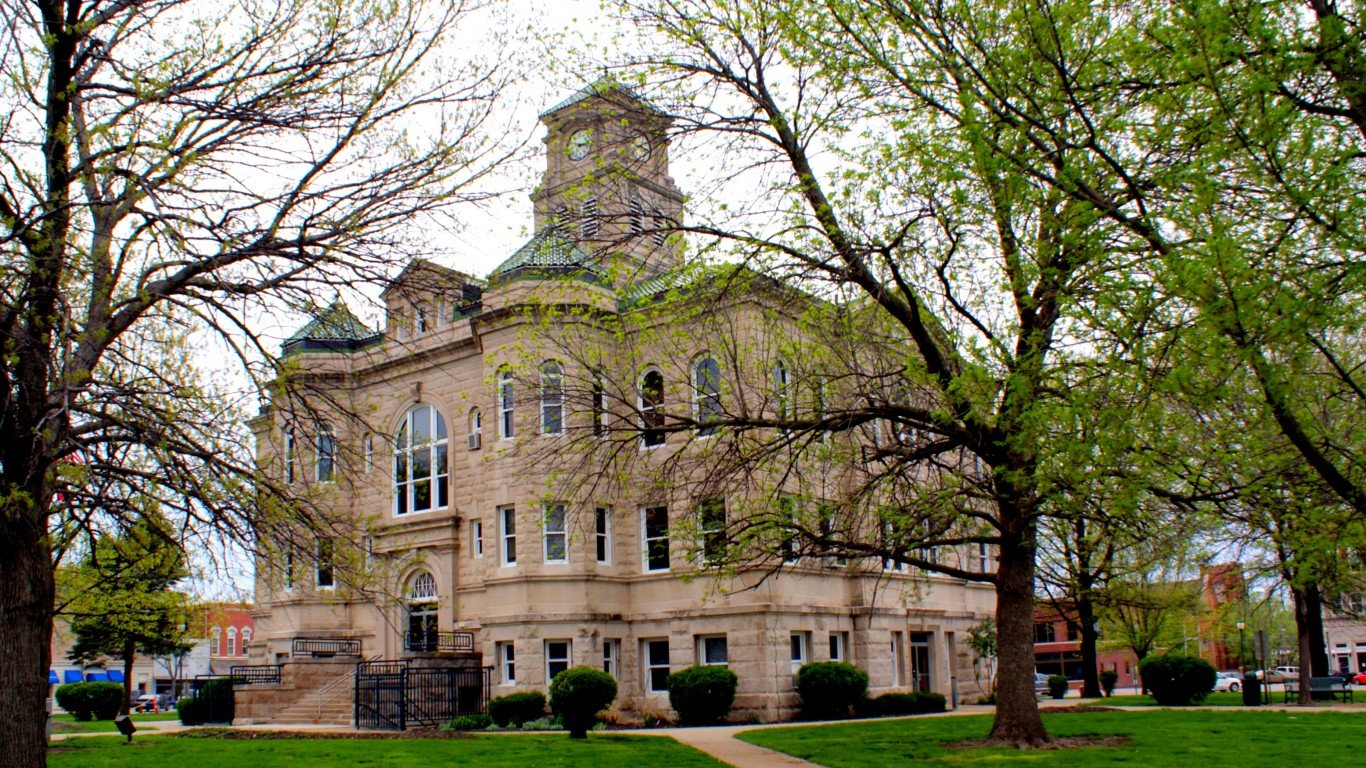
Indiana: Fayette County
> Largest place in county: Connersville
> 5-yr. population change: -3.2% (state: +1.9%)
> Poverty rate: 19.0% (state: 13.4%)
> Adults with a bachelor’s degree: 13.3% (state: 26.5%)
> Life expectancy at birth: 73.0 years (state: 77.1 years)
Fayette County, Indiana, ranks as the worst county to live in in the state. Adults in the area are about half as likely to have a college degree as the typical Indiana resident 25 and older. Financial security tends to improve with educational attainment, and the poverty rate in the county of 19.0% is well above the statewide rate of 13.4%.
Like many U.S. counties lagging in key socioeconomic indicators, Fayette County’s population is shrinking. Over the last five years, the number of people living there contracted by 3.2%, even as Indiana’s population expanded by 1.9%.
[in-text-ad-2]
Iowa: Appanoose County
> Largest place in county: Centerville
> 5-yr. population change: -2.4% (state: +2.0%)
> Poverty rate: 17.7% (state: 11.5%)
> Adults with a bachelor’s degree: 16.3% (state: 28.6%)
> Life expectancy at birth: 77.1 years (state: 79.4 years)
Appanoose County, Iowa, located along the Missouri state border, ranks as the worst county to live in in the state. Life expectancy at birth in the county, at 77.1 years, is over two years below the state average. The area’s poor health outcomes are likely attributable in part to unhealthy behaviors. For example, adults in Appanoose County are less likely to exercise than adults in any of the state’s 98 other counties.
The area’s poor health outcomes are also likely attributable in part to high poverty. Americans living below the poverty line are more likely to struggle to afford health care and healthy lifestyles, and in Appanoose County, 17.7% of the population live below the poverty line, compared to 11.5% of Iowa’s population.
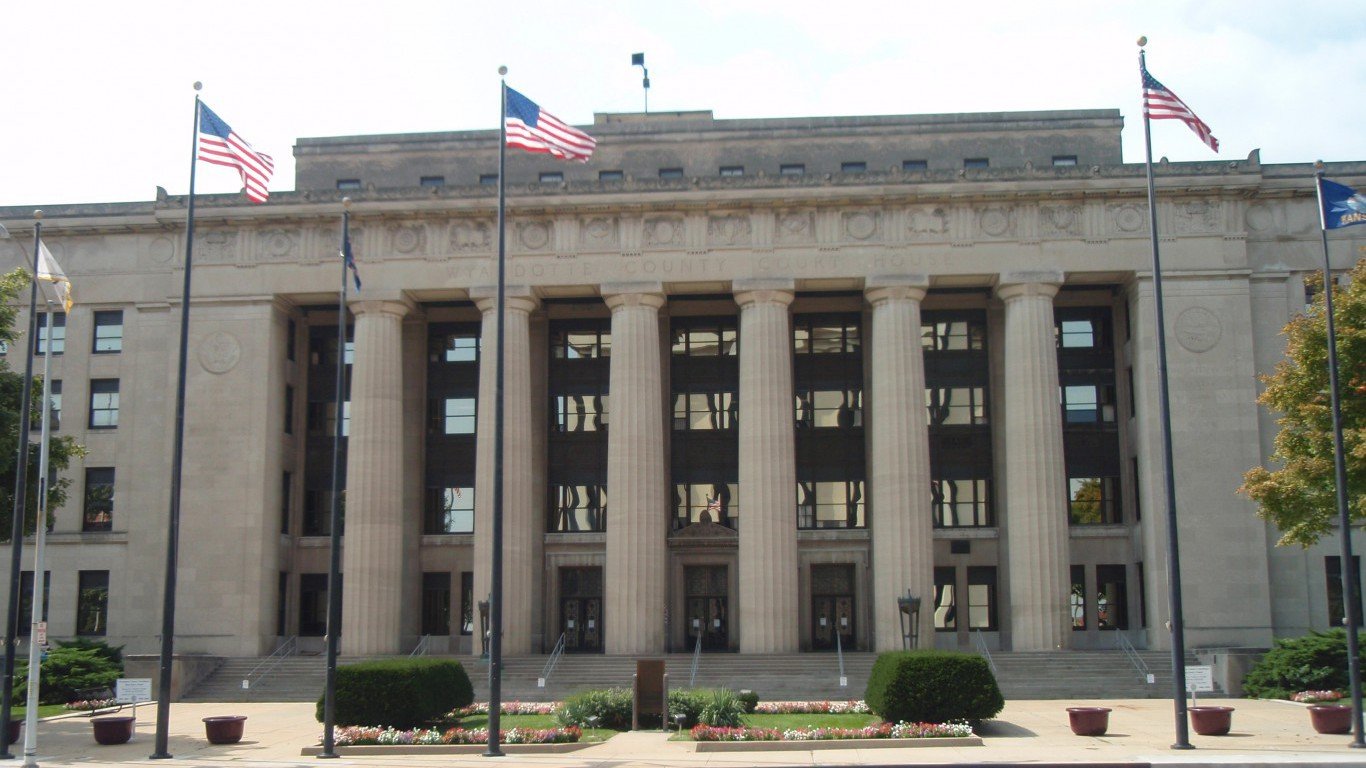
Kansas: Wyandotte County
> Largest place in county: Kansas City
> 5-yr. population change: +3.4% (state: +1.0%)
> Poverty rate: 19.2% (state: 12.0%)
> Adults with a bachelor’s degree: 18.1% (state: 33.4%)
> Life expectancy at birth: 75.8 years (state: 78.5 years)
Wyandotte County, Kansas, situated directly across the state border from Kansas City, Missouri, ranks as the worst county to live in in the state. One of the poorest parts of the state, the county has a 19.2% poverty rate — well above the 12.0% statewide rate.
Both on an individual basis and across broad populations, incomes and financial security tend to rise with educational attainment. In Wyandotte County, only 18.1% of the adult population have bachelor’s degrees, compared to 33.4% of adults in Kansas.
[in-text-ad]

Kentucky: Leslie County
> Largest place in county: Hyden
> 5-yr. population change: -7.6% (state: +1.5%)
> Poverty rate: 38.0% (state: 17.3%)
> Adults with a bachelor’s degree: 8.7% (state: 24.2%)
> Life expectancy at birth: 70.4 years (state: 75.6 years)
Leslie County, Kentucky ranks as the worst place to live in the state. Fewer than one in every 10 area adults have a bachelor’s degree compared to nearly one in every four adults in Kentucky who do. Both on an individual basis and across broad populations, incomes and financial security tend to rise with educational attainment. In Leslie County, 38.0% of the population live below the poverty line, more than double the statewide poverty rate of 17.3%.
Like many U.S. counties lagging in key socioeconomic indicators, Leslie County’s population is shrinking. Over the last five years, the number of people living there fell by 7.6%, even as Kentucky’s population expanded by 1.5%.
[recirclink id=824405]
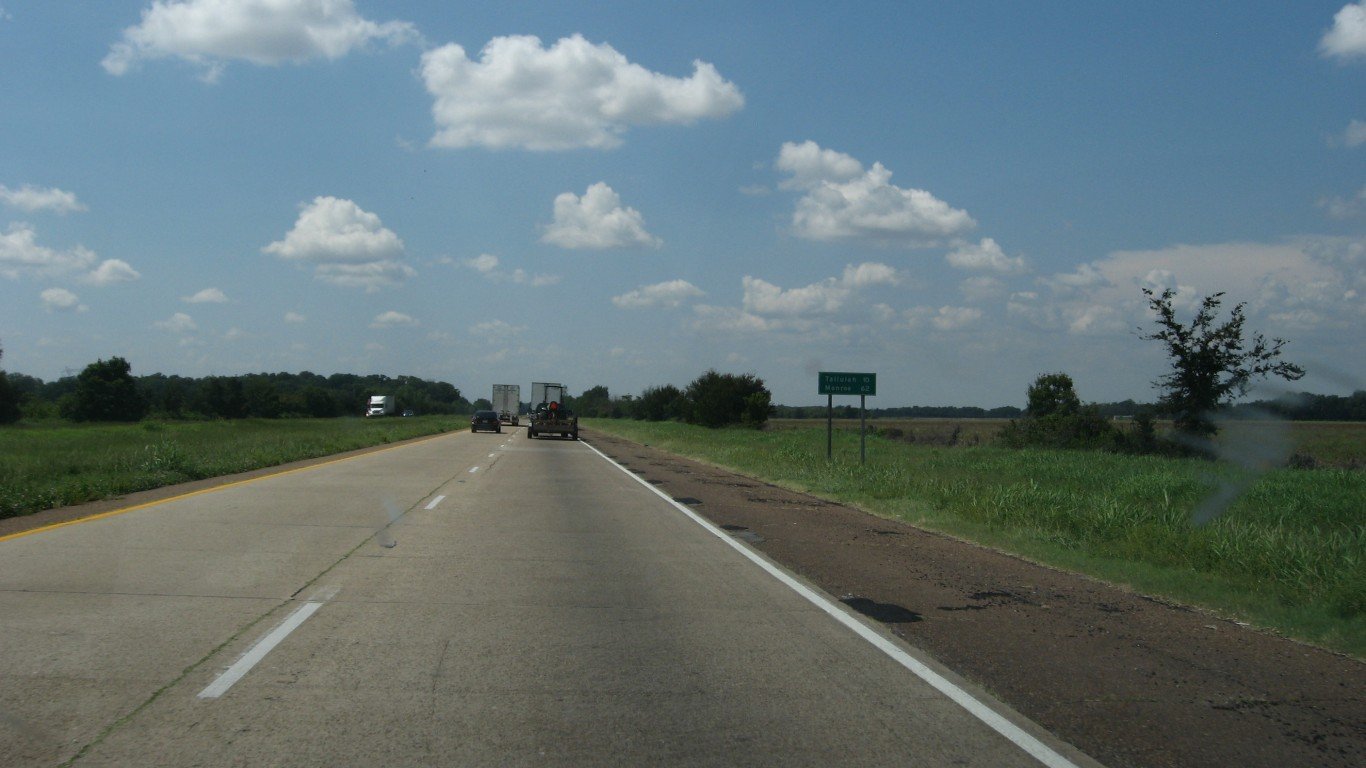
Louisiana: Madison Parish
> Largest place in parish: Tallulah
> 5-yr. population change: -5.8% (state: +1.4%)
> Poverty rate: 36.4% (state: 19.2%)
> Adults with a bachelor’s degree: 12.8% (state: 24.1%)
> Life expectancy at birth: 72.0 years (state: 76.1 years)
Louisiana’s Madison Parish is the worst parish to live in the state. Despite having a strong agricultural industry as one of the state’s leading corn producers, it is one of the poorest counties or county equivalents in the United States. An estimated 36.4% of the local population live below the poverty line, well above the state poverty rate of 19.2%.
Poverty can have a negative impact on health outcomes, including life expectancy, as poorer Americans often struggle to afford health care and healthy lifestyle choices. Partially as a result, at just 72.0 years, life expectancy at birth in the parish is four years below the state average.

Maine: Somerset County
> Largest place in county: Skowhegan
> 5-yr. population change: -2.4% (state: +0.5%)
> Poverty rate: 20.4% (state: 11.8%)
> Adults with a bachelor’s degree: 16.5% (state: 31.8%)
> Life expectancy at birth: 76.5 years (state: 78.7 years)
Somerset County, Maine, stretches from the country’s northern border with Canada down through the central part of the state. The county ranks as the worst county in the state to live in largely because of the prevalence of economic hardship. The county poverty rate of 20.4% is nearly double the 11.8% state poverty rate.
A college education is linked to longer life expectancies, greater financial security, and a stronger sense of control over one’s life. In Somerset County, however, only 16.5% of adults have a bachelor’s degree or higher, nearly half the 31.8% share of adults across Maine who do.
[in-text-ad-2]

Maryland: Somerset County
> Largest place in county: Princess Anne
> 5-yr. population change: -1.8% (state: +2.2%)
> Poverty rate: 21.7% (state: 9.2%)
> Adults with a bachelor’s degree: 14.4% (state: 40.2%)
> Life expectancy at birth: 75.5 years (state: 79.2 years)
Maryland is one of the best-educated states in the country, with a bachelor’s degree attainment rate of over 40%. Not all parts of the state are well educated, however. In Somerset County, located on the Delmarva Peninsula, only 14.4% of the adult population have a four-year degree.
A college education is linked to longer life expectancies and greater financial security. In Somerset County, residents are more than twice as likely to live below the poverty line as the typical Maryland resident, and life expectancy at birth is nearly four years shy of the state average of 79.2 years.

Massachusetts: Hampden County
> Largest place in county: Springfield
> 5-yr. population change: +0.3% (state: +2.9%)
> Poverty rate: 16.4% (state: 10.3%)
> Adults with a bachelor’s degree: 27.1% (state: 43.7%)
> Life expectancy at birth: 78.2 years (state: 80.6 years)
Hampden County, located in southern Massachusetts along the Connecticut border, ranks as the worst county in which to live in the state. Of the 14 counties in the state, Hampden has the lowest bachelor’s degree attainment rate, at 27.1%. Meanwhile, 43.7% of adults across Massachusetts have a bachelor’s degree or higher.
Hampden County also has some of the worst health outcomes in the state. Life expectancy at birth in the county is 78.2 years, nearly 2.5 years below the statewide average.
[in-text-ad]
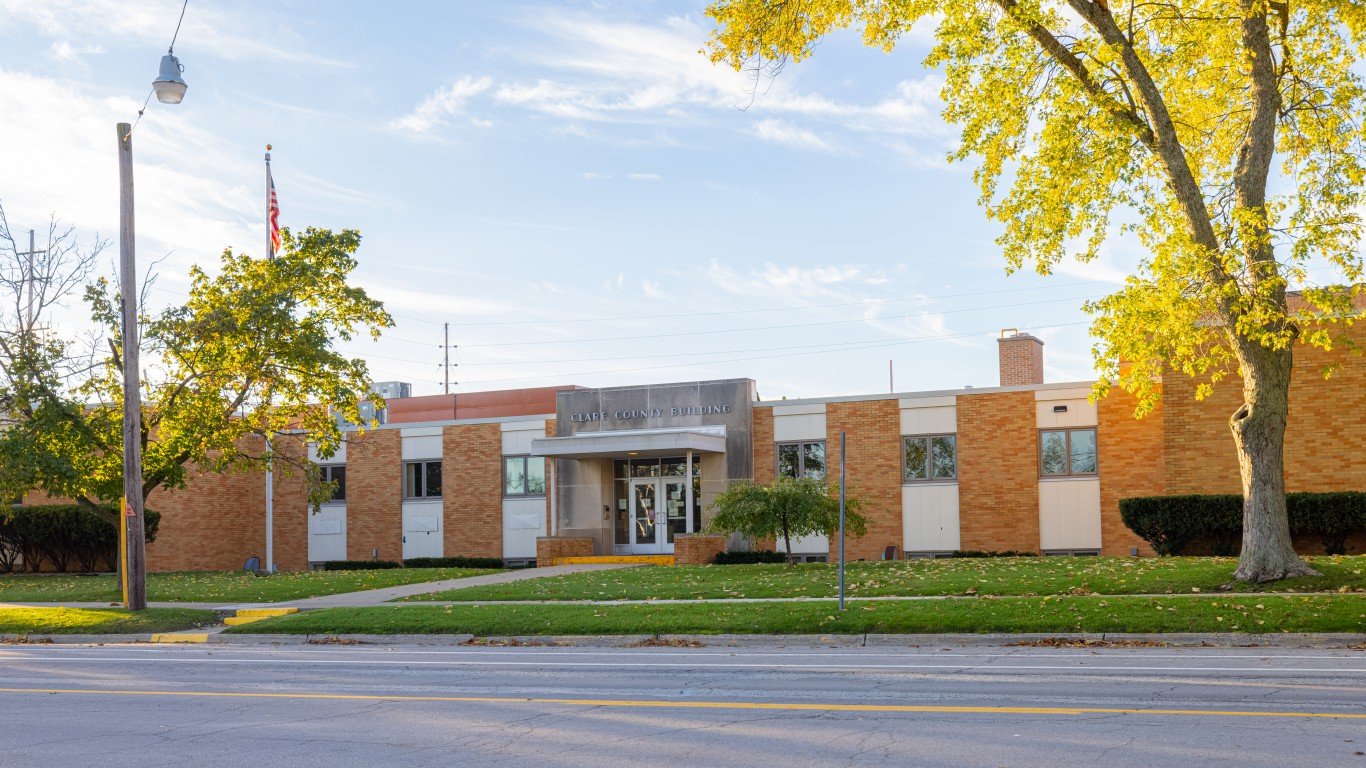
Michigan: Clare County
> Largest place in county: Clare
> 5-yr. population change: -0.4% (state: +0.8%)
> Poverty rate: 22.7% (state: 14.4%)
> Adults with a bachelor’s degree: 12.6% (state: 29.1%)
> Life expectancy at birth: 74.9 years (state: 78.1 years)
Clare County, Michigan, is centrally located on the state’s Lower Peninsula. A college education is linked to longer life expectancies, greater financial security, and a stronger sense of control over one’s life — and Clare County has one of the lowest bachelor’s degree attainment rates in Michigan. Only 12.6% of the local adult population have a bachelor’s degree or higher, less than half the 29.1% share of adults with a college degree across the state.
Health outcomes in Clare County also lag behind much of the state. Life expectancy at birth in the state is just 74.9 years, over three years shorter than the average across Michigan.
[recirclink id=880865]
Minnesota: Wadena County
> Largest place in county: Wadena
> 5-yr. population change: -0.7% (state: +3.3%)
> Poverty rate: 14.3% (state: 9.7%)
> Adults with a bachelor’s degree: 13.8% (state: 36.1%)
> Life expectancy at birth: 76.1 years (state: 80.9 years)
Wadena County ranks as the worst place to live in Minnesota. Life expectancy at birth in the county is nearly half a decade less than it is across the state as a whole. College-educated adults are more likely to report better health outcomes than those without a college degree, and in Wadena County, just 13.8% of the 25 and older population have a bachelor’s degree or higher, about half the share of adults with a four-year degree across Minnesota.
Like many U.S. counties lagging in key socioeconomic indicators, Wadena County’s population is shrinking. Over the last five years, the number of people living there fell by 0.7%, even as Minnesota’s population expanded by 3.3%.
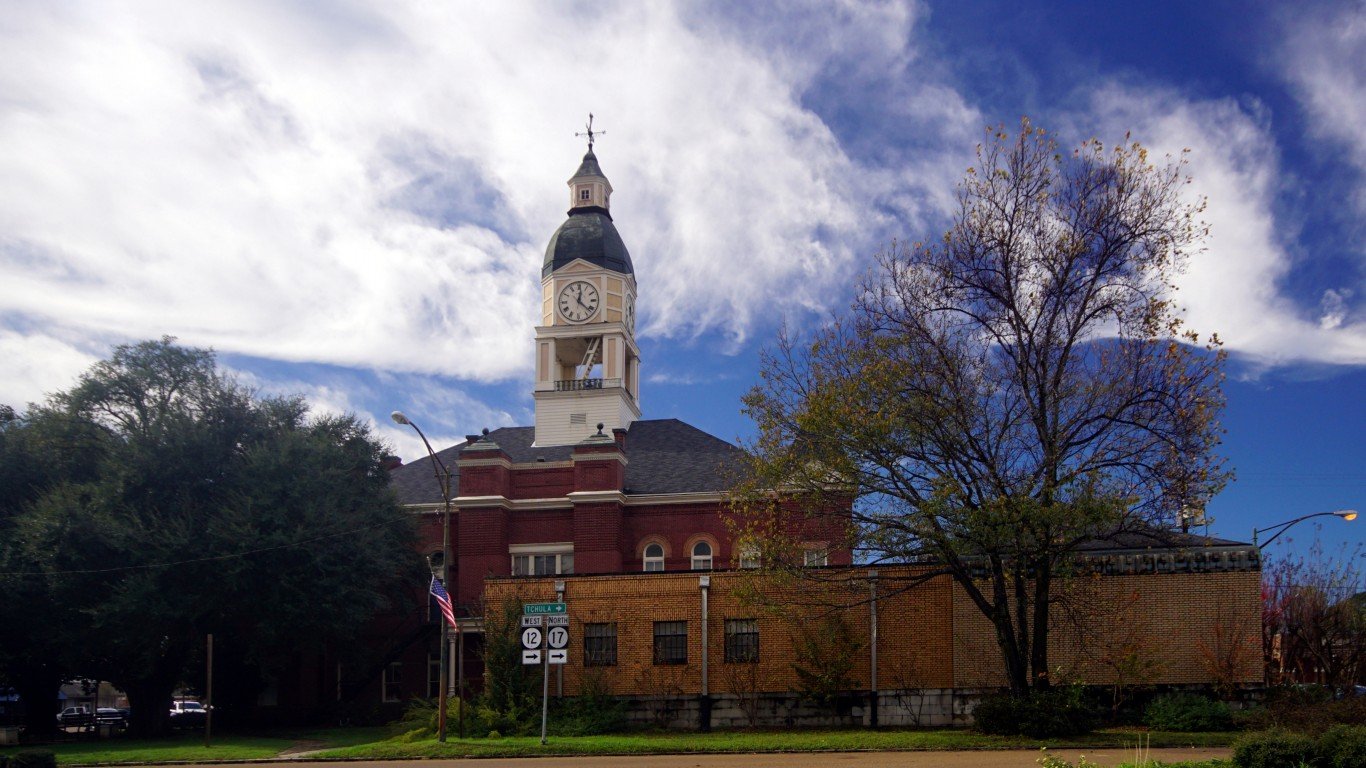
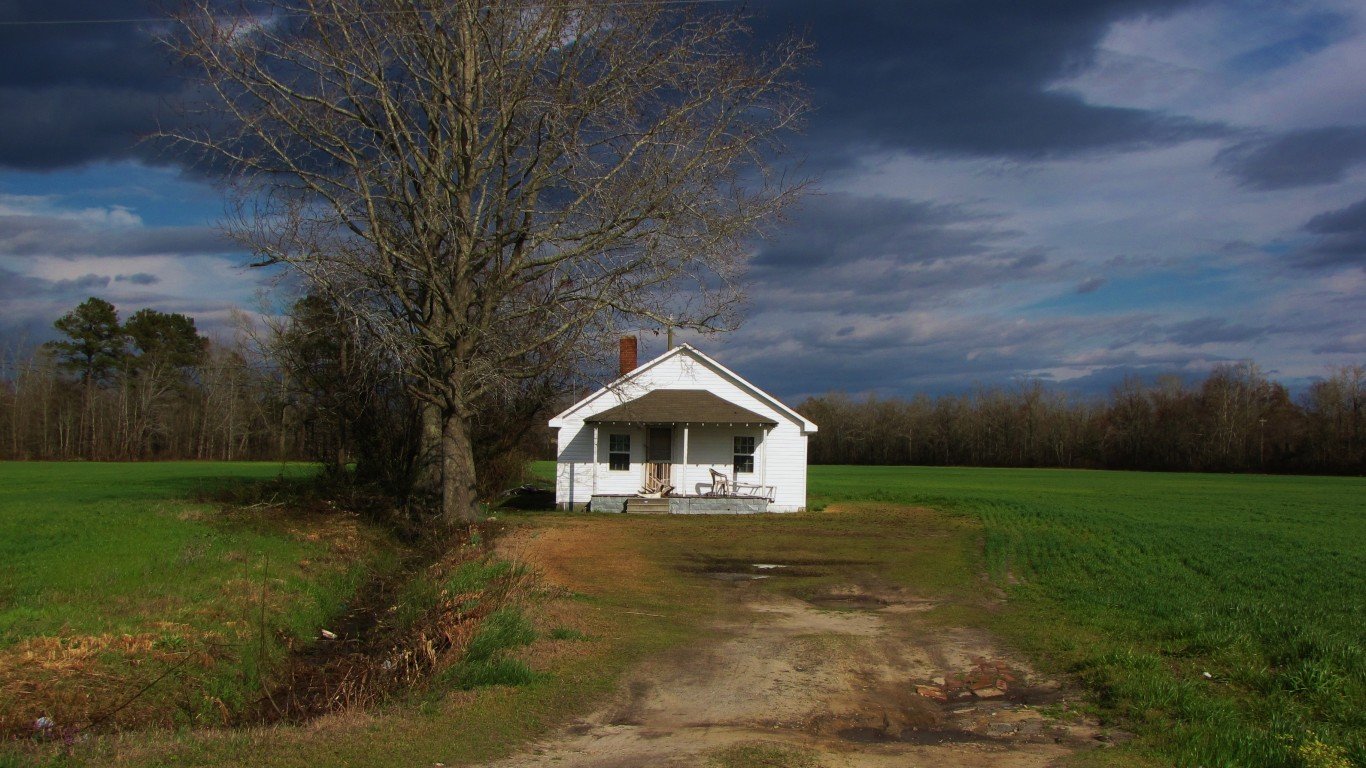
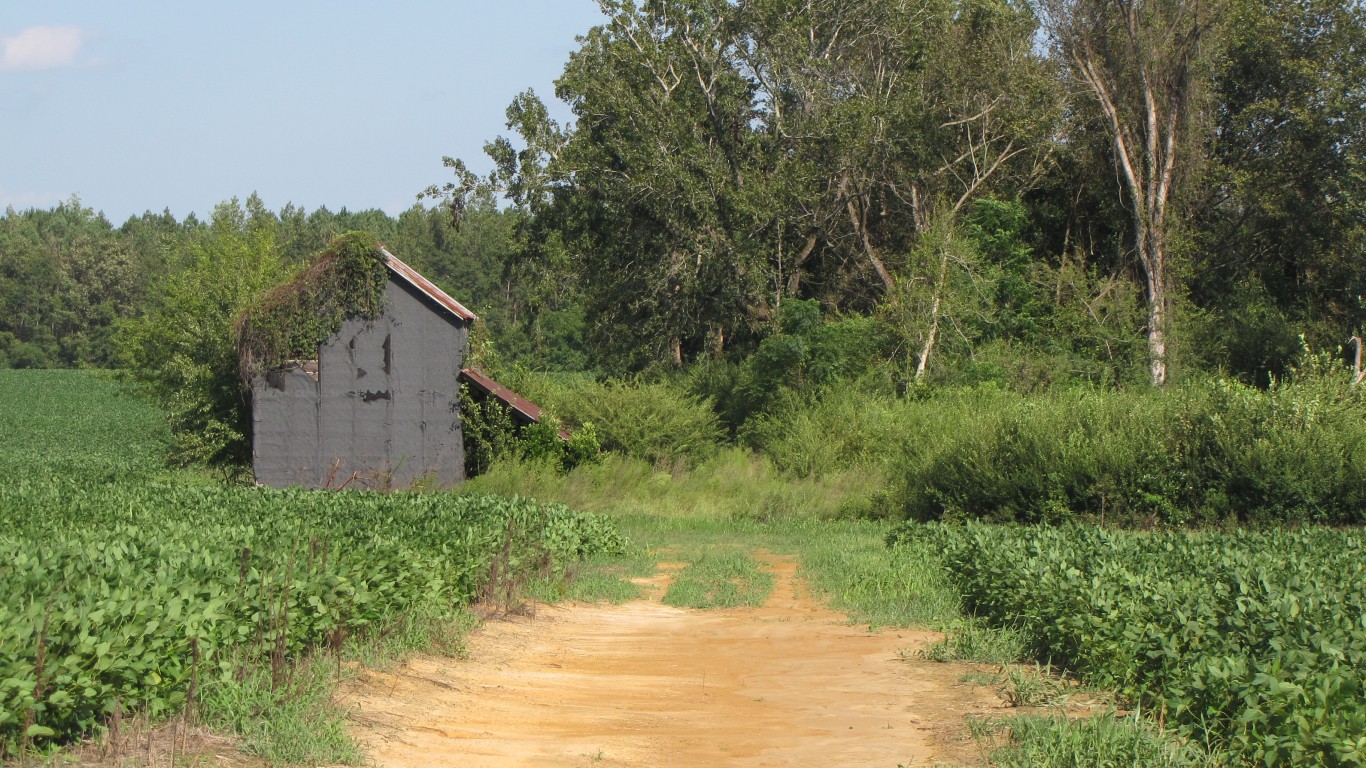
Mississippi: Holmes County
> Largest place in county: Durant
> 5-yr. population change: -6.5% (state: +0.002%)
> Poverty rate: 42.4% (state: 20.3%)
> Adults with a bachelor’s degree: 10.2% (state: 22.0%)
> Life expectancy at birth: 70.6 years (state: 74.9 years)
Holmes County, located in central Mississippi, ranks as the worst county to live in in the state. Mississippi is the poorest state in the country, with a 20.3% poverty rate — and Holmes County is the poorest county in the state, with a 42.4% poverty rate, more than double the rate across Mississippi.
Poverty can have a negative impact on health outcomes, including life expectancy, as poorer Americans often struggle to afford health care and healthy lifestyle choices. Partially as a result, life expectancy at birth in Holmes County is just 70.6 years, well below the 74.9 year average life expectancy statewide and 79.2 year average nationwide.
[in-text-ad-2]
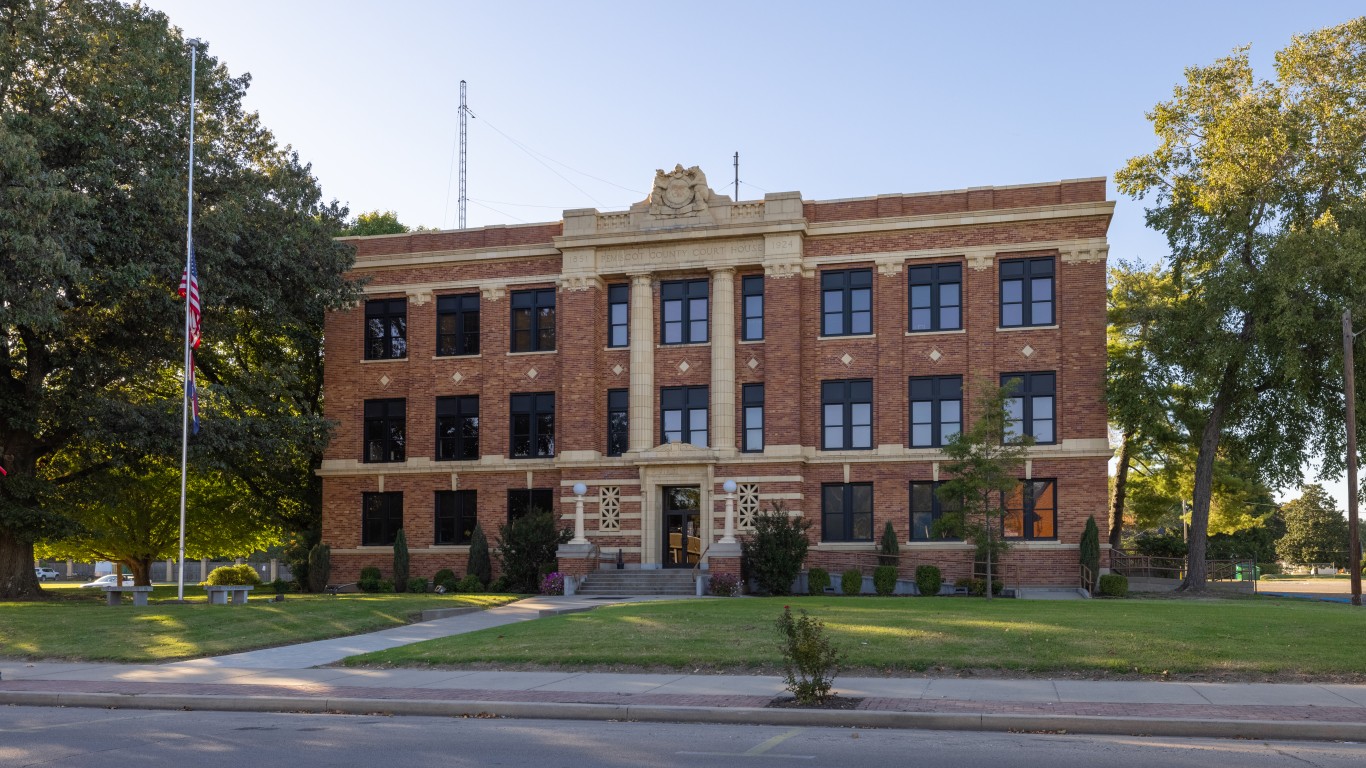
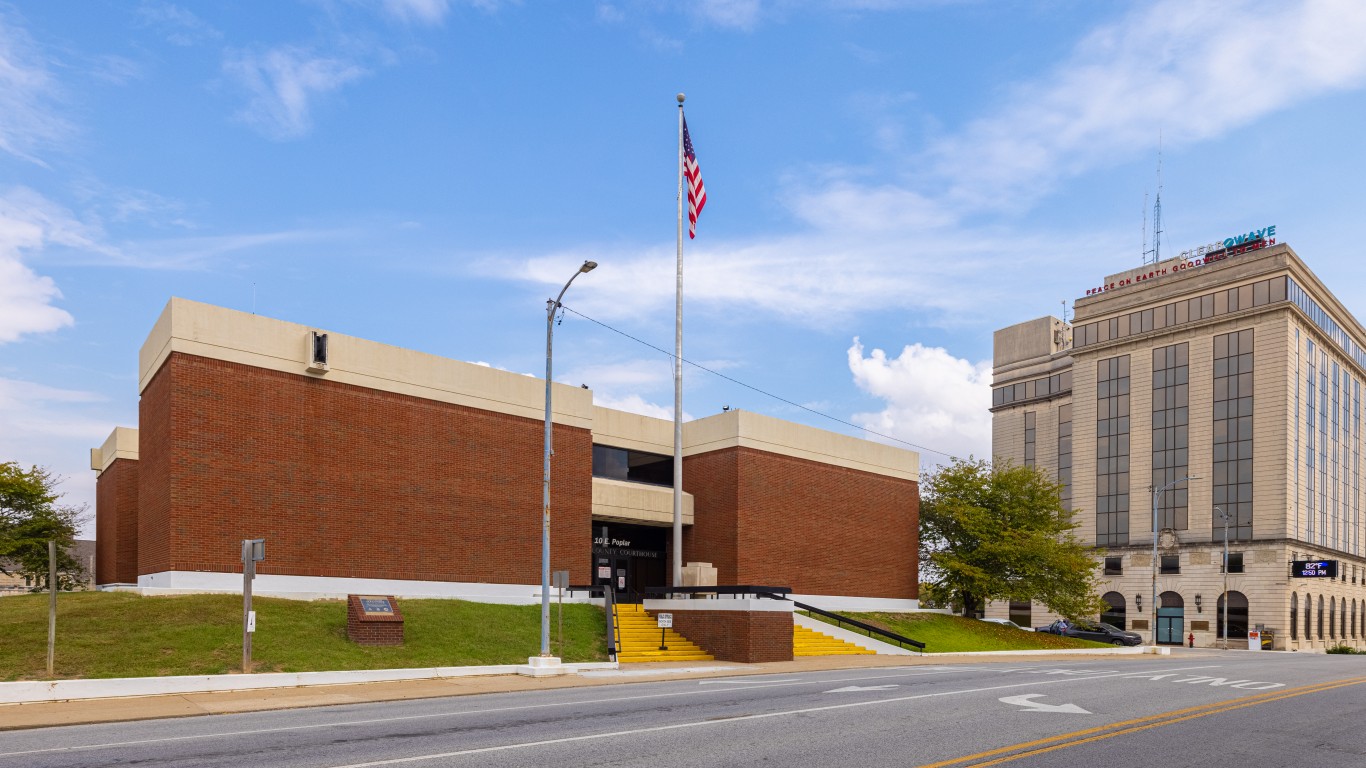
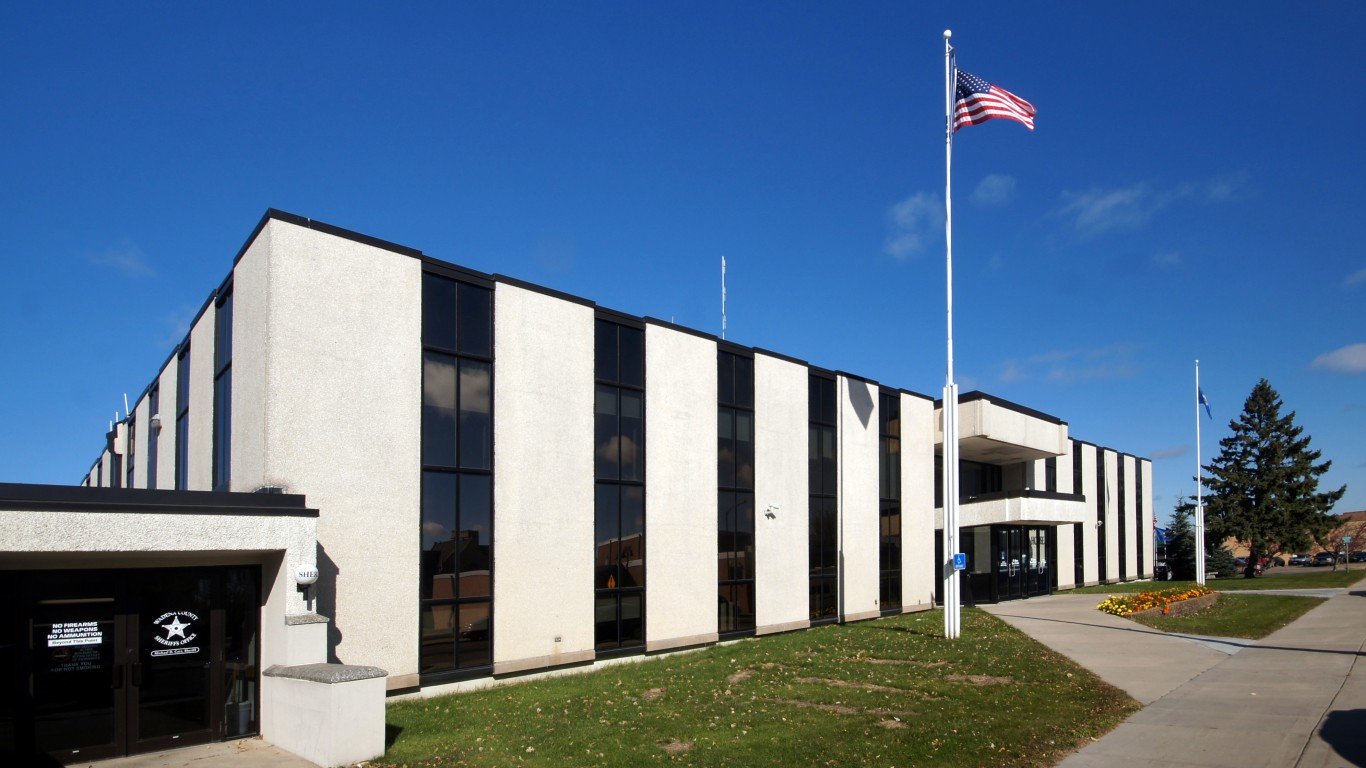
Missouri: Pemiscot County
> Largest place in county: Caruthersville
> 5-yr. population change: -7.5% (state: +1.3%)
> Poverty rate: 27.4% (state: 13.7%)
> Adults with a bachelor’s degree: 12.7% (state: 29.2%)
> Life expectancy at birth: 71.5 years (state: 77.3 years)
Pemiscot County ranks as the worst county to live in in Missouri. The local poverty rate of 27.4% is double the 13.7% poverty rate across the state. Health outcomes in the county also lag behind much of the rest of the state. Life expectancy at birth in the state is just 71.5 years, well below the 77.3 year average across Missouri.
Like many U.S. counties lagging in key socioeconomic indicators, Pemiscot County’s population is shrinking. Over the last five years, the number of people living there fell by 7.5%, even as Missouri’s population expanded by 1.3%.
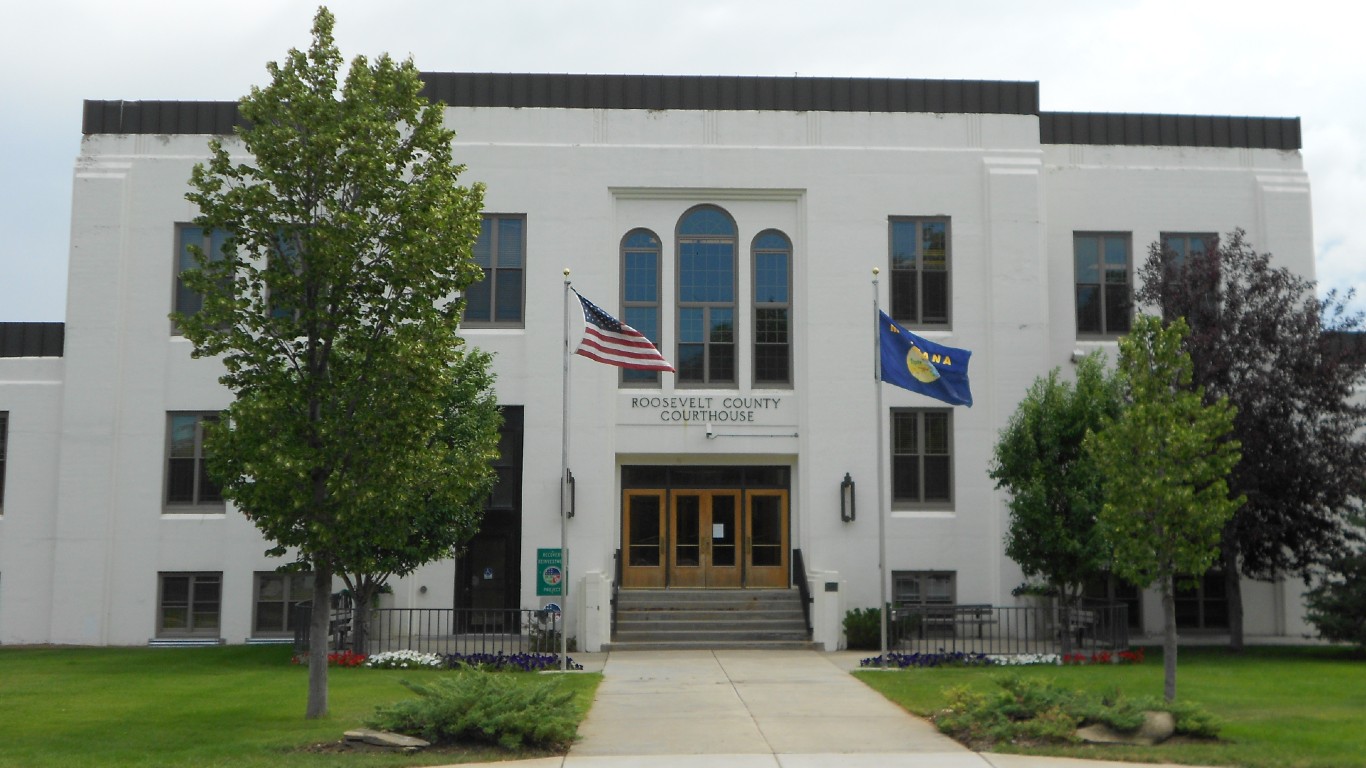
Montana: Roosevelt County
> Largest place in county: Wolf Point
> 5-yr. population change: +2.9% (state: +4.4%)
> Poverty rate: 28.3% (state: 13.1%)
> Adults with a bachelor’s degree: 17.4% (state: 32.0%)
> Life expectancy at birth: 67.7 years (state: 78.9 years)
Roosevelt County, Montana, is located near the northeast corner of the state largely within the Fort Peck Indian Reservation. Due to a number of historical and contemporary factors, many Indian reservations are among the poorest communities in the United States — and Roosevelt County is no exception. An estimated 28.3% of the population live below the poverty line, more than double the 13.1% share of Montana residents.
Health outcomes in the county are also far worse than they are in much of the rest of the state. Life expectancy at birth in Roosevelt is just 67.7 years, over 11 years below the 78.9 year state average. Partially as a result, Roosevelt County ranks as the worst county to live in in Montana.
[in-text-ad]
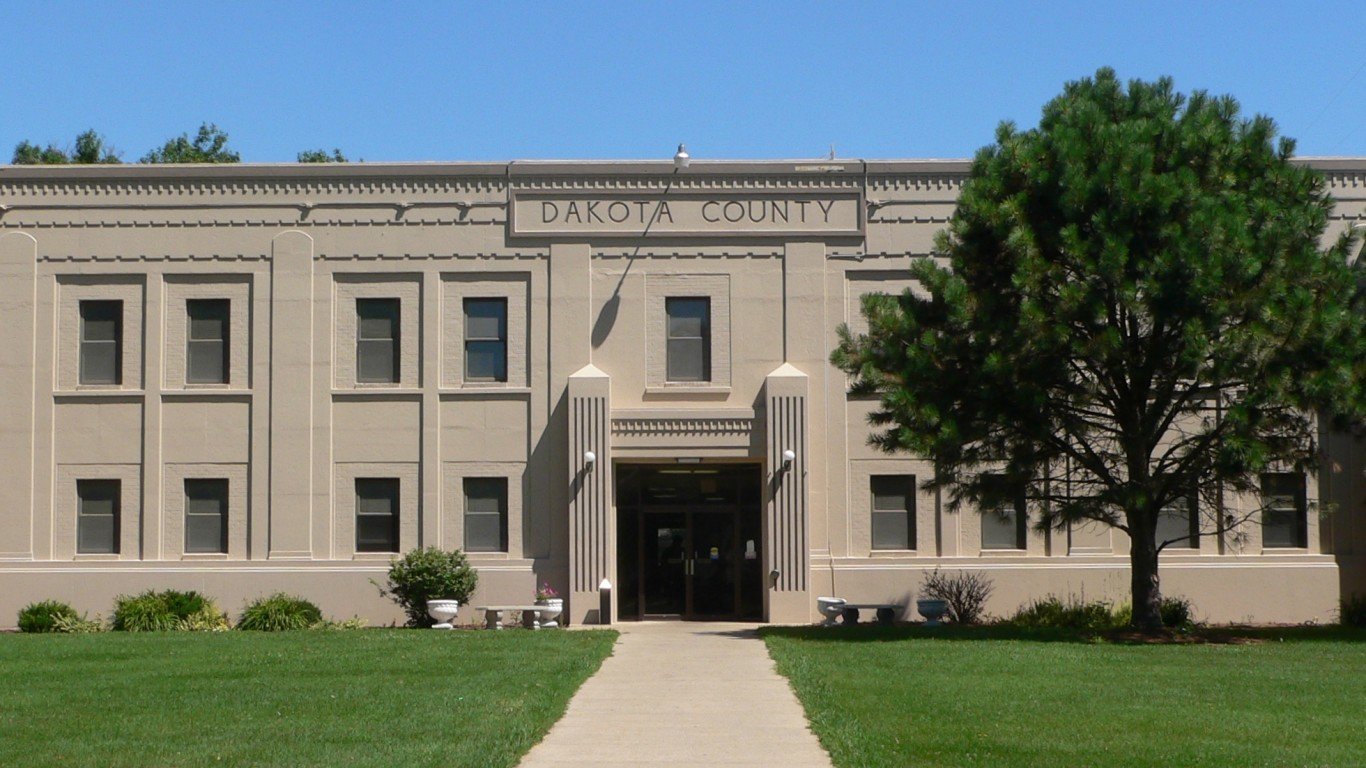
Nebraska: Dakota County
> Largest place in county: South Sioux City
> 5-yr. population change: -3.5% (state: +3.2%)
> Poverty rate: 16.2% (state: 11.1%)
> Adults with a bachelor’s degree: 13.0% (state: 31.9%)
> Life expectancy at birth: 79.1 years (state: 79.6 years)
Dakota County, located in the northeastern corner of Nebraska, ranks as the worst place to live in the state. Life expectancy in the county, at 79.1 years, is half a year shorter than it is across the state as a whole. Additionally, the local 16.2% poverty rate is among the five highest of the 93 counties in the state and well above the 11.1% poverty rate across Nebraska.
Like many U.S. counties lagging in key socioeconomic indicators, Dakota County’s population is shrinking. Over the last five years, the number of people living there fell by 3.5%, even as Nebraska’s population expanded by 3.2%.
[recirclink id=880688]
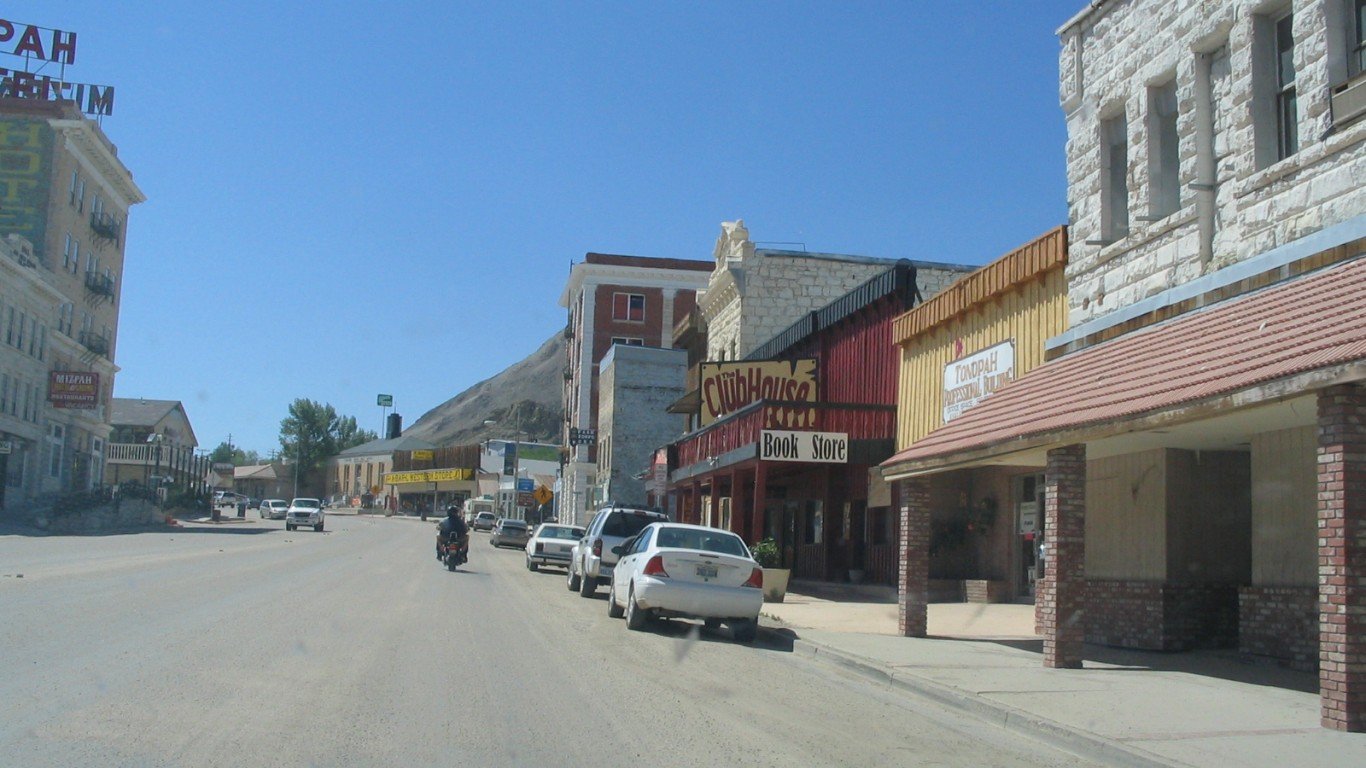
Nevada: Nye County
> Largest place in county: Pahrump
> 5-yr. population change: +3.4% (state: +7.6%)
> Poverty rate: 16.4% (state: 13.1%)
> Adults with a bachelor’s degree: 10.7% (state: 24.7%)
> Life expectancy at birth: 74.2 years (state: 78.7 years)
Of the 17 counties and equivalents in Nevada, Nye County, located along the state’s southern border with California and extending north towards the center of the state, ranks as the worst to live in. At just 74.2 years, life expectancy in Nye County is nearly half a decade lower than it is across Nevada as a whole.
A college education is linked to longer life expectancies, greater financial security, and a stronger sense of control over one’s life. In Nye County, only 10.7% of adults have a bachelor’s degree or higher, less than half the 24.7% share of adults across Nevada who do.
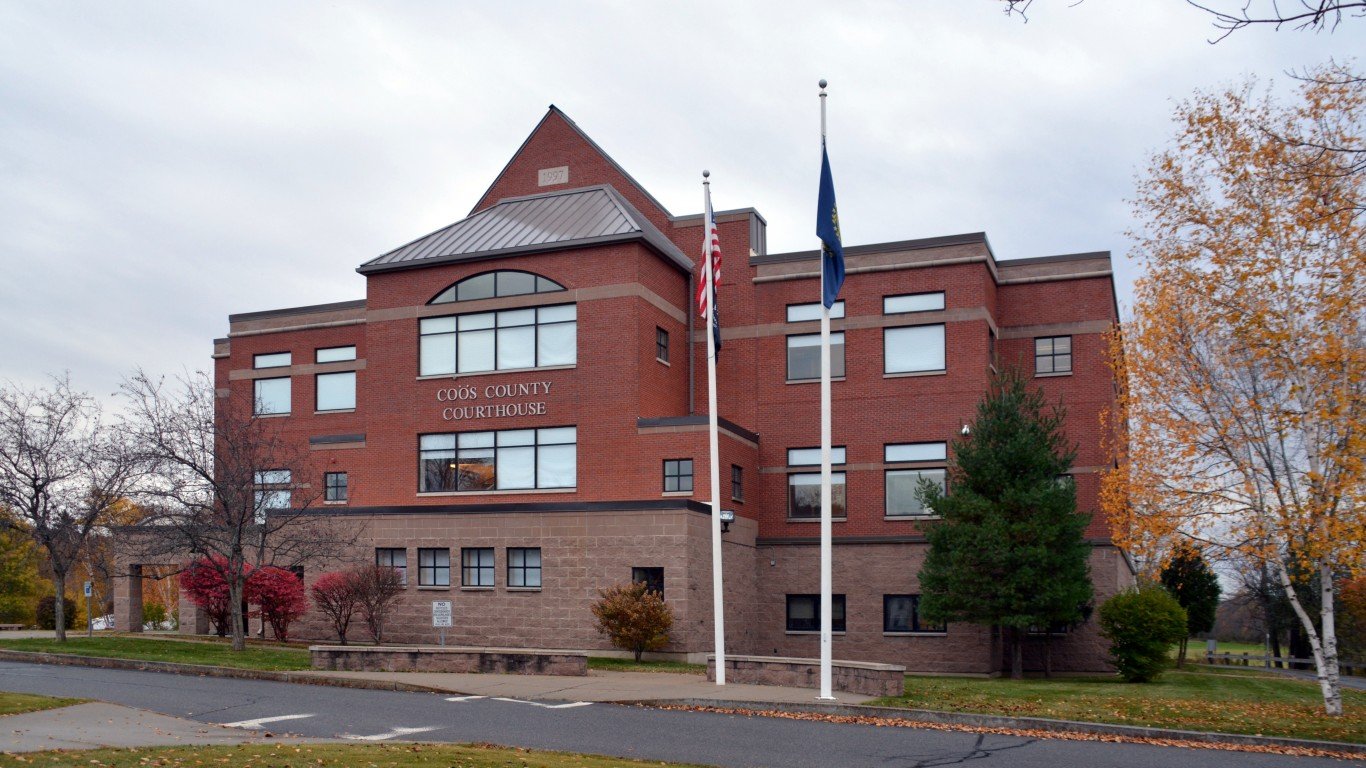
New Hampshire: Coos County
> Largest place in county: Berlin
> 5-yr. population change: -1.4% (state: +2.0%)
> Poverty rate: 12.5% (state: 7.6%)
> Adults with a bachelor’s degree: 18.2% (state: 37.0%)
> Life expectancy at birth: 77.3 years (state: 79.7 years)
Coos County covers the northernmost tip of New Hampshire, bordering Canada, Maine, and Vermont. Of the 10 counties in New Hampshire, Coos ranks as the worst to live in. The 12.5% poverty rate in the county is the highest in the state and well above the 7.6% rate across New Hampshire.
Certain health outcomes in Coos County are also worse than every other county in the state. Life expectancy at birth is just 77.3 years, over two years less than the life expectancy across New Hampshire.
[in-text-ad-2]
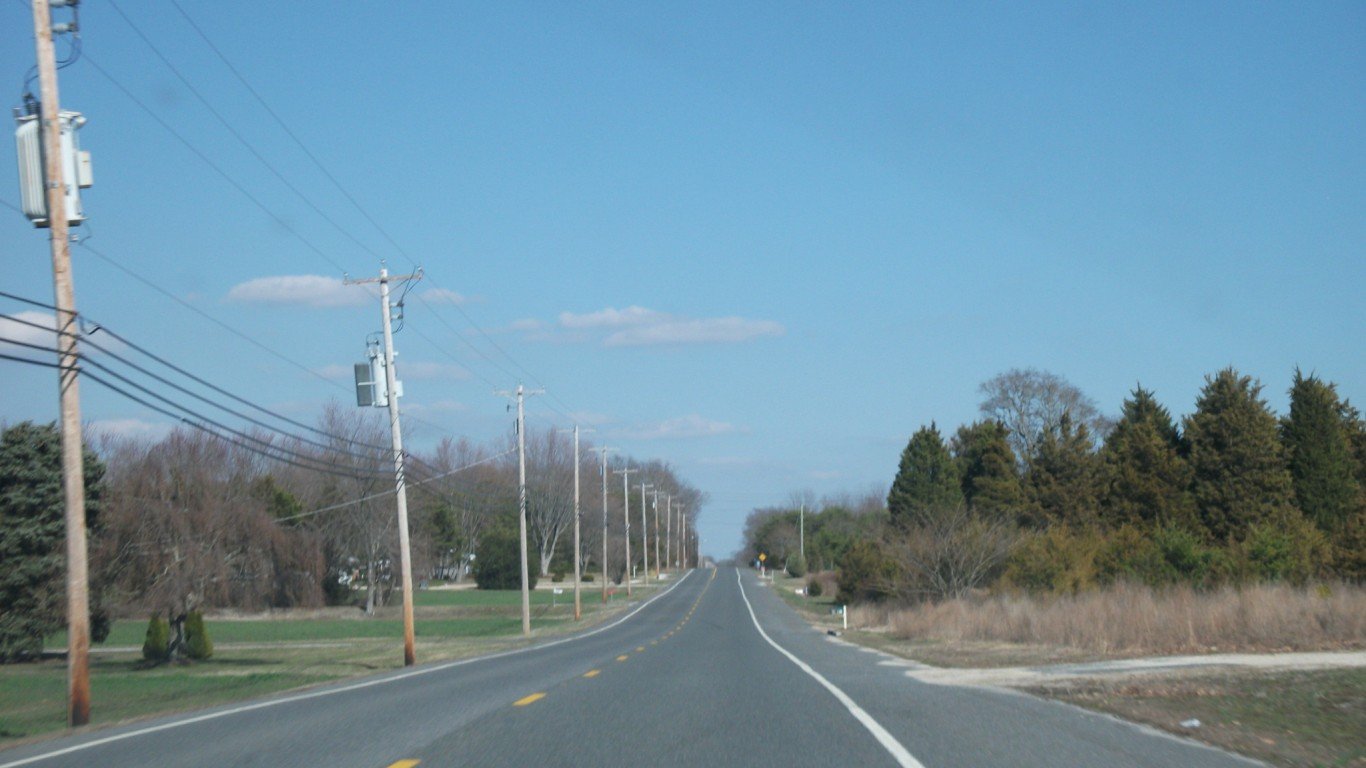
New Jersey: Cumberland County
> Largest place in county: Vineland
> 5-yr. population change: -3.5% (state: +0.05%)
> Poverty rate: 16.5% (state: 10.0%)
> Adults with a bachelor’s degree: 15.6% (state: 39.7%)
> Life expectancy at birth: 75.3 years (state: 80.5 years)
Of the 21 counties that make up New Jersey, Cumberland County along the state’s southern border ranks as the worst to live in. The 16.5% local poverty rate means that county residents are the most likely to live below the poverty line in the state. For context, New Jersey’s poverty rate is much lower, at 10.0%.
Cumberland County also has some of the worst health outcomes in the state. Life expectancy at birth in the county is just 75.3 years, over five years below the statewide average.
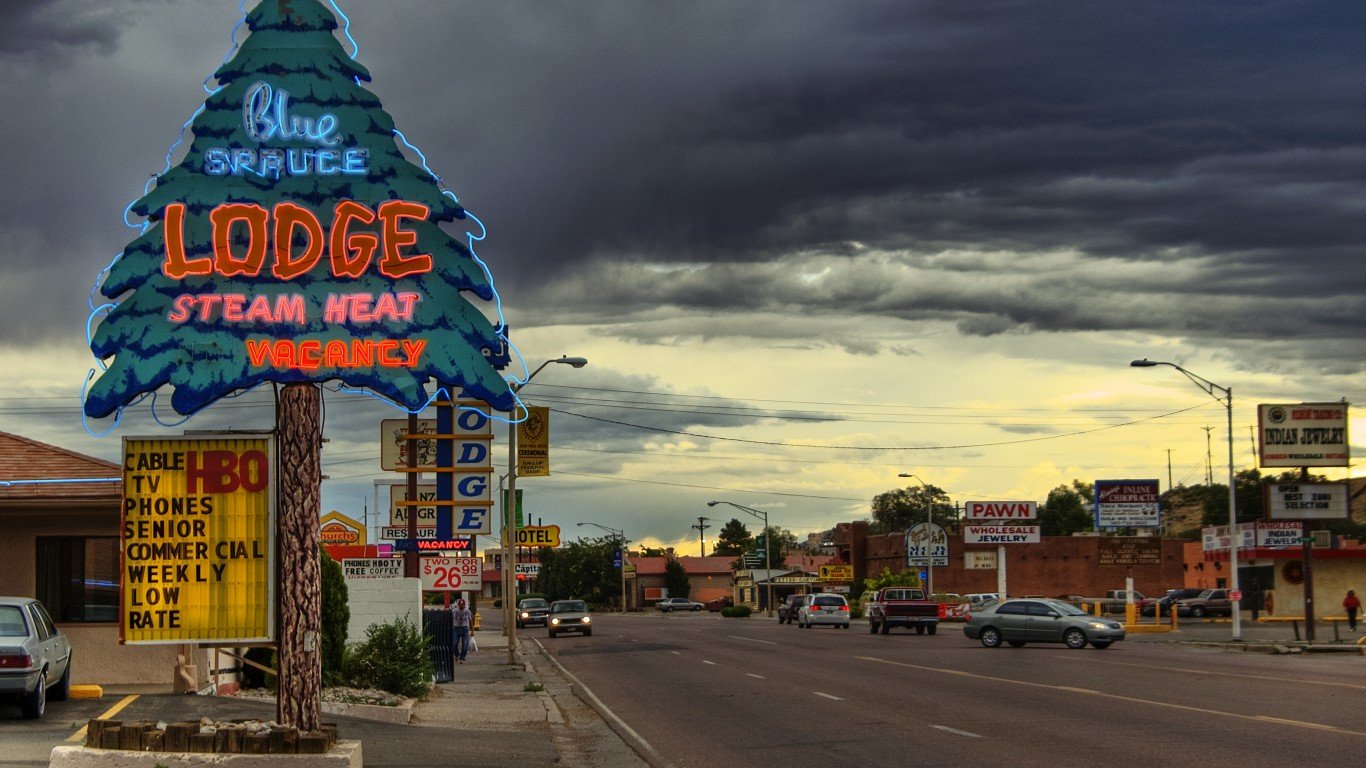
New Mexico: McKinley County
> Largest place in county: Gallup
> 5-yr. population change: -0.9% (state: +0.6%)
> Poverty rate: 34.8% (state: 19.1%)
> Adults with a bachelor’s degree: 11.4% (state: 27.3%)
> Life expectancy at birth: 71.9 years (state: 78.0 years)
McKinley County, located in northwestern New Mexico encompassing parts of the Navajo Nation and Zuni Pueblo, ranks as the worst place to live in the state. Due to a number of historical and contemporary factors, many Indian reservations are among the poorest communities in the United States — and McKinley County is no exception. An estimated 34.8% of the population live below the poverty line, well above the 19.1% share of New Mexico residents.
Life expectancy in the county also lags considerably behind much of the rest of the state. Average life expectancy at birth in McKinley County is only 71.9 years, compared to the 78.0 year average across New Mexico.
[in-text-ad]

New York: Bronx County
> Largest place in county: New York City
> 5-yr. population change: +1.5% (state: -0.1%)
> Poverty rate: 28.0% (state: 14.1%)
> Adults with a bachelor’s degree: 20.1% (state: 36.6%)
> Life expectancy at birth: 80.9 years (state: 81.4 years)
Bronx County, one of the five boroughs of New York City, ranks as the worst place to live in New York state. The 28.0% poverty rate in the Bronx is the highest of any of New York’s 62 counties and nearly double the 14.1% state poverty rate. The area’s high poverty is likely due in part to widespread unemployment. As of May 2021, the unemployment rate in the Bronx was 13.5%, the highest of any county in the state and well above the 7.8% jobless rate across New York.
Widespread economic insecurity in the Bronx is likely due in part to low educational attainment rates. Only 72.8% of adults in the county have completed high school, and 20.1% have a bachelor’s degree. Meanwhile, across the state, 86.8% of adults have completed high school, and 36.6% of adults have a bachelor’s degree.
[recirclink id=824405]
North Carolina: Robeson County
> Largest place in county: Lumberton
> 5-yr. population change: -1.7% (state: +5.3%)
> Poverty rate: 27.7% (state: 14.7%)
> Adults with a bachelor’s degree: 13.7% (state: 31.3%)
> Life expectancy at birth: 72.8 years (state: 78.1 years)
Robeson County, North Carolina, which sits along the South Carolina border, ranks as the worst county to live in in the state. At just 72.8 years, life expectancy at birth in the county is over half a decade below the statewide average. Americans with a college education are statistically more likely to live longer, healthier lives than those with lower educational attainment. In Robeson County, only 13.7% of the 25 and older population have a bachelor’s degree, compared to 31.3% of adults in North Carolina.
Like many U.S. counties lagging in key socioeconomic indicators, Robeson County’s population is shrinking. Over the last five years, the number of people living there fell by 1.7%, even as North Carolina’s population expanded by 5.3%.
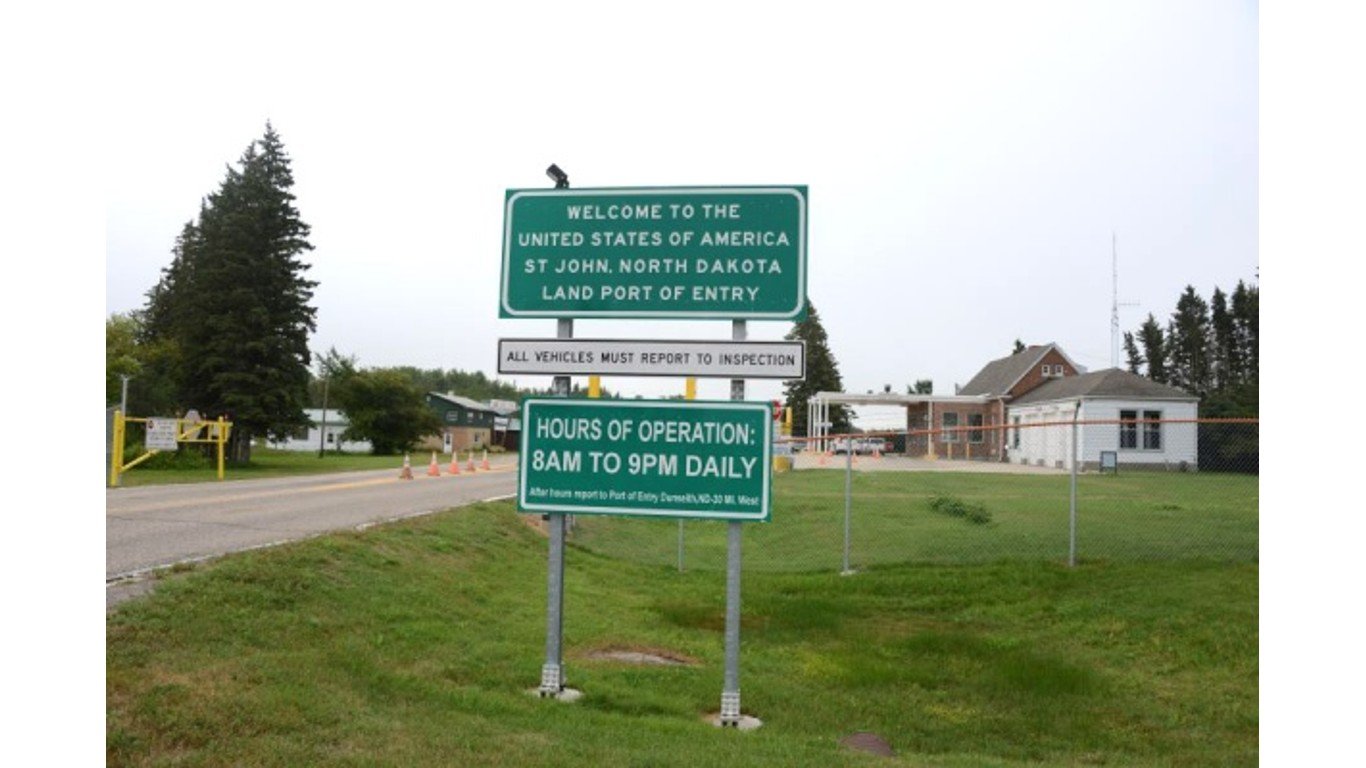
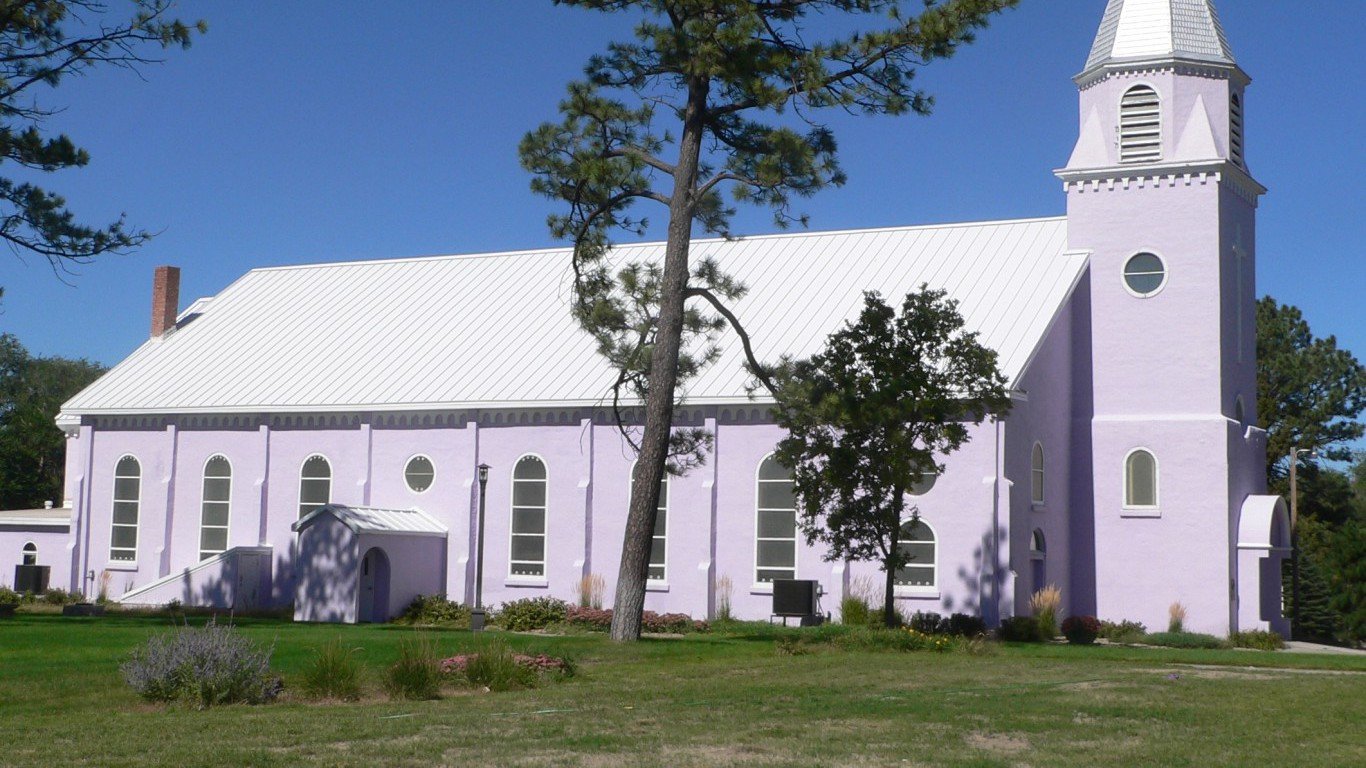
North Dakota: Rolette County
> Largest place in county: Belcourt
> 5-yr. population change: +1.2% (state: +7.3%)
> Poverty rate: 27.1% (state: 10.7%)
> Adults with a bachelor’s degree: 19.6% (state: 30.0%)
> Life expectancy at birth: 72.3 years (state: 79.7 years)
Rolette County, a largely rural area in northern North Dakota along the Canadian border, ranks as the worst county to live in the state. Local residents are nearly three times as likely to live in poverty than the typical North Dakota resident, and at just 72.3 years, life expectancy at birth in the county is nearly eight years below the state average.
A college education is linked to longer life expectancies and greater financial security. In Rolette County, only 19.6% of adults have a bachelor’s degree or higher, well below the 30.0% share of adults across North Dakota who do.
[in-text-ad-2]
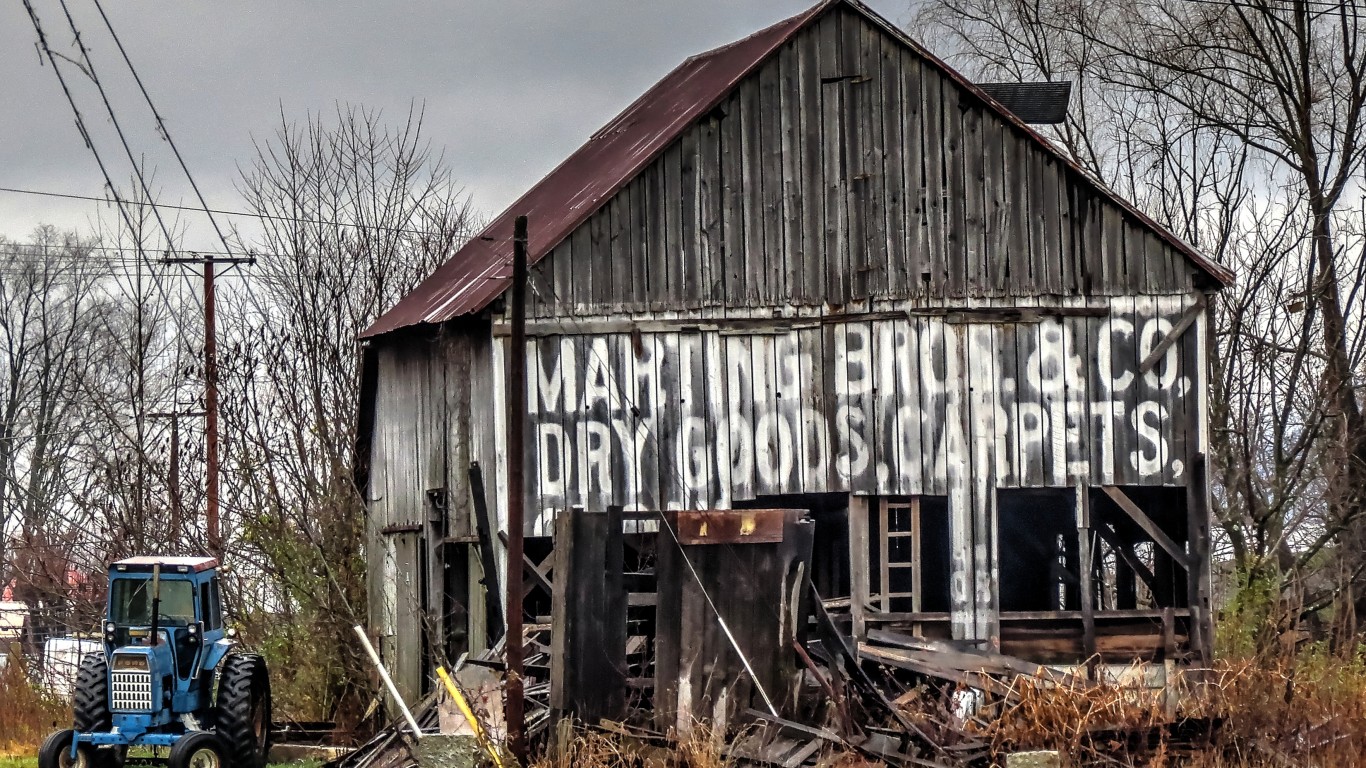
Ohio: Scioto County
> Largest place in county: Portsmouth
> 5-yr. population change: -3.2% (state: +0.8%)
> Poverty rate: 22.6% (state: 14.0%)
> Adults with a bachelor’s degree: 15.7% (state: 28.3%)
> Life expectancy at birth: 72.0 years (state: 77.0 years)
There are 88 counties in Ohio, and of them, Scioto County ranks as the worst place to live. The area, located along the state’s southern border, has the lowest life expectancy at birth of any Ohio county at just 72 years — half a decade shy of the statewide average.
Scioto County also has a poverty rate of 22.6%, which is nearly the highest of any county in Ohio and well above the 14.0% poverty rate across the state.
Oklahoma: Okfuskee County
> Largest place in county: Okemah
> 5-yr. population change: -1.6% (state: +3.0%)
> Poverty rate: 26.3% (state: 15.7%)
> Adults with a bachelor’s degree: 11.6% (state: 25.5%)
> Life expectancy at birth: 69.6 years (state: 76.0 years)
Okfuskee County, in east-central Oklahoma, ranks as the worst county to live in in the state. Major employers in the area include several manufacturing facilities and a correctional facility, but jobs appear to be low paying. The typical household in the county earns just $38,411 a year, and 26.3% of the local population live below the poverty line — compared to a median income of $52,919 and a poverty rate of 15.7% across Oklahoma.
Of the 77 counties that make up Oklahoma, Okfuskee is the only one where life expectancy at birth is below 70 years. Across the state, life expectancy at birth is 76 years.
[in-text-ad]

Oregon: Malheur County
> Largest place in county: Ontario
> 5-yr. population change: -1.1% (state: +5.9%)
> Poverty rate: 21.8% (state: 13.2%)
> Adults with a bachelor’s degree: 13.7% (state: 33.7%)
> Life expectancy at birth: 78.1 years (state: 79.9 years)
Oregon is one of the fastest growing states in the country, reporting 5.9% population growth over the last five years. Malheur County, however, located in the southeastern part of the state along the Idaho and Nevada borders, is bucking the trend, reporting a 1.1% population decline over the same period.
The worst county to live in in the state, Malheur has a poverty rate of 21.8% — well above the statewide rate of 13.2%. Health outcomes are also lagging in the county as the local life expectancy at birth is 78.1 years, nearly two years shy of the statewide average.
[recirclink id=880865]
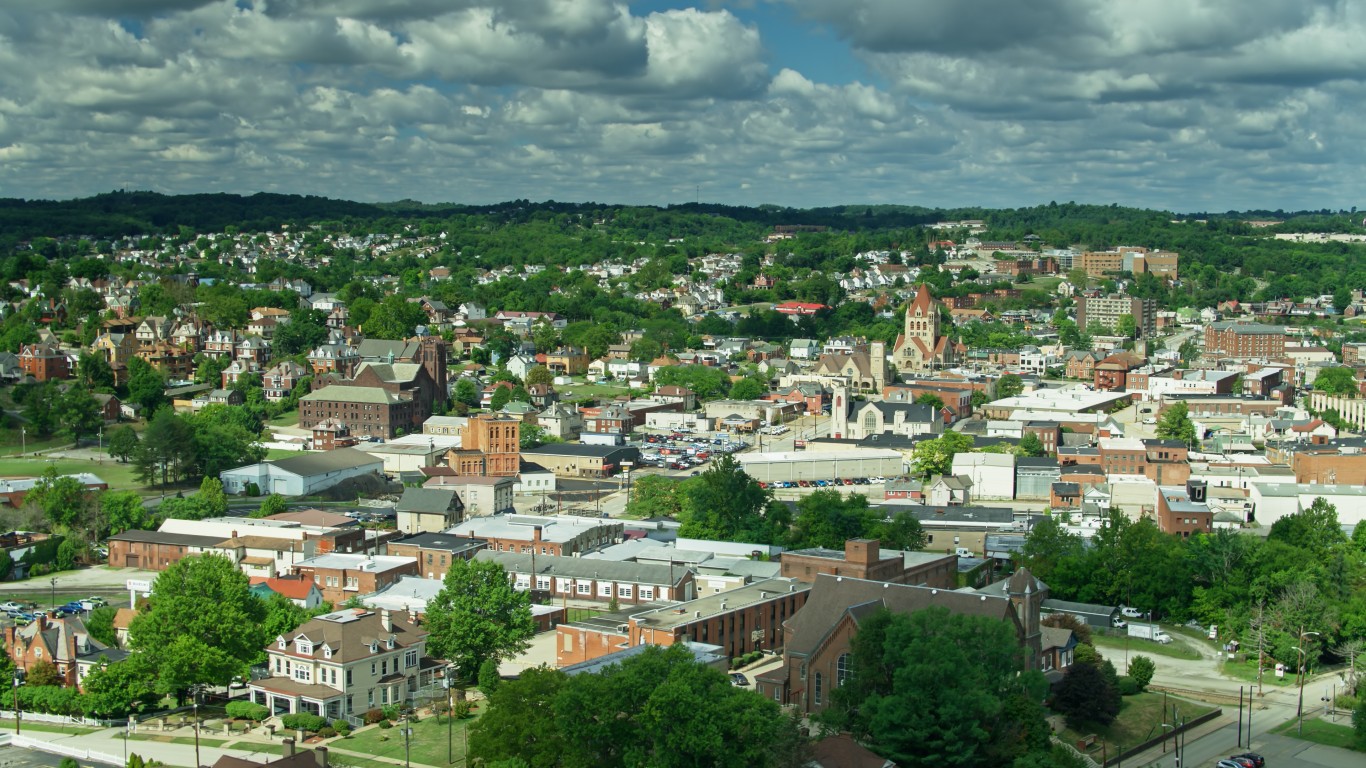
Pennsylvania: Fayette County
> Largest place in county: Uniontown
> 5-yr. population change: -3.0% (state: +0.3%)
> Poverty rate: 17.3% (state: 12.4%)
> Adults with a bachelor’s degree: 17.3% (state: 31.4%)
> Life expectancy at birth: 75.2 years (state: 78.4 years)
Fayette County, located near the southwestern corner of Pennsylvania, ranks as the worst county to live in in the state. An estimated 17.3% of the local population live below the poverty line, one of the top five highest poverty rates of all 67 counties in Pennsylvania. A lack of employment opportunities likely partially explains the widespread financial hardship as the local monthly unemployment rate stands at 7.0%, the second highest of any county in the state.
Life expectancy in the county also lags considerably behind much of the rest of the state. At birth, life expectancy in Fayette County is only 75.2 years, compared to the 78.4 year average across Pennsylvania.

Rhode Island: Providence County
> Largest place in county: Providence
> 5-yr. population change: +1.0% (state: +0.4%)
> Poverty rate: 15.2% (state: 12.4%)
> Adults with a bachelor’s degree: 29.0% (state: 34.2%)
> Life expectancy at birth: 79.4 years (state: 79.8 years)
A geographically small state, Rhode Island has only five counties. As a result, even though Providence County ranks as the worst county to live in the state, the disparity between the county and the state as a whole in several key socioeconomic indicators is not especially pronounced. The county poverty rate of 15.2% is not much higher than the 12.4% state rate. Similarly, at 79.4 years, life expectancy at birth in the county is nearly on par with the 79.8 year average across the state.
However, adults living in Providence County are considerably less likely to have a four-year college degree than the typical adult in Rhode Island. Only 29.0% of the 25 and older population in the county have a bachelor’s degree compared to 34.2% of Rhode Island’s 25 and older population.
[in-text-ad-2]
South Carolina: Dillon County
> Largest place in county: Dillon
> 5-yr. population change: -2.7% (state: +6.2%)
> Poverty rate: 32.6% (state: 15.2%)
> Adults with a bachelor’s degree: 11.1% (state: 28.1%)
> Life expectancy at birth: 72.9 years (state: 77.1 years)
South Carolina is one of the fastest growing states in the country, reporting 6.2% population growth over the last five years. Dillon County, however, located in the northeastern part of the state along the North Carolina border, is bucking the trend, reporting a 2.7% population decline over the same period.
The worst county to live in in the state, Dillon has a poverty rate of 32.6% — more than double the statewide rate of 15.2%. Health outcomes are also lagging in Dillon County as the local life expectancy at birth is 72.9 years, more than four years shy of the statewide average.
South Dakota: Todd County
> Largest place in county: Rosebud
> 5-yr. population change: +3.4% (state: +4.3%)
> Poverty rate: 55.5% (state: 13.1%)
> Adults with a bachelor’s degree: 15.6% (state: 28.8%)
> Life expectancy at birth: 67.4 years (state: 78.9 years)
Todd County, located in southern South Dakota, encompassing parts of the Rosebud Indian Reservation, ranks as the worst place to live in the state. Due to a number of historical and contemporary factors, many Indian reservations are among the poorest communities in the United States — and Todd County is no exception. An estimated 55.5% of the population live below the poverty line, more than four times the 13.1% share of South Dakota residents.
Life expectancy in the county also lags considerably behind much of the rest of the state. At birth, life expectancy in Todd County is only 67.4 years, compared to the 78.9 year average across South Dakota.
[in-text-ad]
Tennessee: Cocke County
> Largest place in county: Newport
> 5-yr. population change: +0.3% (state: +4.0%)
> Poverty rate: 23.5% (state: 15.2%)
> Adults with a bachelor’s degree: 11.6% (state: 27.3%)
> Life expectancy at birth: 71.5 years (state: 76.0 years)
Cocke County is located in eastern Tennessee along the North Carolina border. Though it is located in the Smoky Mountains, offering plenty of outdoor recreation opportunities and picturesque landscapes, it lags behind much of the rest of the state in several key socioeconomic measures.
For example, life expectancy at birth in Cocke County is only 71.5 years, well below the 76.0 year state average. Additionally, the local poverty rate of 23.5% is considerably higher than the 15.2% poverty rate across Tennessee.
[recirclink id=880688]
Texas: Zavala County
> Largest place in county: Crystal City
> 5-yr. population change: +0.2% (state: +8.3%)
> Poverty rate: 33.8% (state: 14.7%)
> Adults with a bachelor’s degree: 10.9% (state: 29.9%)
> Life expectancy at birth: 76.0 years (state: 79.2 years)
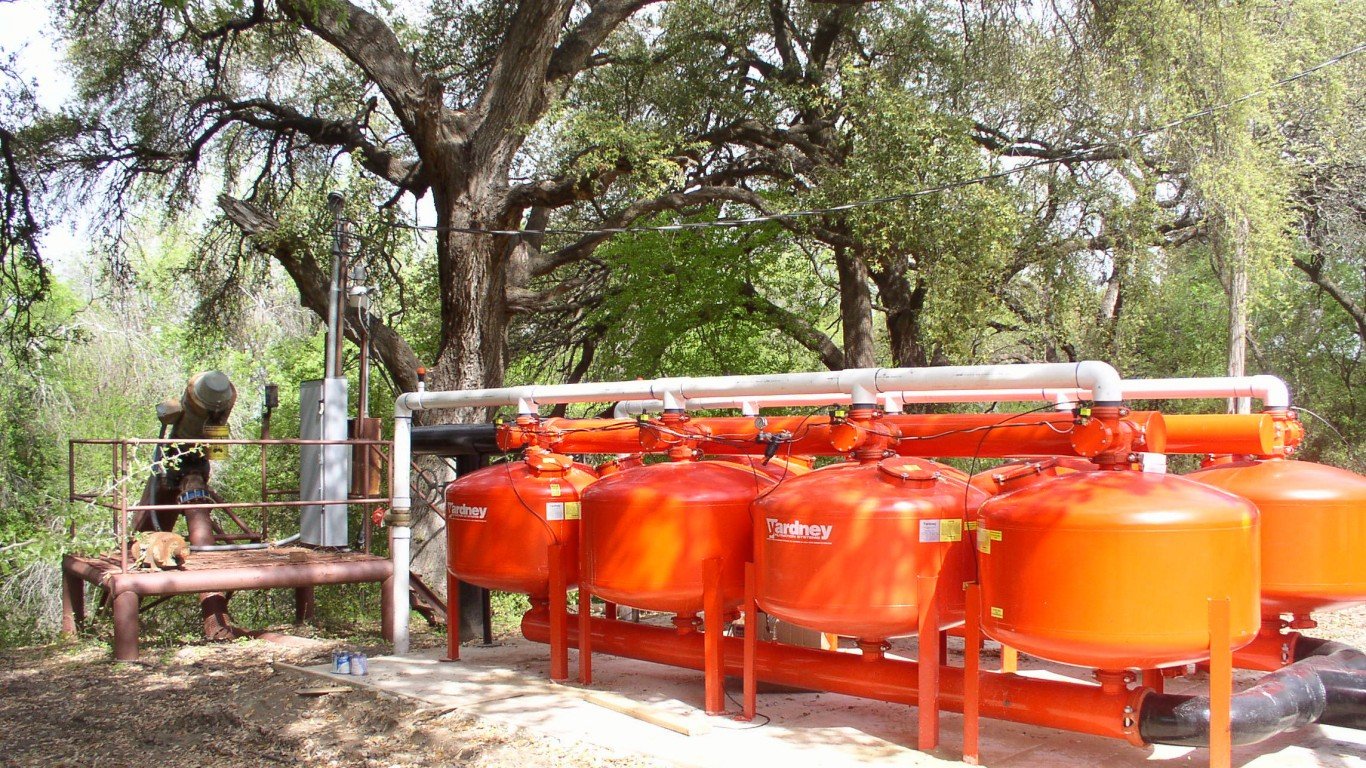
Of the 254 counties that make up Texas, Zavala County ranks as the worst place to live. Quality of life in the area, located southwest of San Antonio, is undermined by widespread financial insecurity. An estimated 33.8% of the local population live below the poverty line, more than double the 14.7% poverty rate across Texas. Additionally, at just 76 years, life expectancy at birth in the county is over three years below that statewide average.
A college education is linked to longer life expectancies and greater financial security. In Zavala County, only 10.9% of adults have a bachelor’s degree or higher, well below the 29.9% share of adults across Texas who do.
Utah: San Juan County
> Largest place in county: Blanding
> 5-yr. population change: +2.4% (state: +8.4%)
> Poverty rate: 25.0% (state: 9.8%)
> Adults with a bachelor’s degree: 18.3% (state: 34.0%)
> Life expectancy at birth: 76.4 years (state: 80.1 years)
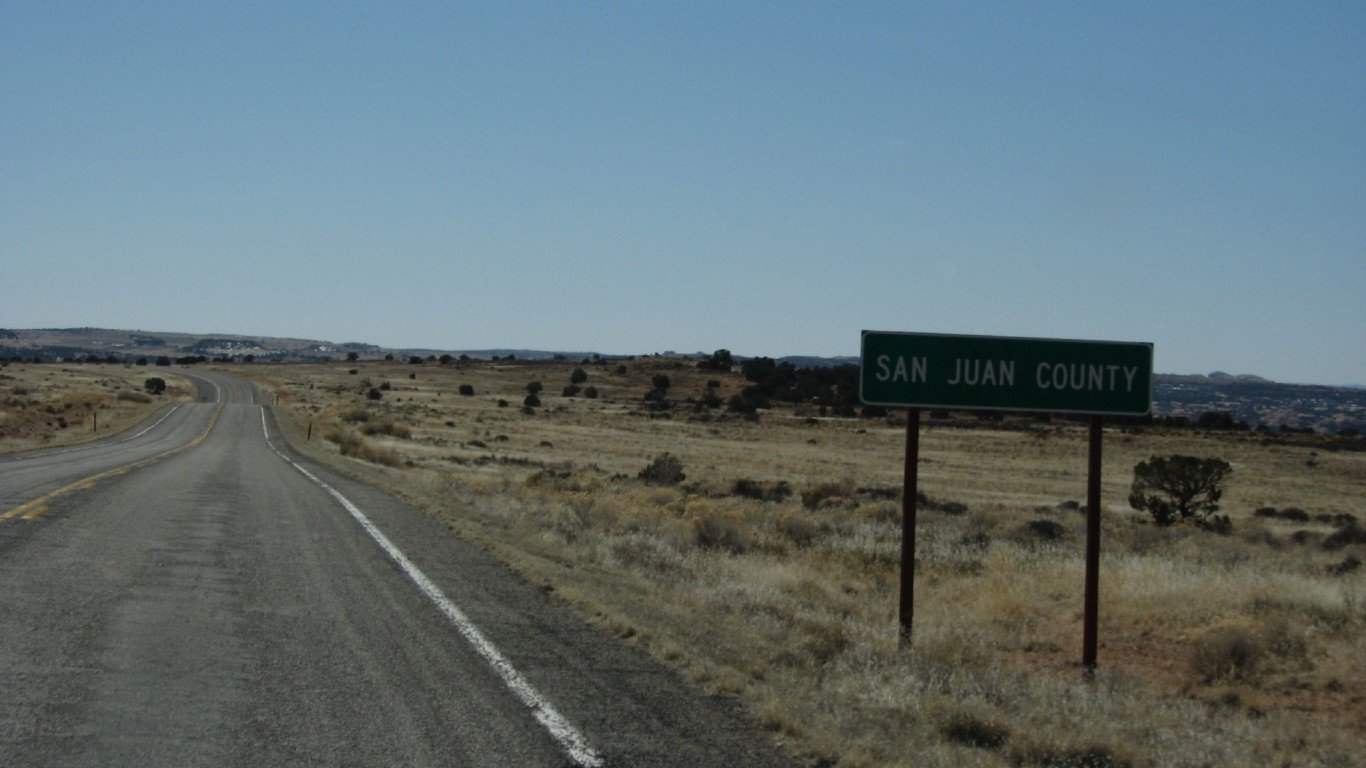
There are 29 counties in Utah, and of them, San Juan County, located in the southeastern corner of the state, ranks as the worst place to live. The 25% local poverty rate is the highest of any county in the state and more than double the 9.8% poverty rate across Utah.
Americans with college educations are generally less exposed to economic slowdown than those with lower educational attainment, and in San Juan County, only 18.3% of the adult population have a bachelor’s degree, compared to 34.0% of Utah residents over age 24. Indeed, San Juan County’s monthly jobless rate of 5.3% is nearly double the comparable 2.7% rate across Utah.
[in-text-ad-2]

Vermont: Orleans County
> Largest place in county: Newport
> 5-yr. population change: -1.0% (state: -0.3%)
> Poverty rate: 13.1% (state: 10.9%)
> Adults with a bachelor’s degree: 21.5% (state: 38.0%)
> Life expectancy at birth: 78.5 years (state: 79.8 years)
A geographically small state, Vermont has only 14 counties. As a result, even though Orleans County ranks as the worst county to live in the state, the disparity between the county and the state as a whole in several key socioeconomic indicators is not especially pronounced. The county’s poverty rate of 13.1% is only slightly higher than the 10.9% state rate. Similarly, at 78.5 years, life expectancy at birth in the county is within 1.5 years of the 79.8 year average across the state.
However, adults living in Orleans County are considerably less likely to have a four-year college degree than the typical adult in Vermont. Only 21.5% of the 25 and older population in the county have a bachelor’s degree compared to 38.0% of Vermont’s 25 and older population.
Virginia: Buchanan County
> Largest place in county: Grundy
> 5-yr. population change: -8.0% (state: +3.3%)
> Poverty rate: 28.4% (state: 10.6%)
> Adults with a bachelor’s degree: 11.8% (state: 38.8%)
> Life expectancy at birth: 74.0 years (state: 79.5 years)
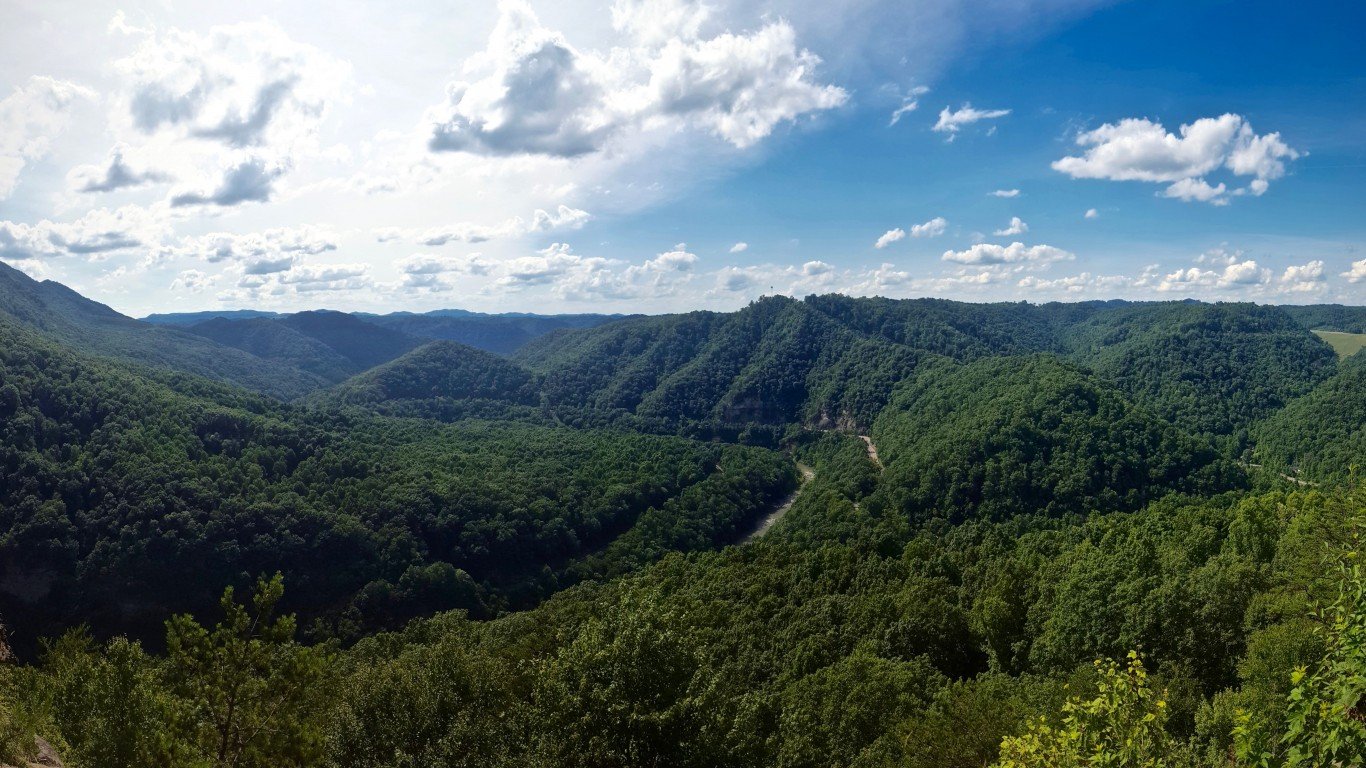
There are 133 counties and independent cities in Virginia, and of them, Buchanan County, located in the western part of the state along the West Virginia and Kentucky borders, ranks as the worst place to live. County residents are nearly three times as likely to live below the poverty line as the typical Virginia resident, and life expectancy at birth in the county is 74 years — over half a decade less than the average across the state.
Like many U.S. counties lagging in key socioeconomic indicators, Buchanan County’s population is shrinking. Over the last five years, the number of people living there fell by 8.0%, even as Virginia’s population expanded by 3.3%.
[in-text-ad]
Washington: Adams County
> Largest place in county: Othello
> 5-yr. population change: +3.4% (state: +7.3%)
> Poverty rate: 25.6% (state: 10.8%)
> Adults with a bachelor’s degree: 14.3% (state: 36.0%)
> Life expectancy at birth: 80.2 years (state: 80.4 years)
Adams County ranks as the worst county to live in in Washington state. It is the only one of the state’s 39 counties where fewer than 15% of adults have a bachelor’s degree or higher. The local bachelor’s degree attainment rate of 14.3% is less than half the comparable attainment rate of 36.0% statewide.
A college education is linked to greater financial security. In Adams County, about one in every four residents live below the poverty line, compared to only about one in every 10 Washington residents.
[recirclink id=824405]

West Virginia: McDowell County
> Largest place in county: Welch
> 5-yr. population change: -12.3% (state: -2.0%)
> Poverty rate: 33.2% (state: 17.6%)
> Adults with a bachelor’s degree: 5.4% (state: 20.6%)
> Life expectancy at birth: 69.0 years (state: 74.8 years)
McDowell County, West Virginia, was the largest coal-producing county in the United States for many years in the early to mid 20th century. Like many coal-producing regions, it has suffered from long-term economic decline — and now, it ranks as the worst of West Virginia’s 55 counties to live in.
The local poverty rate of 33.2% is well above the 17.6% state poverty rate. Wide disparities also exist in health outcomes. Life expectancy at birth in McDowell County is only 69 years, nearly six years below life expectancy in West Virginia.

Wisconsin: Juneau County
> Largest place in county: Mauston
> 5-yr. population change: -0.5% (state: +1.2%)
> Poverty rate: 15.1% (state: 11.3%)
> Adults with a bachelor’s degree: 13.7% (state: 30.1%)
> Life expectancy at birth: 78.2 years (state: 79.5 years)
Wisconsin’s Juneau County ranks as the worst of the 72 counties in the state to live in. A college education is linked to longer life expectancies, greater financial security, and a stronger sense of control over one’s life. In Juneau County, only 13.7% of adults have a bachelor’s degree or higher, less than half the 30.1% share of adults across Wisconsin who do.
The county’s bachelor’s degree attainment rate is the lowest in the state and may partially explain why the local poverty rate is higher than the state rate and why life expectancy at birth in the area is below the average across Wisconsin.
[in-text-ad-2]

Wyoming: Big Horn County
> Largest place in county: Lovell
> 5-yr. population change: +0.5% (state: +1.0%)
> Poverty rate: 12.7% (state: 11.0%)
> Adults with a bachelor’s degree: 19.0% (state: 27.4%)
> Life expectancy at birth: 76.1 years (state: 78.9 years)
Big Horn County, Wyoming, is located in the north-central part of the state along the Montana state border. The most consequential industries in the area include gas and oil extraction, mining, farming, and ranching — but jobs in these sectors do not appear to be providing for local residents in the same way jobs in much of the rest of the state are. The typical area household earns only $52,804 a year, well below the median household income across the state of $64,049. Additionally, local residents are slightly more likely to live below the poverty line than the typical Wyoming resident.
Life expectancy in the county also lags considerably behind much of the rest of the state. At birth, life expectancy in Big Horn County is 76.1 years, compared to the 78.9 year average across Wyoming.
Methodology
To determine the worst U.S. counties to live in, 24/7 Wall St. constructed an index of three measures: poverty, bachelor’s degree attainment among adults, and average life expectancy at birth. Our list also includes independent cities that do not fall within the boundaries of a county or county equivalent. Only counties and county equivalents with populations of 10,000 or more were considered.
Data on the share of individuals living below the poverty line as well as the share of adults 25 and older with at least a bachelor’s degree came from the 2019 U.S. Census Bureau’s American Community Survey and are five-year estimates.
Data on average life expectancy at birth came from the 2021 County Health Rankings, a joint program of the Robert Wood Johnson Foundation and University of Wisconsin Population Health Institute, and are based on mortality data from the years 2017 to 2019.
Supplemental data on population, income, and median home value are five-year estimates from the ACS. Data on unemployment in May 2021 came from the Bureau of Labor Statistics and are seasonally adjusted.
Contact [email protected] for any questions or corrections.