City life has its advantages, from more choices in dining and entertainment to more job opportunities, better public transportation, and more low-cost or free shared public experiences. But urban living also has its disadvantages – not just a higher cost of living, but also such problems as crumbling infrastructure, pest infestation, trash-ridden streets, and air and water pollution. (These are the most miserable cities in America according to residents.)
To identify America’s dirtiest cities, 24/7 Tempo reviewed a ranking created by LawnStarter, a lawn care start-up that conducts research into city and state amenities on a regular basis. The site ranked cities across four key categories: pollution, living conditions, infrastructure, and consumer (i.e., resident) satisfaction. (These are the best cities in the US to live.)
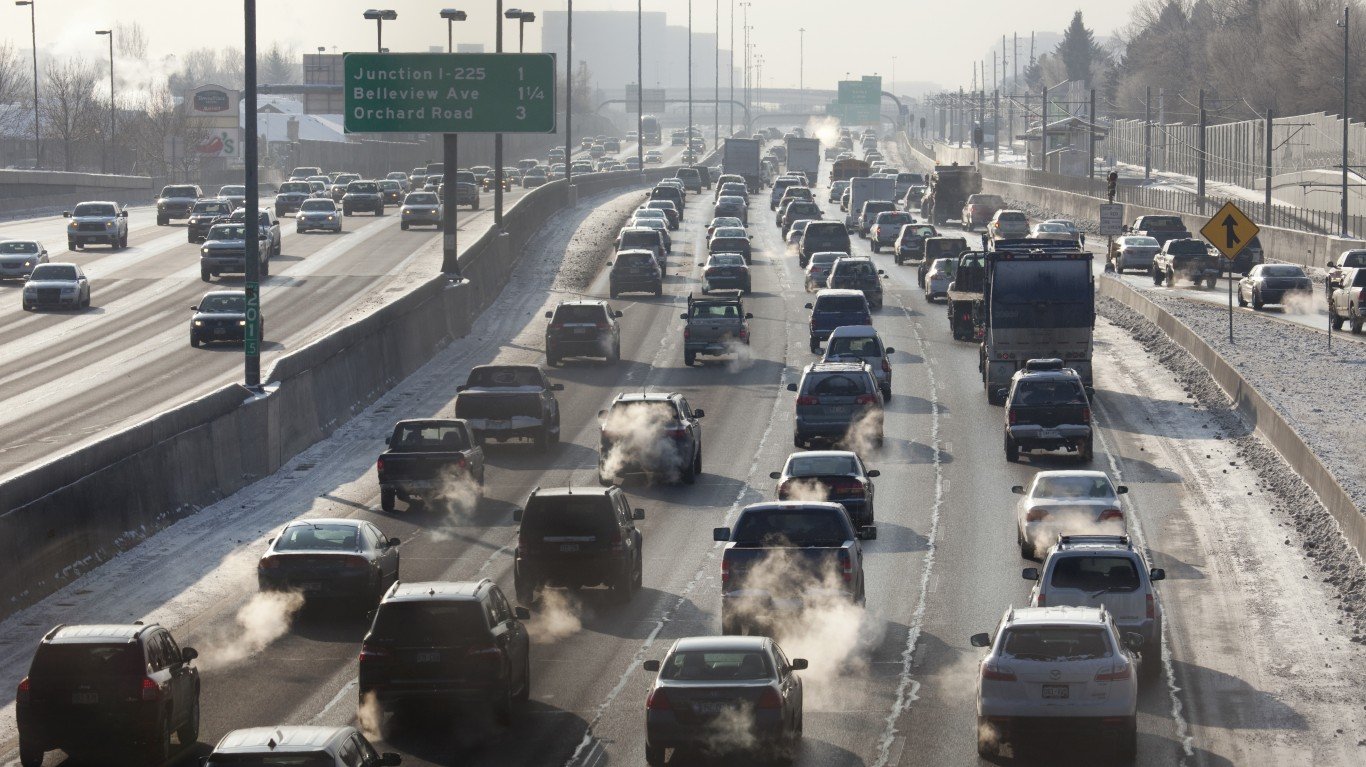
The study uncovered some surprising results. Six cities tied for having the worst air quality – all of them in Arizona, hardly the most industrial state in the nation. The worst city for greenhouse-gas emissions was mile-high Denver.
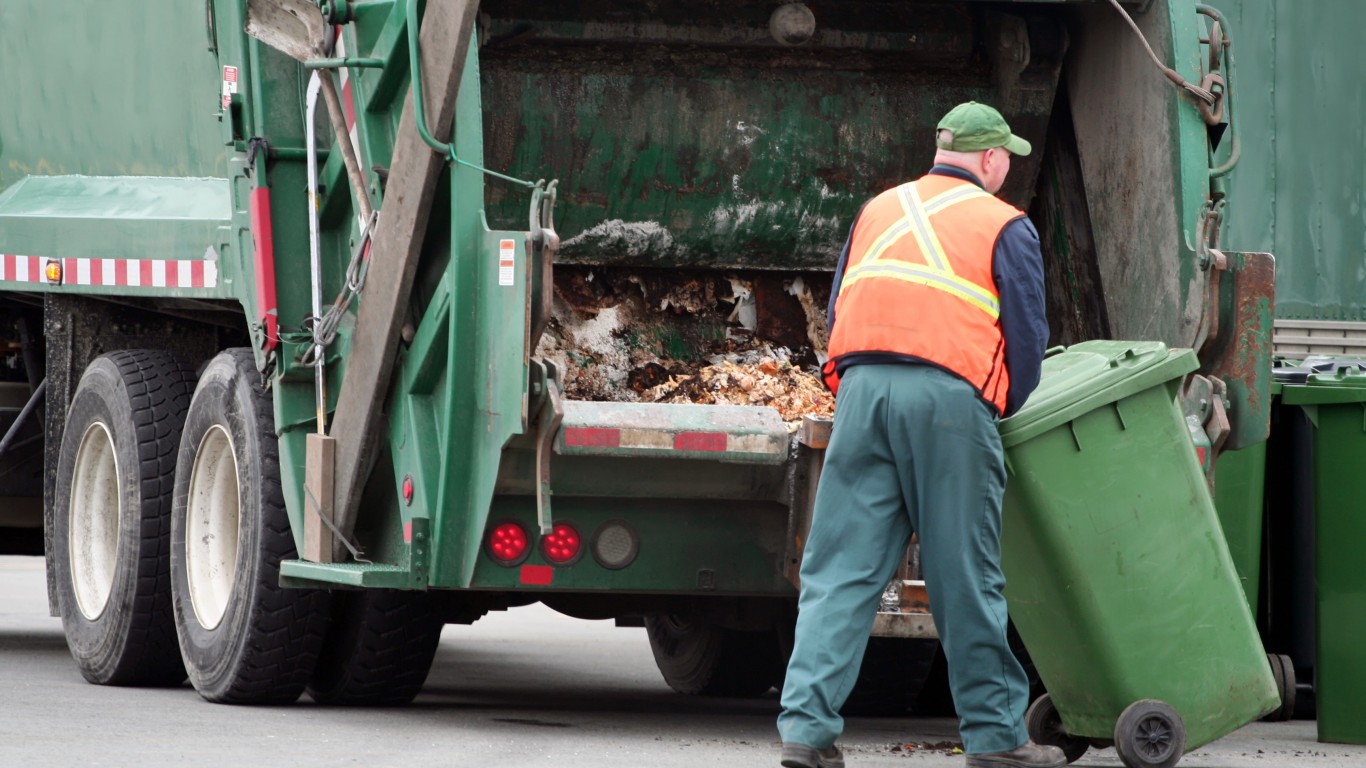
Perhaps less surprising is the fact that Newark, New Jersey, had the highest share of residents dissatisfied with garbage disposal, with Jersey City, Detroit, and New York City following close behind. However, the second highest share belonged to Newport News, Virginia – while nearby Norfolk had the lowest share. (Neither Virginia city, in any case, scored low enough overall to be included in this list.)
Click here to see America’s dirtiest cities in 2022
Click here to read our detailed methodology

50. Portland, OR
> Overall score: 32.8
> Pollution rank: 50
> Living conditions rank: 36
> Infrastructure rank: 69
> Consumer satisfaction rank: 52
[in-text-ad]

49. Sunnyvale, CA
> Overall score: 33.16
> Pollution rank: 46
> Living conditions rank: 20
> Infrastructure rank: 86
> Consumer satisfaction rank: 74
[recirclink id=1022400]

48. Atlanta
> Overall score: 33.2
> Pollution rank: 43
> Living conditions rank: 67
> Infrastructure rank: 56
> Consumer satisfaction rank: 26

47. Minneapolis
> Overall score: 33.33
> Pollution rank: 41
> Living conditions rank: 25
> Infrastructure rank: 82
> Consumer satisfaction rank: 79
[in-text-ad-2]

46. Akron, OH
> Overall score: 33.54
> Pollution rank: 82
> Living conditions rank: 38
> Infrastructure rank: 19
> Consumer satisfaction rank: 17
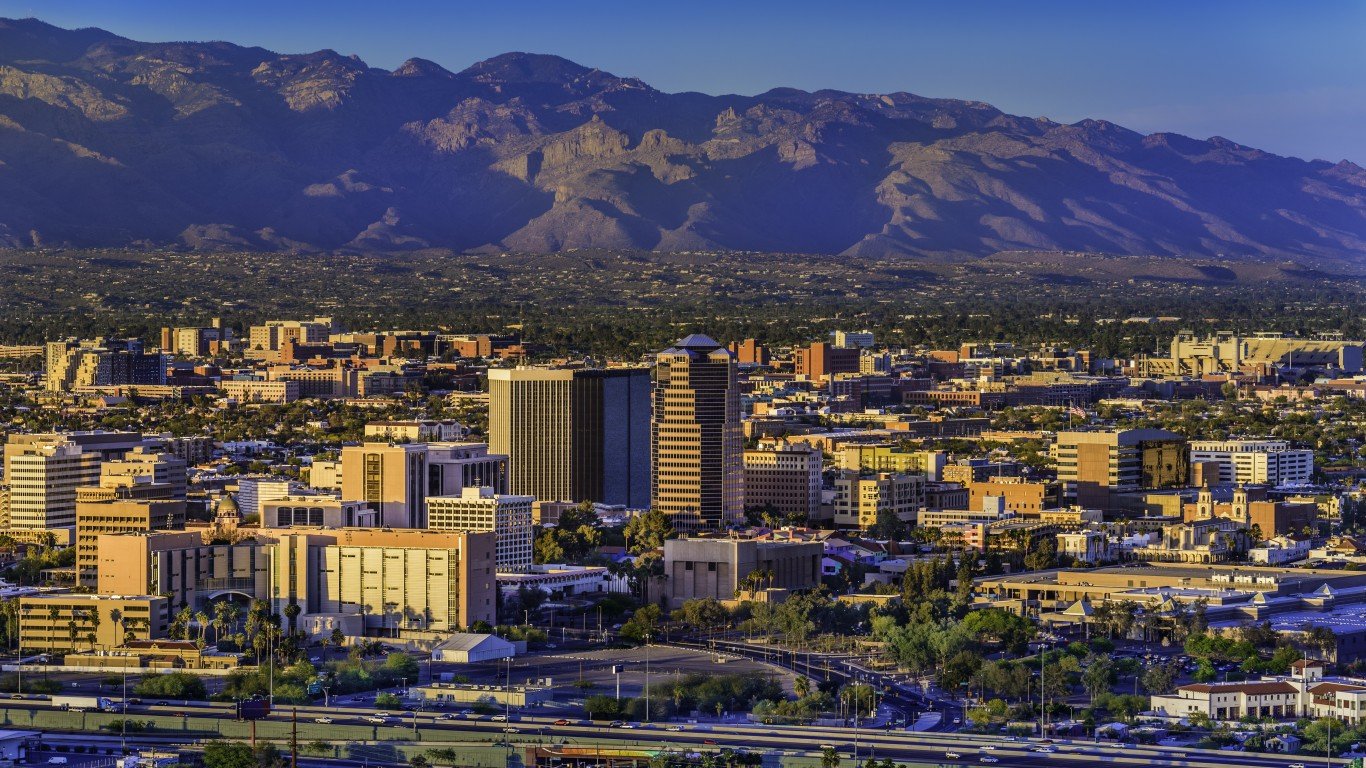
45. Tucson
> Overall score: 34.28
> Pollution rank: 37
> Living conditions rank: 72
> Infrastructure rank: 4
> Consumer satisfaction rank: 62
[in-text-ad]

44. Milwaukee
> Overall score: 34.55
> Pollution rank: 38
> Living conditions rank: 39
> Infrastructure rank: 32
> Consumer satisfaction rank: 69
[recirclink id=988795]
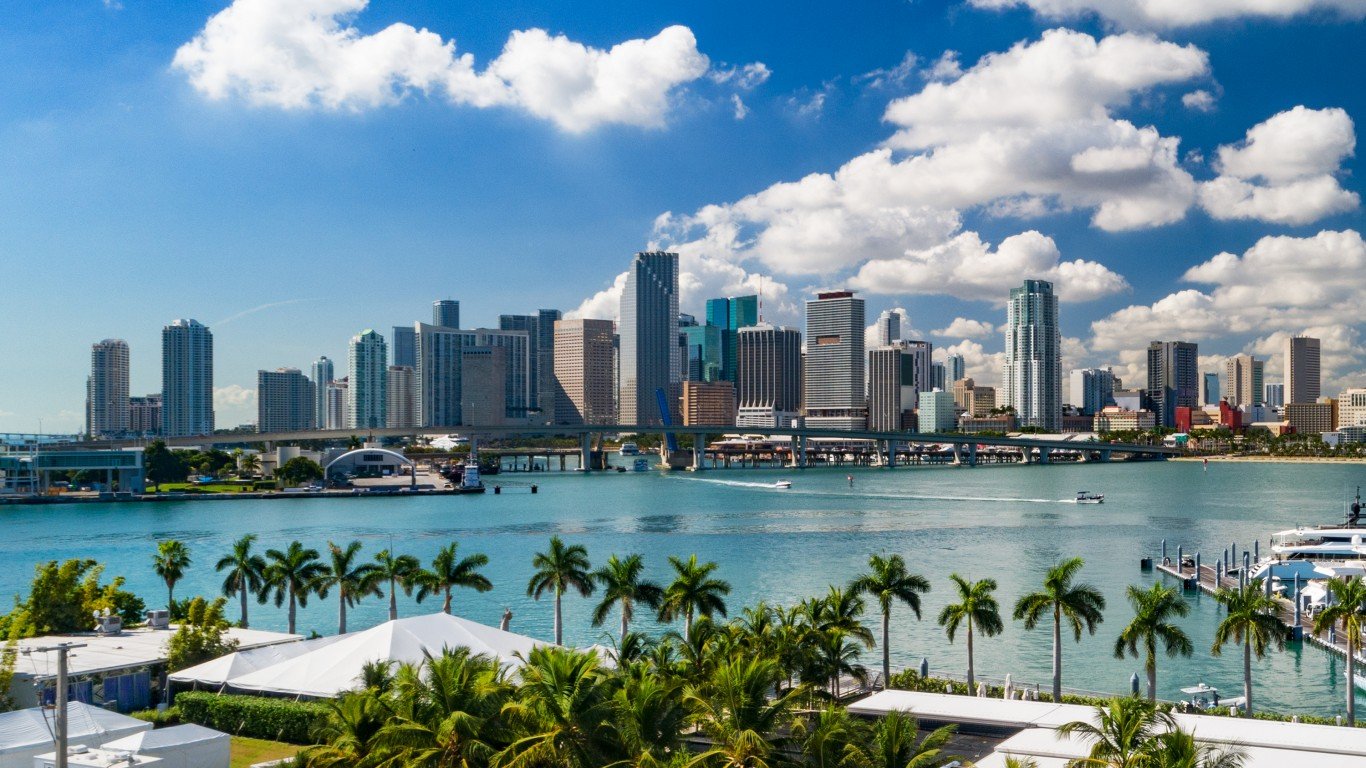
43. Miami
> Overall score: 34.9
> Pollution rank: 69
> Living conditions rank: 16
> Infrastructure rank: 29
> Consumer satisfaction rank: 31

42. Irvine, CA
> Overall score: 34.99
> Pollution rank: 16
> Living conditions rank: 59
> Infrastructure rank: 16
> Consumer satisfaction rank: 72
[in-text-ad-2]

41. Henderson, NV
> Overall score: 35.29
> Pollution rank: 32
> Living conditions rank: 45
> Infrastructure rank: 33
> Consumer satisfaction rank: 46

40. Plano, TX
> Overall score: 35.36
> Pollution rank: 31
> Living conditions rank: 34
> Infrastructure rank: 80
> Consumer satisfaction rank: 42
[in-text-ad]
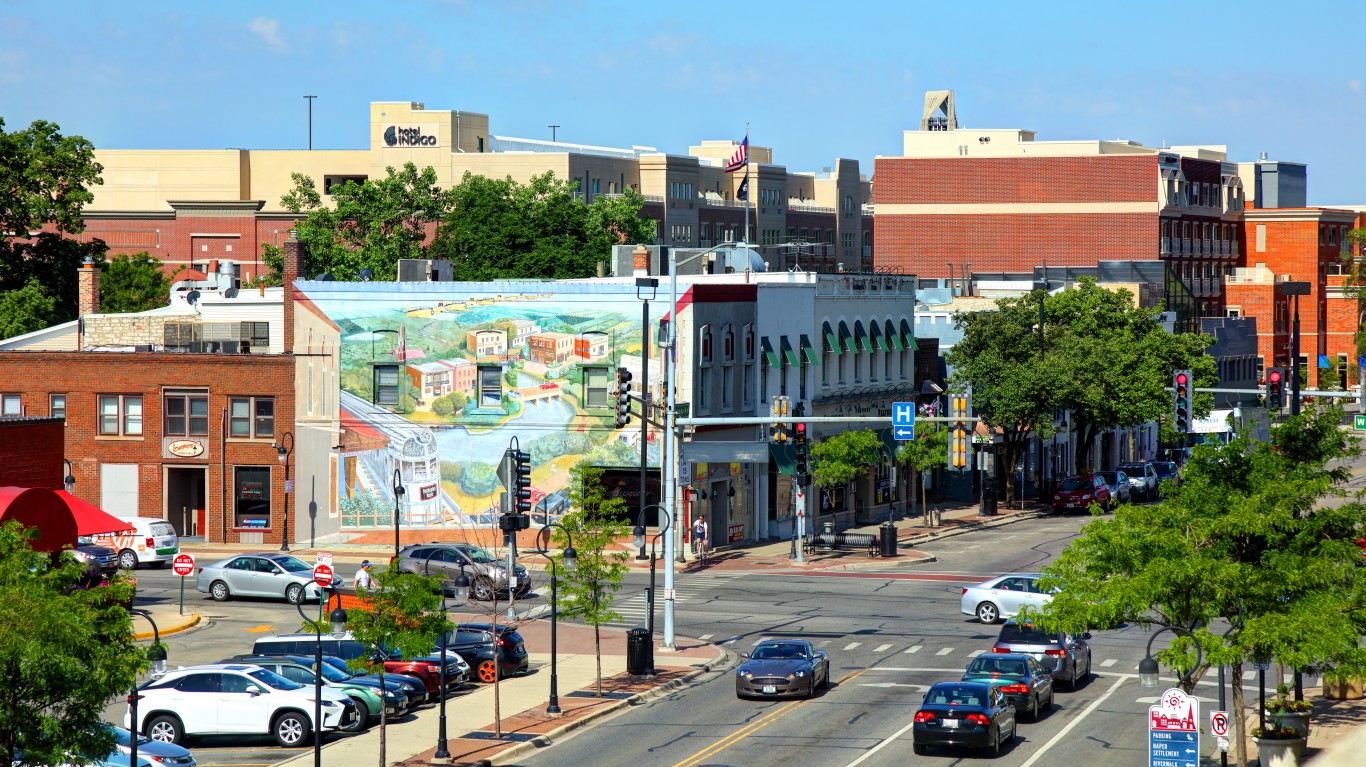
39. Naperville, IL
> Overall score: 35.62
> Pollution rank: 25
> Living conditions rank: 24
> Infrastructure rank: 41
> Consumer satisfaction rank: 83
[recirclink id=914085]

38. Tampa, FL
> Overall score: 35.91
> Pollution rank: 42
> Living conditions rank: 32
> Infrastructure rank: 35
> Consumer satisfaction rank: 68
37. Chandler, AZ
> Overall score: 36.42
> Pollution rank: 5
> Living conditions rank: 55
> Infrastructure rank: 17
> Consumer satisfaction rank: 82
[in-text-ad-2]

36. Fort Worth, TX
> Overall score: 37.35
> Pollution rank: 28
> Living conditions rank: 51
> Infrastructure rank: 63
> Consumer satisfaction rank: 15

35. New Orleans
> Overall score: 37.35
> Pollution rank: 77
> Living conditions rank: 18
> Infrastructure rank: 21
> Consumer satisfaction rank: 12
[in-text-ad]

34. Orlando, FL
> Overall score: 37.39
> Pollution rank: 17
> Living conditions rank: 64
> Infrastructure rank: 10
> Consumer satisfaction rank: 54
[recirclink id=909976]

33. San Francisco
> Overall score: 37.48
> Pollution rank: 62
> Living conditions rank: 13
> Infrastructure rank: 53
> Consumer satisfaction rank: 9

32. Riverside, CA
> Overall score: 37.95
> Pollution rank: 11
> Living conditions rank: 46
> Infrastructure rank: 68
> Consumer satisfaction rank: 25
[in-text-ad-2]

31. Philadelphia
> Overall score: 37.97
> Pollution rank: 68
> Living conditions rank: 12
> Infrastructure rank: 51
> Consumer satisfaction rank: 8
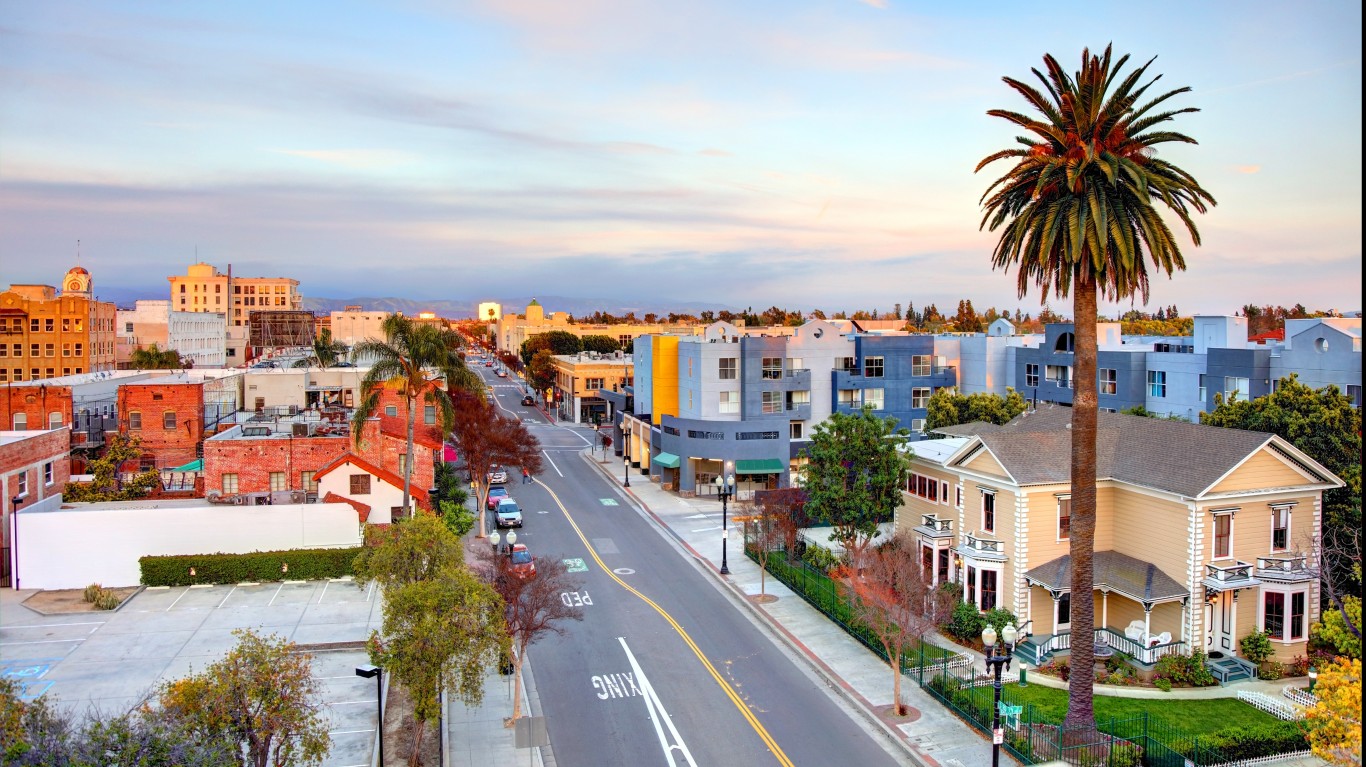
30. Santa Ana, CA
> Overall score: 39.08
> Pollution rank: 24
> Living conditions rank: 43
> Infrastructure rank: 61
> Consumer satisfaction rank: 13
[in-text-ad]

29. Aurora, IL
> Overall score: 39.25
> Pollution rank: 22
> Living conditions rank: 17
> Infrastructure rank: 83
> Consumer satisfaction rank: 38
[recirclink id=862168]
28. Kansas City, KS
> Overall score: 39.35
> Pollution rank: 56
> Living conditions rank: 11
> Infrastructure rank: 8
> Consumer satisfaction rank: 40

27. Jersey City, NJ
> Overall score: 39.45
> Pollution rank: 55
> Living conditions rank: 10
> Infrastructure rank: 50
> Consumer satisfaction rank: 7
[in-text-ad-2]

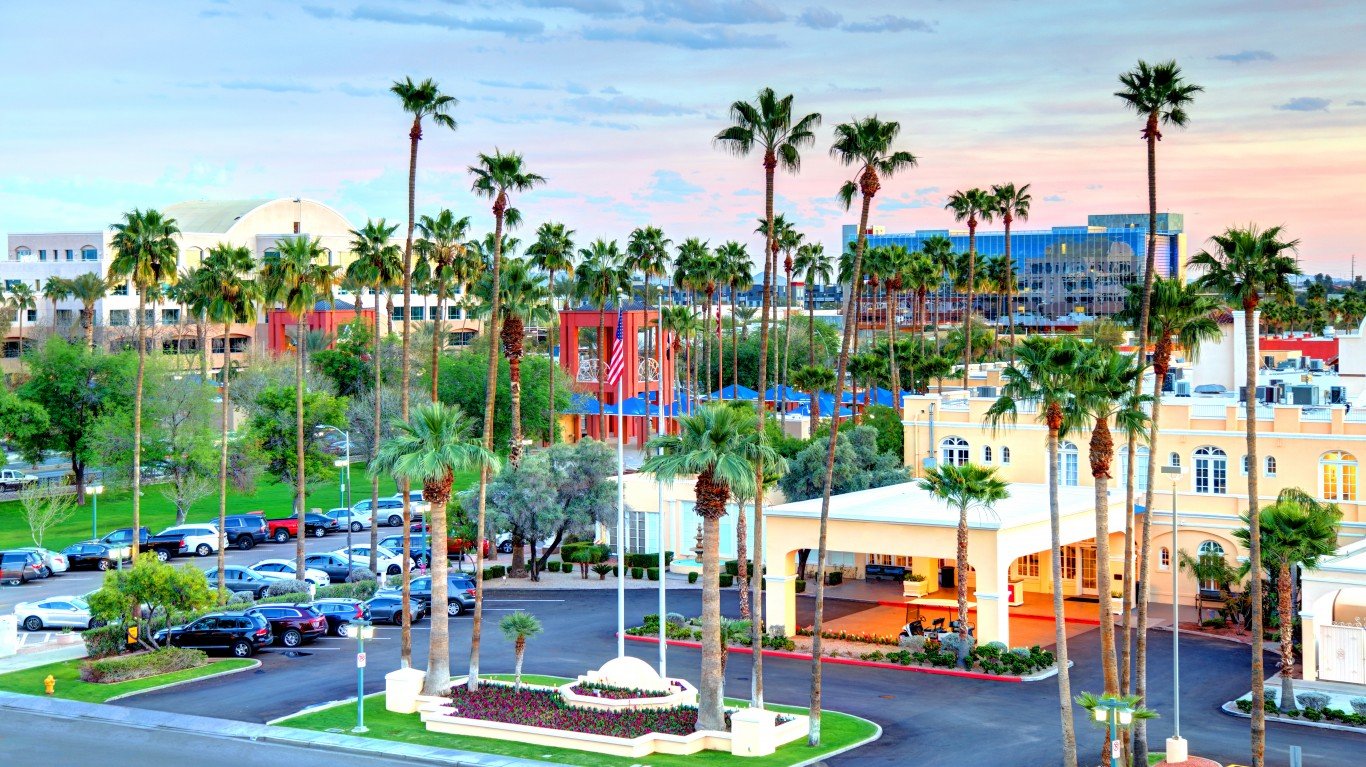
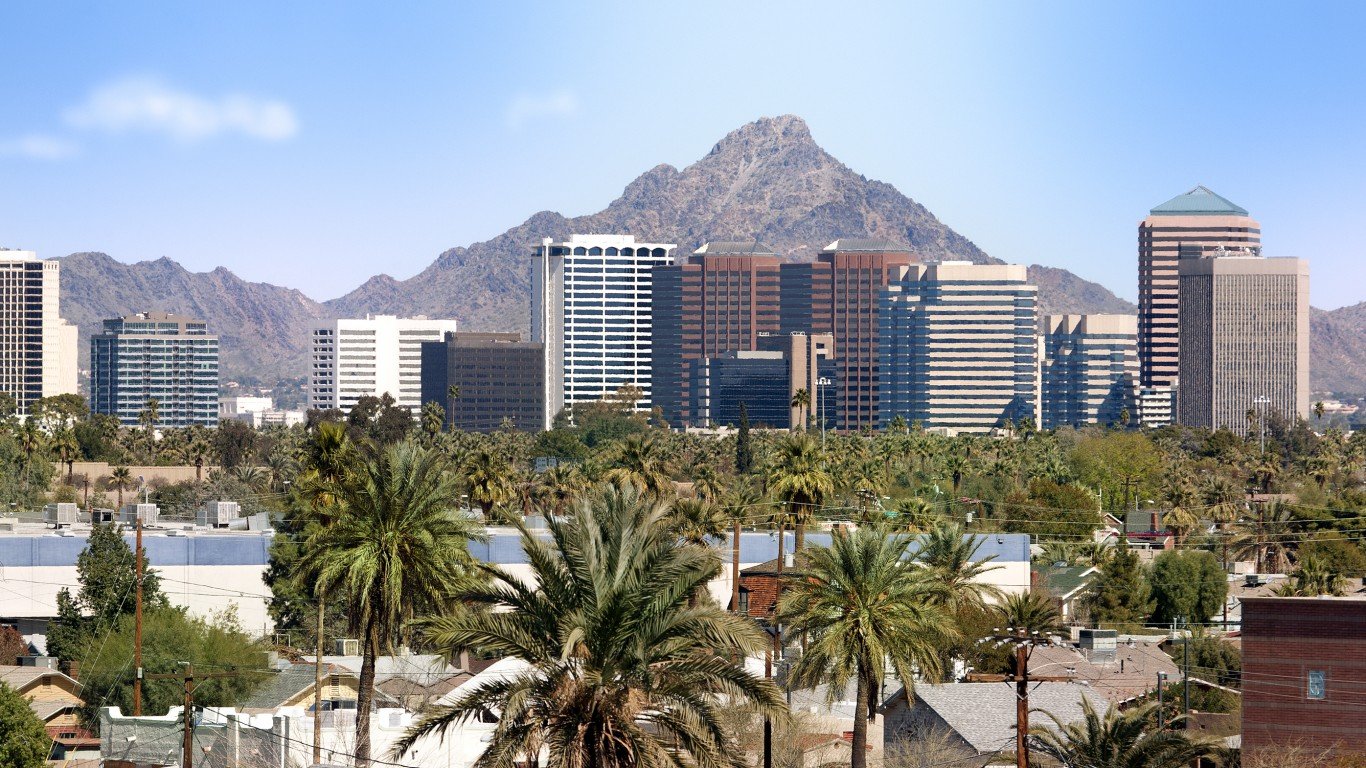
26. Tempe, AZ
> Overall score: 39.58
> Pollution rank: 3
> Living conditions rank: 50
> Infrastructure rank: 27
> Consumer satisfaction rank: 63
25. Peoria, AZ
> Overall score: 39.81
> Pollution rank: 1
> Living conditions rank: 60
> Infrastructure rank: 22
> Consumer satisfaction rank: 66
[in-text-ad]

24. Dallas
> Overall score: 39.96
> Pollution rank: 12
> Living conditions rank: 37
> Infrastructure rank: 47
> Consumer satisfaction rank: 33
[recirclink id=1022400]
23. Pasadena, CA
> Overall score: 40.07
> Pollution rank: 18
> Living conditions rank: 15
> Infrastructure rank: 76
> Consumer satisfaction rank: 37
22. Denver
> Overall score: 40.73
> Pollution rank: 4
> Living conditions rank: 44
> Infrastructure rank: 37
> Consumer satisfaction rank: 44
[in-text-ad-2]

21. San Jose, CA
> Overall score: 40.99
> Pollution rank: 45
> Living conditions rank: 26
> Infrastructure rank: 55
> Consumer satisfaction rank: 18

20. Detroit
> Overall score: 41.28
> Pollution rank: 67
> Living conditions rank: 23
> Infrastructure rank: 48
> Consumer satisfaction rank: 3
[in-text-ad]

19. Long Beach, CA
> Overall score: 41.47
> Pollution rank: 14
> Living conditions rank: 9
> Infrastructure rank: 75
> Consumer satisfaction rank: 43
[recirclink id=988795]

18. Washington, D.C.
> Overall score: 41.54
> Pollution rank: 44
> Living conditions rank: 6
> Infrastructure rank: 30
> Consumer satisfaction rank: 49
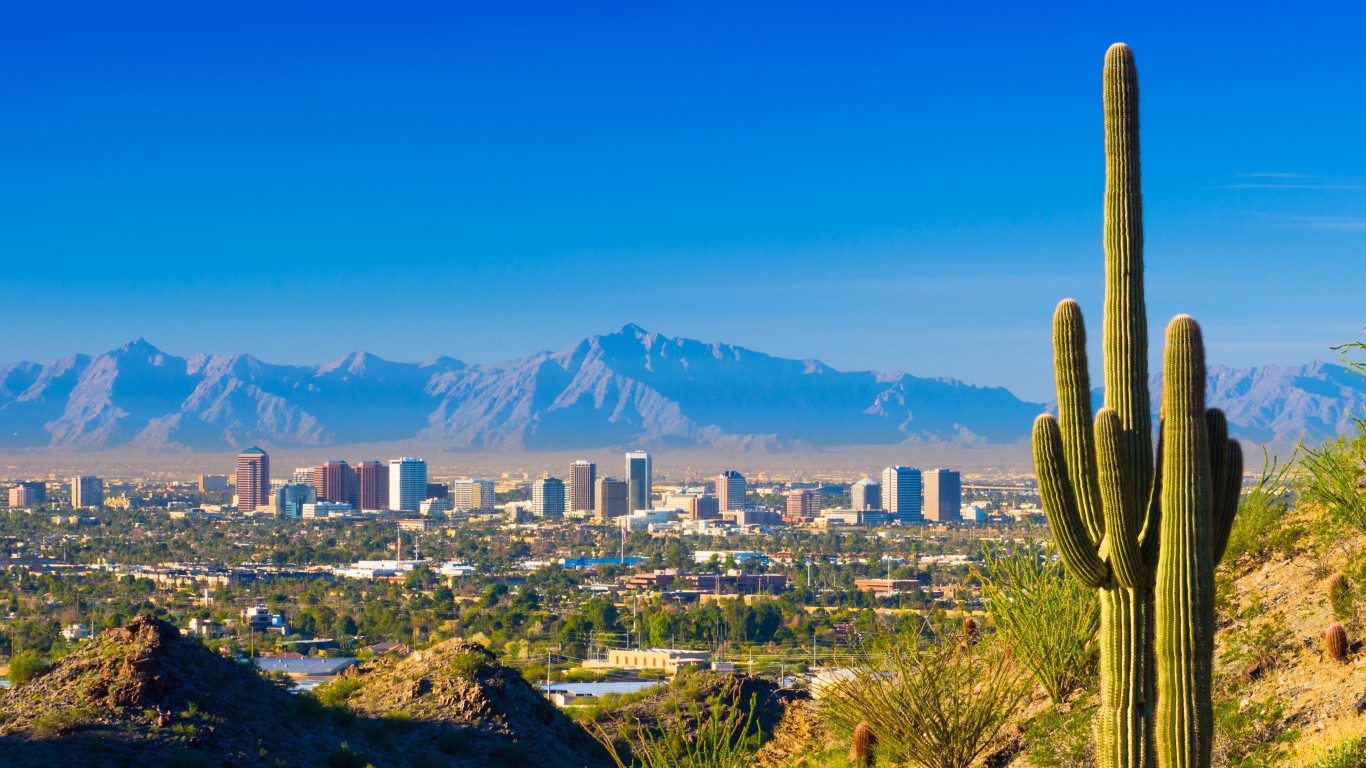
17. Scottsdale, AZ
> Overall score: 41.79
> Pollution rank: 7
> Living conditions rank: 58
> Infrastructure rank: 7
> Consumer satisfaction rank: 56
[in-text-ad-2]

16. Aurora, CO
> Overall score: 41.94
> Pollution rank: 29
> Living conditions rank: 48
> Infrastructure rank: 6
> Consumer satisfaction rank: 27

15. Memphis, TN
> Overall score: 4
> Pollution rank: 70
> Living conditions rank: 8
> Infrastructure rank: 12
> Consumer satisfaction rank: 10
[in-text-ad]

14. New York City
> Overall score: 42.19
> Pollution rank: 54
> Living conditions rank: 1
> Infrastructure rank: 49
> Consumer satisfaction rank: 6
[recirclink id=914085]

13. Cleveland
> Overall score: 42.2
> Pollution rank: 15
> Living conditions rank: 31
> Infrastructure rank: 14
> Consumer satisfaction rank: 45
12. Mesa, AZ
> Overall score: 42.62
> Pollution rank: 8
> Living conditions rank: 53
> Infrastructure rank: 20
> Consumer satisfaction rank: 28
[in-text-ad-2]

11. Anaheim, CA
> Overall score: 42.75
> Pollution rank: 23
> Living conditions rank: 27
> Infrastructure rank: 66
> Consumer satisfaction rank: 14

10. Chicago
> Overall score: 43.41
> Pollution rank: 27
> Living conditions rank: 4
> Infrastructure rank: 73
> Consumer satisfaction rank: 24
[in-text-ad]
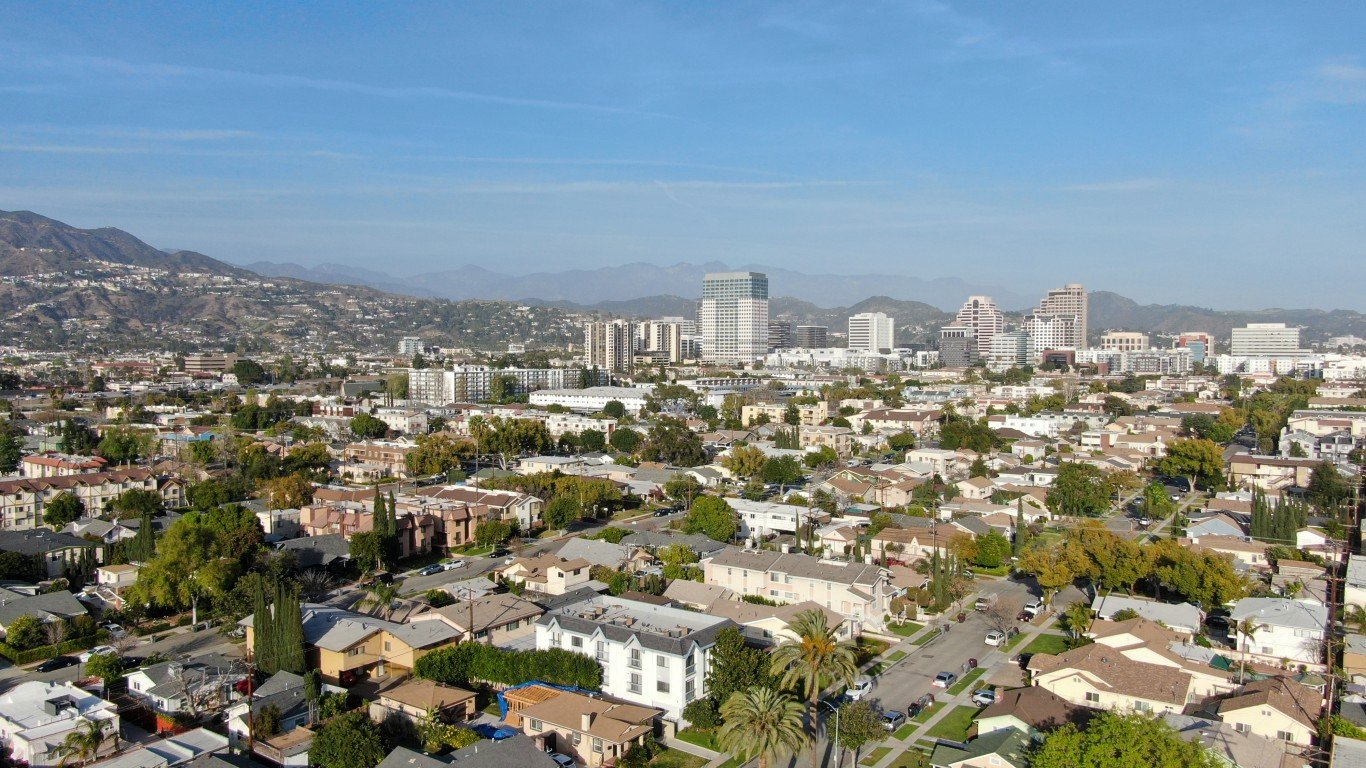
9. Glendale, CA
> Overall score: 43.89
> Pollution rank: 20
> Living conditions rank: 19
> Infrastructure rank: 13
> Consumer satisfaction rank: 47
[recirclink id=909976]
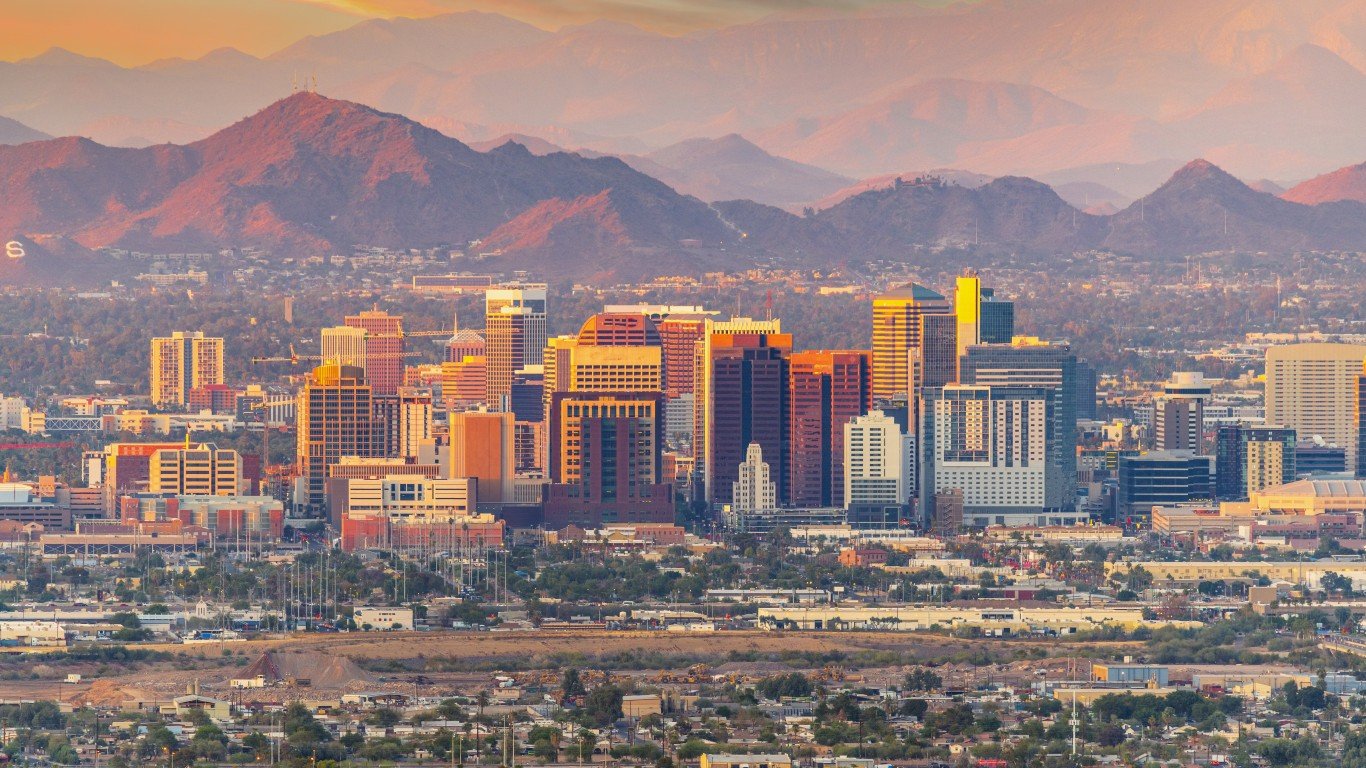
8. Phoenix
> Overall score: 45.55
> Pollution rank: 6
> Living conditions rank: 54
> Infrastructure rank: 9
> Consumer satisfaction rank: 23

7. Las Vegas
> Overall score: 45.91
> Pollution rank: 19
> Living conditions rank: 42
> Infrastructure rank: 2
> Consumer satisfaction rank: 21
[in-text-ad-2]

6. San Antonio
> Overall score: 46.92
> Pollution rank: 30
> Living conditions rank: 2
> Infrastructure rank: 25
> Consumer satisfaction rank: 22

5. Oklahoma City
> Overall score: 49.01
> Pollution rank: 10
> Living conditions rank: 3
> Infrastructure rank: 5
> Consumer satisfaction rank: 67
[in-text-ad]

4. San Bernardino, CA
> Overall score: 49.79
> Pollution rank: 2
> Living conditions rank: 41
> Infrastructure rank: 62
> Consumer satisfaction rank: 1
[recirclink id=862168]

3. Los Angeles
> Overall score: 49.87
> Pollution rank: 21
> Living conditions rank: 5
> Infrastructure rank: 31
> Consumer satisfaction rank: 5

2. Houston
> Overall score: 50.12
> Pollution rank: 9
> Living conditions rank: 7
> Infrastructure rank: 28
> Consumer satisfaction rank: 20
[in-text-ad-2]

1. Newark, NJ
> Overall score: 52.97
> Pollution rank: 13
> Living conditions rank: 21
> Infrastructure rank: 43
> Consumer satisfaction rank: 2
Methodology
To identify America’s dirtiest cities, 24/7 Tempo reviewed a ranking created by LawnStarter, a lawn care start-up that conducts research into city and state amenities on a regular basis. The site ranked cities across four key categories encompassing 23 individual metrics. The categories were pollution (including water quality violations and greenhouse-gas emissions), living conditions (measuring population density, share of homes lacking kitchen or plumbing facilities, etc.), infrastructure (counting number of junk yards, tons of landfill waste, and other factors), and consumer satisfaction (share of residents who find their city dirty and untidy and share dissatisfied with pollution, garbage disposal, and available green spaces).
Researchers began with a list of the country’s 200 largest cities by population, then eliminated 113 of them from their computations because they lacked data for more than 10% of the total metrics in any one category. According to LawnStarter, “The 87 cities that remained in our sample were then scored and ranked only on the metrics for which data were available. In most cases, a city lacked data for only one out of 23 total metrics and limited to two maximum for the fairest possible comparison.” The site drew on its own previous studies and on nine other sources, including County Health Rankings & Roadmaps, Numbeo, Texas A&M Transportation Institute, and the U.S. Environmental Protection Agency.
Contact [email protected] for any questions or corrections.