
The United States recorded a historic surge in homicides in 2020. According to the FBI, there were 21,570 murders nationwide in 2020, a 29% increase from 2019 – the largest single-year increase ever reported in the United States.
Though the precise reasons for the surge have yet to be determined, experts speculate that unrest following the murder of George Floyd, along with social and economic upheaval wrought by the COVID-19 pandemic, likely played a role. Gun sales also surged in 2020, and firearms were used in 77% of murder cases, up from 73% in 2019. Here is a look at the states where gun sales are surging.
Whatever the explanation, murder is now at its highest level in the U.S. since the mid-1990s – and some major metropolitan areas are bearing the brunt of rising levels of deadly violence.
Using data from the FBI, 24/7 Wall St. identified the 50 metro areas where the murder rate is rising fastest. Metro areas are ranked by the year-over-year change in the number of murders per 100,000 people. In nearly every metro area on this list, the increase in the murder rate was at least double the national uptick of 1.5 homicides per 100,000 in 2020.
Murder – along with rаpe, robbery, and aggravated assault – is one component of the overall violent crime category. Even though murder accounts for a small percentage of all violent crimes, most metro areas on this list also reported an increase in the overall violent crime rate in 2020. Here is a look at the states where crime is soaring.
The largest share of metro areas that reported the largest increases in homicide are in the Midwest, while only two metro areas on this list are in the Northeast. Most of the metro areas on this list have a higher overall homicide rate than the national rate of 6.5 murders per 100,000 people.
Click here to see metros where murder rate is soaring
Click here to read our detailed methodology

50. Spokane-Spokane Valley, WA
> 1-yr. change in reported homicides per 100K people: +2.9
> Homicides reported in 2020: 30 — 58th highest of 211 metros (tied)
> Homicides per 100K people in 2020: 5.2 — 104th highest of 211 metros
> 1-yr. change in all violent crime per 100K people: -31.0 — 21st lowest of 209 metros
> Violent crimes per 100K people in 2020: 350.0 — 101st lowest of 210 metros
> Population: 568,521
[in-text-ad]

49. Kalamazoo-Portage, MI
> 1-yr. change in reported homicides per 100K people: +3.0
> Homicides reported in 2020: 20 — 80th highest of 211 metros (tied)
> Homicides per 100K people in 2020: 7.5 — 54th highest of 211 metros
> 1-yr. change in all violent crime per 100K people: +90.7 — 20th highest of 209 metros
> Violent crimes per 100K people in 2020: 663.3 — 22nd highest of 210 metros
> Population: 265,066
[recirclink id=1038777]

48. Gainesville, FL
> 1-yr. change in reported homicides per 100K people: +3.0
> Homicides reported in 2020: 17 — 89th highest of 211 metros (tied)
> Homicides per 100K people in 2020: 5.1 — 105th lowest of 211 metros
> 1-yr. change in all violent crime per 100K people: +68.2 — 29th highest of 209 metros
> Violent crimes per 100K people in 2020: 760.3 — 13th highest of 210 metros
> Population: 328,517

47. Little Rock-North Little Rock-Conway, AR
> 1-yr. change in reported homicides per 100K people: +3.0
> Homicides reported in 2020: 98 — 20th highest of 211 metros
> Homicides per 100K people in 2020: 13.1 — 9th highest of 211 metros
> 1-yr. change in all violent crime per 100K people: +156.6 — 4th highest of 209 metros
> Violent crimes per 100K people in 2020: 938.8 — 7th highest of 210 metros
> Population: 744,483
[in-text-ad-2]

46. Akron, OH
> 1-yr. change in reported homicides per 100K people: +3.1
> Homicides reported in 2020: 55 — 33rd highest of 211 metros
> Homicides per 100K people in 2020: 7.8 — 51st highest of 211 metros
> 1-yr. change in all violent crime per 100K people: +6.7 — 91st lowest of 209 metros
> Violent crimes per 100K people in 2020: 378.4 — 87th highest of 210 metros
> Population: 703,479

45. Toledo, OH
> 1-yr. change in reported homicides per 100K people: +3.1
> Homicides reported in 2020: 56 — 30th highest of 211 metros (tied)
> Homicides per 100K people in 2020: 8.8 — 44th highest of 211 metros
> 1-yr. change in all violent crime per 100K people: +14.0 — 102nd highest of 209 metros
> Violent crimes per 100K people in 2020: 485.6 — 48th highest of 210 metros
> Population: 641,816
[in-text-ad]

44. Lewiston, ID-WA
> 1-yr. change in reported homicides per 100K people: +3.2
> Homicides reported in 2020: 3 — 20th lowest of 211 metros (tied)
> Homicides per 100K people in 2020: 4.7 — 98th lowest of 211 metros
> 1-yr. change in all violent crime per 100K people: +45.6 — 53rd highest of 209 metros
> Violent crimes per 100K people in 2020: 184.4 — 22nd lowest of 210 metros
> Population: 62,990
[recirclink id=1016354]

43. Greeley, CO
> 1-yr. change in reported homicides per 100K people: +3.3
> Homicides reported in 2020: 16 — 93rd highest of 211 metros (tied)
> Homicides per 100K people in 2020: 4.8 — 101st lowest of 211 metros
> 1-yr. change in all violent crime per 100K people: +108.3 — 14th highest of 209 metros
> Violent crimes per 100K people in 2020: 324.2 — 90th lowest of 210 metros
> Population: 324,492

42. Bangor, ME
> 1-yr. change in reported homicides per 100K people: +3.3
> Homicides reported in 2020: 6 — 53rd lowest of 211 metros (tied)
> Homicides per 100K people in 2020: 3.9 — 81st lowest of 211 metros
> 1-yr. change in all violent crime per 100K people: +13.4 — 104th highest of 209 metros
> Violent crimes per 100K people in 2020: 57.7 — the lowest of 210 metros
> Population: 152,148
[in-text-ad-2]

41. Bakersfield, CA
> 1-yr. change in reported homicides per 100K people: +3.5
> Homicides reported in 2020: 116 — 16th highest of 211 metros
> Homicides per 100K people in 2020: 12.9 — 10th highest of 211 metros
> 1-yr. change in all violent crime per 100K people: +71.2 — 26th highest of 209 metros
> Violent crimes per 100K people in 2020: 692.3 — 16th highest of 210 metros
> Population: 900,202

40. Charlottesville, VA
> 1-yr. change in reported homicides per 100K people: +3.6
> Homicides reported in 2020: 13 — 101st lowest of 211 metros (tied)
> Homicides per 100K people in 2020: 5.9 — 83rd highest of 211 metros
> 1-yr. change in all violent crime per 100K people: +12.6 — 102nd lowest of 209 metros
> Violent crimes per 100K people in 2020: 188.3 — 28th lowest of 210 metros
> Population: 218,358
[in-text-ad]

39. Fargo, ND-MN
> 1-yr. change in reported homicides per 100K people: +3.6
> Homicides reported in 2020: 14 — 98th highest of 211 metros (tied)
> Homicides per 100K people in 2020: 5.6 — 92nd highest of 211 metros
> 1-yr. change in all violent crime per 100K people: +54.0 — 39th highest of 209 metros
> Violent crimes per 100K people in 2020: 350.7 — 103rd lowest of 210 metros
> Population: 246,145
[recirclink id=1011842]

38. Sioux Falls, SD
> 1-yr. change in reported homicides per 100K people: +3.6
> Homicides reported in 2020: 15 — 96th highest of 211 metros (tied)
> Homicides per 100K people in 2020: 5.5 — 95th highest of 211 metros
> 1-yr. change in all violent crime per 100K people: +89.5 — 21st highest of 209 metros
> Violent crimes per 100K people in 2020: 477.7 — 53rd highest of 210 metros
> Population: 268,833

37. Cedar Rapids, IA
> 1-yr. change in reported homicides per 100K people: +3.6
> Homicides reported in 2020: 12 — 95th lowest of 211 metros (tied)
> Homicides per 100K people in 2020: 4.4 — 90th lowest of 211 metros
> 1-yr. change in all violent crime per 100K people: +63.4 — 33rd highest of 209 metros
> Violent crimes per 100K people in 2020: 251.9 — 59th lowest of 210 metros
> Population: 273,032
[in-text-ad-2]

36. Columbus, OH
> 1-yr. change in reported homicides per 100K people: +3.6
> Homicides reported in 2020: 192 — 8th highest of 211 metros
> Homicides per 100K people in 2020: 9.0 — 39th highest of 211 metros
> 1-yr. change in all violent crime per 100K people: +26.7 — 80th highest of 209 metros
> Violent crimes per 100K people in 2020: 313.2 — 85th lowest of 210 metros
> Population: 2,122,271

35. Lake Havasu City-Kingman, AZ
> 1-yr. change in reported homicides per 100K people: +3.7
> Homicides reported in 2020: 14 — 98th highest of 211 metros (tied)
> Homicides per 100K people in 2020: 6.5 — 68th highest of 211 metros
> 1-yr. change in all violent crime per 100K people: -1.7 — 72nd lowest of 209 metros
> Violent crimes per 100K people in 2020: 228.3 — 48th lowest of 210 metros
> Population: 212,181
[in-text-ad]

34. Harrisonburg, VA
> 1-yr. change in reported homicides per 100K people: +3.7
> Homicides reported in 2020: 5 — 41st lowest of 211 metros (tied)
> Homicides per 100K people in 2020: 3.7 — 77th lowest of 211 metros
> 1-yr. change in all violent crime per 100K people: +25.6 — 81st highest of 209 metros
> Violent crimes per 100K people in 2020: 152.2 — 11th lowest of 210 metros
> Population: 134,964
[recirclink id=984954]

33. Dover, DE
> 1-yr. change in reported homicides per 100K people: +3.7
> Homicides reported in 2020: 13 — 101st lowest of 211 metros (tied)
> Homicides per 100K people in 2020: 7.1 — 60th highest of 211 metros
> 1-yr. change in all violent crime per 100K people: +15.3 — 100th highest of 209 metros
> Violent crimes per 100K people in 2020: 442.6 — 64th highest of 210 metros
> Population: 180,786

32. Madera, CA
> 1-yr. change in reported homicides per 100K people: +3.8
> Homicides reported in 2020: 9 — 77th lowest of 211 metros (tied)
> Homicides per 100K people in 2020: 5.8 — 89th highest of 211 metros
> 1-yr. change in all violent crime per 100K people: -158.6 — the lowest of 209 metros
> Violent crimes per 100K people in 2020: 369.4 — 95th highest of 210 metros
> Population: 157,327
[in-text-ad-2]

31. Hilton Head Island-Bluffton, SC
> 1-yr. change in reported homicides per 100K people: +3.8
> Homicides reported in 2020: 22 — 74th highest of 211 metros (tied)
> Homicides per 100K people in 2020: 9.7 — 29th highest of 211 metros
> 1-yr. change in all violent crime per 100K people: -70.6 — 6th lowest of 209 metros
> Violent crimes per 100K people in 2020: 326.9 — 91st lowest of 210 metros
> Population: 222,195

30. Sierra Vista-Douglas, AZ
> 1-yr. change in reported homicides per 100K people: +4.0
> Homicides reported in 2020: 8 — 70th lowest of 211 metros (tied)
> Homicides per 100K people in 2020: 6.4 — 72nd highest of 211 metros
> 1-yr. change in all violent crime per 100K people: +28.3 — 75th highest of 209 metros
> Violent crimes per 100K people in 2020: 246.2 — 57th lowest of 210 metros
> Population: 125,922
[in-text-ad]

29. Champaign-Urbana, IL
> 1-yr. change in reported homicides per 100K people: +4.0
> Homicides reported in 2020: 12 — 95th lowest of 211 metros (tied)
> Homicides per 100K people in 2020: 5.3 — 102nd highest of 211 metros
> 1-yr. change in all violent crime per 100K people: N/A
> Violent crimes per 100K people in 2020: N/A
> Population: 226,033
[recirclink id=1055273]

28. Alexandria, LA
> 1-yr. change in reported homicides per 100K people: +4.0
> Homicides reported in 2020: 22 — 74th highest of 211 metros (tied)
> Homicides per 100K people in 2020: 14.5 — 8th highest of 211 metros
> 1-yr. change in all violent crime per 100K people: +118.6 — 9th highest of 209 metros
> Violent crimes per 100K people in 2020: 967.8 — 6th highest of 210 metros
> Population: 152,037

27. Vallejo, CA
> 1-yr. change in reported homicides per 100K people: +4.3
> Homicides reported in 2020: 40 — 43rd highest of 211 metros (tied)
> Homicides per 100K people in 2020: 8.9 — 40th highest of 211 metros
> 1-yr. change in all violent crime per 100K people: +52.8 — 43rd highest of 209 metros
> Violent crimes per 100K people in 2020: 525.7 — 38th highest of 210 metros
> Population: 447,643
[in-text-ad-2]

26. Merced, CA
> 1-yr. change in reported homicides per 100K people: +4.3
> Homicides reported in 2020: 24 — 67th highest of 211 metros (tied)
> Homicides per 100K people in 2020: 8.7 — 45th highest of 211 metros
> 1-yr. change in all violent crime per 100K people: +45.4 — 55th highest of 209 metros
> Violent crimes per 100K people in 2020: 598.6 — 29th highest of 210 metros
> Population: 277,680

25. Cleveland-Elyria, OH
> 1-yr. change in reported homicides per 100K people: +4.3
> Homicides reported in 2020: 210 — 7th highest of 211 metros
> Homicides per 100K people in 2020: 10.3 — 24th highest of 211 metros
> 1-yr. change in all violent crime per 100K people: +37.4 — 62nd highest of 209 metros
> Violent crimes per 100K people in 2020: 440.6 — 65th highest of 210 metros
> Population: 2,048,449
[in-text-ad]

24. Stockton, CA
> 1-yr. change in reported homicides per 100K people: +4.4
> Homicides reported in 2020: 84 — 25th highest of 211 metros
> Homicides per 100K people in 2020: 11.0 — 18th highest of 211 metros
> 1-yr. change in all violent crime per 100K people: -65.7 — 7th lowest of 209 metros
> Violent crimes per 100K people in 2020: 722.8 — 14th highest of 210 metros
> Population: 762,148
[recirclink id=1038777]

23. Springfield, OH
> 1-yr. change in reported homicides per 100K people: +4.5
> Homicides reported in 2020: 9 — 77th lowest of 211 metros (tied)
> Homicides per 100K people in 2020: 6.7 — 65th highest of 211 metros
> 1-yr. change in all violent crime per 100K people: +54.0 — 40th highest of 209 metros
> Violent crimes per 100K people in 2020: 300.5 — 81st lowest of 210 metros
> Population: 134,083

22. Hanford-Corcoran, CA
> 1-yr. change in reported homicides per 100K people: +4.6
> Homicides reported in 2020: 11 — 90th lowest of 211 metros (tied)
> Homicides per 100K people in 2020: 7.3 — 58th highest of 211 metros
> 1-yr. change in all violent crime per 100K people: +8.2 — 93rd lowest of 209 metros
> Violent crimes per 100K people in 2020: 513.0 — 41st highest of 210 metros
> Population: 152,940
[in-text-ad-2]

21. Kankakee, IL
> 1-yr. change in reported homicides per 100K people: +4.6
> Homicides reported in 2020: 10 — 86th lowest of 211 metros (tied)
> Homicides per 100K people in 2020: 9.2 — 35th highest of 211 metros
> 1-yr. change in all violent crime per 100K people: -33.2 — 20th lowest of 209 metros
> Violent crimes per 100K people in 2020: 355.4 — 105th lowest of 210 metros
> Population: 109,862

20. Tyler, TX
> 1-yr. change in reported homicides per 100K people: +4.6
> Homicides reported in 2020: 18 — 86th highest of 211 metros (tied)
> Homicides per 100K people in 2020: 7.7 — 53rd highest of 211 metros
> 1-yr. change in all violent crime per 100K people: +36.4 — 65th highest of 209 metros
> Violent crimes per 100K people in 2020: 370.5 — 94th highest of 210 metros
> Population: 232,751
[in-text-ad]
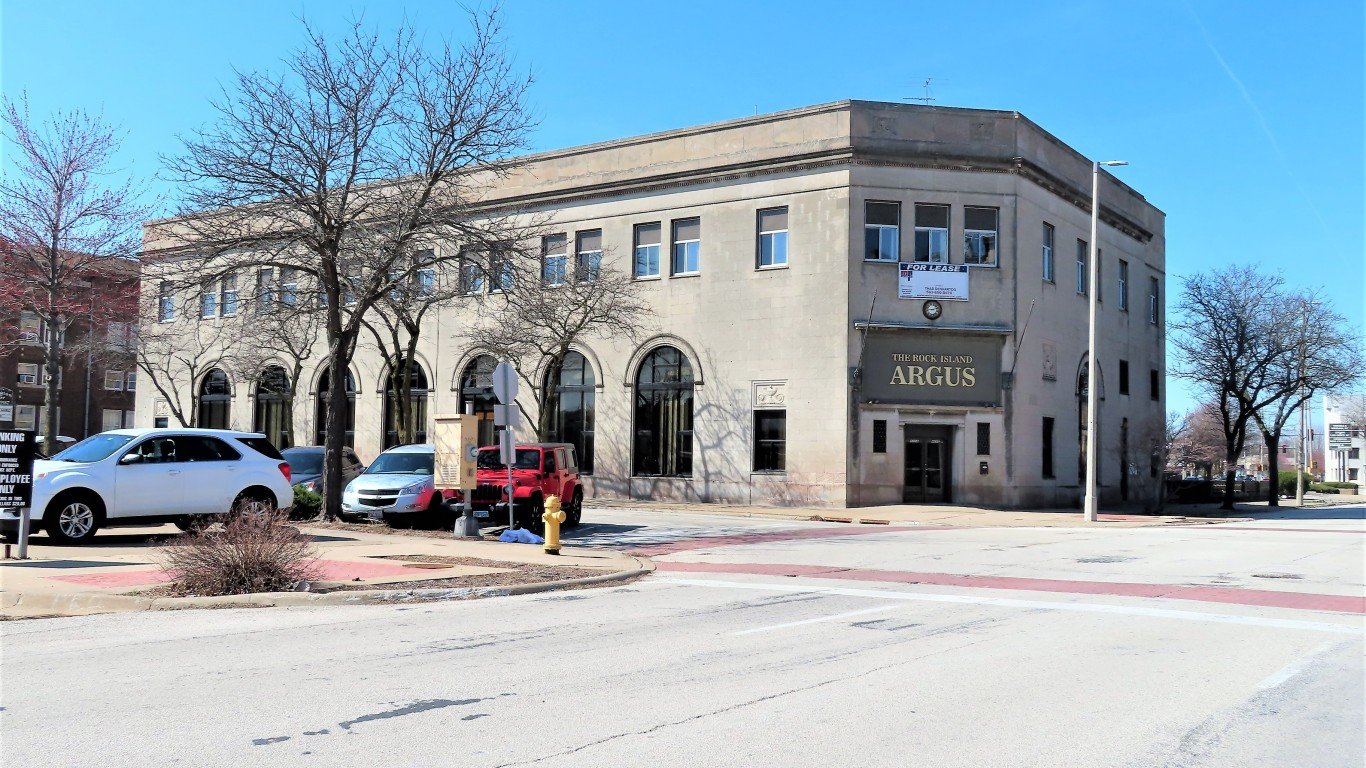
19. Davenport-Moline-Rock Island, IA-IL
> 1-yr. change in reported homicides per 100K people: +4.8
> Homicides reported in 2020: 26 — 63rd highest of 211 metros (tied)
> Homicides per 100K people in 2020: 6.9 — 64th highest of 211 metros
> 1-yr. change in all violent crime per 100K people: +109.5 — 13th highest of 209 metros
> Violent crimes per 100K people in 2020: 475.9 — 54th highest of 210 metros
> Population: 378,923
[recirclink id=1016354]

18. Sioux City, IA-NE-SD
> 1-yr. change in reported homicides per 100K people: +4.8
> Homicides reported in 2020: 9 — 77th lowest of 211 metros (tied)
> Homicides per 100K people in 2020: 6.2 — 76th highest of 211 metros
> 1-yr. change in all violent crime per 100K people: +112.7 — 12th highest of 209 metros
> Violent crimes per 100K people in 2020: 428.3 — 71st highest of 210 metros
> Population: 144,670

17. Rockford, IL
> 1-yr. change in reported homicides per 100K people: +4.8
> Homicides reported in 2020: 36 — 49th highest of 211 metros
> Homicides per 100K people in 2020: 10.8 — 19th highest of 211 metros
> 1-yr. change in all violent crime per 100K people: +136.2 — 5th highest of 209 metros
> Violent crimes per 100K people in 2020: 770.7 — 12th highest of 210 metros
> Population: 336,116
[in-text-ad-2]

16. Enid, OK
> 1-yr. change in reported homicides per 100K people: +4.9
> Homicides reported in 2020: 4 — 34th lowest of 211 metros (tied)
> Homicides per 100K people in 2020: 6.5 — 67th highest of 211 metros
> 1-yr. change in all violent crime per 100K people: +45.5 — 54th highest of 209 metros
> Violent crimes per 100K people in 2020: 415.8 — 78th highest of 210 metros
> Population: 61,056

15. Wilmington, NC
> 1-yr. change in reported homicides per 100K people: +5.6
> Homicides reported in 2020: 26 — 63rd highest of 211 metros (tied)
> Homicides per 100K people in 2020: 8.6 — 46th highest of 211 metros
> 1-yr. change in all violent crime per 100K people: -7.9 — 56th lowest of 209 metros
> Violent crimes per 100K people in 2020: 372.1 — 93rd highest of 210 metros
> Population: 297,533
[in-text-ad]

14. New Bern, NC
> 1-yr. change in reported homicides per 100K people: +5.7
> Homicides reported in 2020: 11 — 90th lowest of 211 metros (tied)
> Homicides per 100K people in 2020: 8.9 — 42nd highest of 211 metros
> 1-yr. change in all violent crime per 100K people: +79.6 — 24th highest of 209 metros
> Violent crimes per 100K people in 2020: 363.8 — 100th highest of 210 metros
> Population: 127,904
[recirclink id=1011842]

13. Jackson, MI
> 1-yr. change in reported homicides per 100K people: +5.7
> Homicides reported in 2020: 14 — 98th highest of 211 metros (tied)
> Homicides per 100K people in 2020: 8.9 — 43rd highest of 211 metros
> 1-yr. change in all violent crime per 100K people: +44.0 — 56th highest of 209 metros
> Violent crimes per 100K people in 2020: 558.3 — 35th highest of 210 metros
> Population: 158,510

12. Battle Creek, MI
> 1-yr. change in reported homicides per 100K people: +6.0
> Homicides reported in 2020: 14 — 98th highest of 211 metros (tied)
> Homicides per 100K people in 2020: 10.5 — 22nd highest of 211 metros
> 1-yr. change in all violent crime per 100K people: +39.6 — 58th highest of 209 metros
> Violent crimes per 100K people in 2020: 663.6 — 21st highest of 210 metros
> Population: 134,159
[in-text-ad-2]

11. California-Lexington Park, MD
> 1-yr. change in reported homicides per 100K people: +6.1
> Homicides reported in 2020: 8 — 70th lowest of 211 metros (tied)
> Homicides per 100K people in 2020: 7.0 — 62nd highest of 211 metros
> 1-yr. change in all violent crime per 100K people: -8.0 — 55th lowest of 209 metros
> Violent crimes per 100K people in 2020: 196.4 — 31st lowest of 210 metros
> Population: 113,510

10. Pueblo, CO
> 1-yr. change in reported homicides per 100K people: +6.5
> Homicides reported in 2020: 18 — 86th highest of 211 metros (tied)
> Homicides per 100K people in 2020: 10.7 — 20th highest of 211 metros
> 1-yr. change in all violent crime per 100K people: N/A
> Violent crimes per 100K people in 2020: 722.2 — 15th highest of 210 metros
> Population: 168,424
[in-text-ad]

9. Trenton-Princeton, NJ
> 1-yr. change in reported homicides per 100K people: +6.6
> Homicides reported in 2020: 41 — 39th highest of 211 metros (tied)
> Homicides per 100K people in 2020: 11.2 — 17th highest of 211 metros
> 1-yr. change in all violent crime per 100K people: +11.9 — 100th lowest of 209 metros
> Violent crimes per 100K people in 2020: 358.6 — 104th highest of 210 metros
> Population: 367,430
[recirclink id=984954]

8. Rapid City, SD
> 1-yr. change in reported homicides per 100K people: +6.9
> Homicides reported in 2020: 15 — 96th highest of 211 metros (tied)
> Homicides per 100K people in 2020: 10.4 — 23rd highest of 211 metros
> 1-yr. change in all violent crime per 100K people: +132.9 — 7th highest of 209 metros
> Violent crimes per 100K people in 2020: 665.1 — 19th highest of 210 metros
> Population: 142,191

7. Greenville, NC
> 1-yr. change in reported homicides per 100K people: +7.1
> Homicides reported in 2020: 21 — 77th highest of 211 metros (tied)
> Homicides per 100K people in 2020: 11.5 — 15th highest of 211 metros
> 1-yr. change in all violent crime per 100K people: +2.1 — 82nd lowest of 209 metros
> Violent crimes per 100K people in 2020: 364.6 — 99th highest of 210 metros
> Population: 180,742
[in-text-ad-2]

6. Sumter, SC
> 1-yr. change in reported homicides per 100K people: +7.8
> Homicides reported in 2020: 28 — 61st highest of 211 metros (tied)
> Homicides per 100K people in 2020: 19.9 — 3rd highest of 211 metros
> 1-yr. change in all violent crime per 100K people: +93.4 — 19th highest of 209 metros
> Violent crimes per 100K people in 2020: 812.0 — 10th highest of 210 metros
> Population: 140,466

5. Danville, IL
> 1-yr. change in reported homicides per 100K people: +8.2
> Homicides reported in 2020: 13 — 101st lowest of 211 metros (tied)
> Homicides per 100K people in 2020: 17.4 — 7th highest of 211 metros
> 1-yr. change in all violent crime per 100K people: +114.6 — 10th highest of 209 metros
> Violent crimes per 100K people in 2020: 1,050.3 — 4th highest of 210 metros
> Population: 75,758
[in-text-ad]

4. Saginaw, MI
> 1-yr. change in reported homicides per 100K people: +8.5
> Homicides reported in 2020: 33 — 54th highest of 211 metros (tied)
> Homicides per 100K people in 2020: 17.5 — 6th highest of 211 metros
> 1-yr. change in all violent crime per 100K people: +171.0 — 3rd highest of 209 metros
> Violent crimes per 100K people in 2020: 794.6 — 11th highest of 210 metros
> Population: 190,539
[recirclink id=1055273]

3. Grants Pass, OR
> 1-yr. change in reported homicides per 100K people: +10.3
> Homicides reported in 2020: 9 — 77th lowest of 211 metros (tied)
> Homicides per 100K people in 2020: 10.3 — 25th highest of 211 metros
> 1-yr. change in all violent crime per 100K people: +49.1 — 46th highest of 209 metros
> Violent crimes per 100K people in 2020: 287.7 — 77th lowest of 210 metros
> Population: 87,487

2. Flint, MI
> 1-yr. change in reported homicides per 100K people: +11.2
> Homicides reported in 2020: 75 — 28th highest of 211 metros
> Homicides per 100K people in 2020: 18.6 — 5th highest of 211 metros
> 1-yr. change in all violent crime per 100K people: -2.1 — 69th lowest of 209 metros
> Violent crimes per 100K people in 2020: 577.6 — 31st highest of 210 metros
> Population: 405,813
[in-text-ad-2]
1. Shreveport-Bossier City, LA
> 1-yr. change in reported homicides per 100K people: +11.3
> Homicides reported in 2020: 85 — 24th highest of 211 metros
> Homicides per 100K people in 2020: 21.6 — 2nd highest of 211 metros
> 1-yr. change in all violent crime per 100K people: +119.8 — 8th highest of 209 metros
> Violent crimes per 100K people in 2020: 683.0 — 17th highest of 210 metros
> Population: 394,706
Methodology
To determine the metro areas where the murder rate is rising, 24/7 Wall St. reviewed the change in murder rate per 100,000 people from the FBI’s 2019 and 2020 Uniform Crime Reports.
Limited data was available in the 2020 UCR for areas in Alabama, Maryland, Pennsylvania, and Illinois, though metro areas in these states were not excluded from analysis. Only metro areas for which the boundaries defined by the FBI match the boundaries as defined by the U.S. Census Bureau were considered. Because some state and local agencies changed reporting practices between 2019 and 2020, the figures are not comparable, and these areas were excluded.
Population figures are one-year estimates from the U.S. Census Bureau’s 2019 American Community Survey. However, these estimates were not used to calculate crime rates. Crime rates per 100,000 people were calculated using population figures provided by the FBI in the 2020 and 2019 UCR.
Contact [email protected] for any questions or corrections.