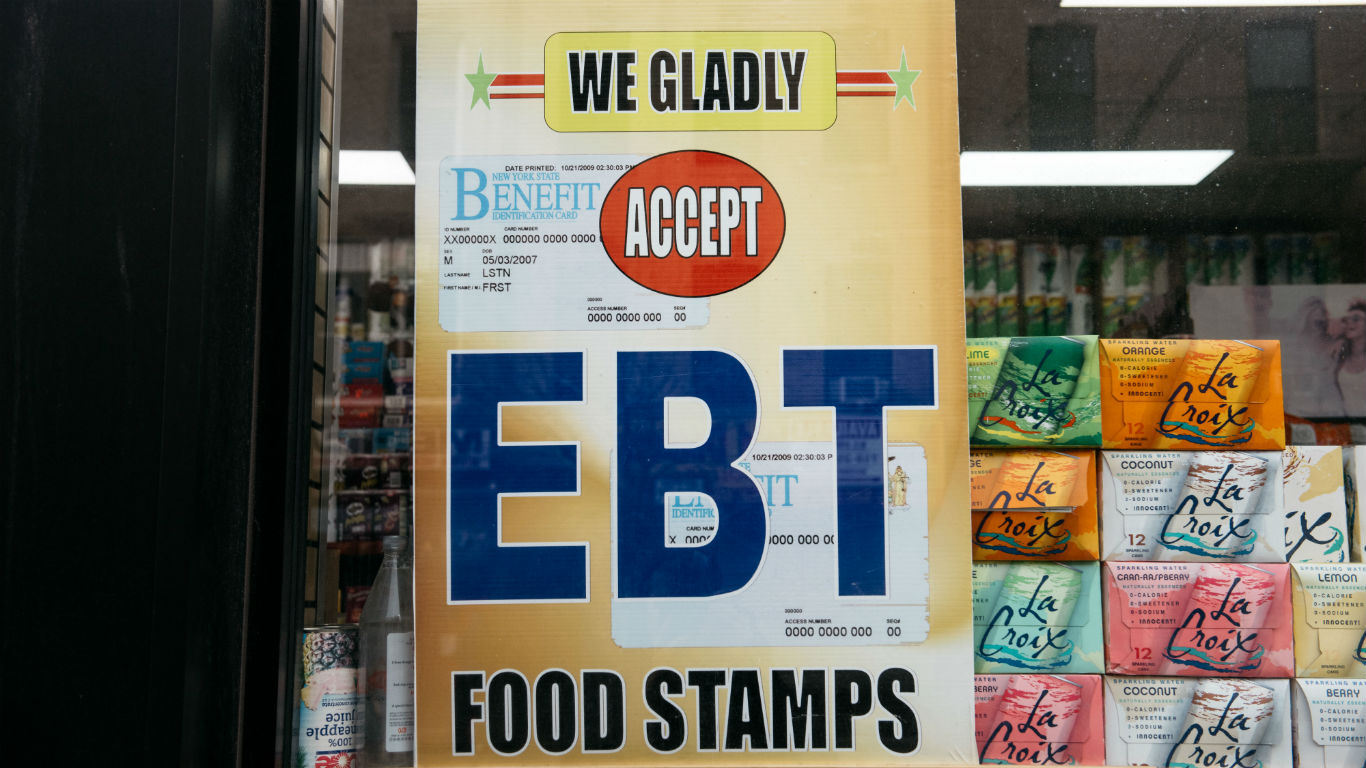
Inflation has driven up the prices of nearly all goods and services, including necessary items such as groceries. The cost of a gallon of milk is up 25% compared to pre-pandemic prices. According to a report by Moody’s Analytics, American families pay $311 more each month, on average, for essential goods compared to one year ago. To survive the price hikes, millions of Americans may have to rely on the government’s food assistance benefits, the Supplemental Nutrition Assistance Program.
As of 2020, roughly 13.8 million American households, about one in 10, received SNAP benefits, formerly known as food stamps. At the more local level, the SNAP recipiency rate can be much higher.
To find the 50 counties with the highest SNAP recipiency rates, 24/7 Wall St. reviewed five-year estimates of the share of households that received SNAP benefits in the past 12 months from the U.S. Census Bureau’s 2020 American Community Survey. As of 2020, 11.4% of U.S. households received SNAP benefits. Among the 50 counties or county equivalents on this list, that share ranges from 30.4% to 55.0% of households.
While factors such as assets and household composition impact whether a household qualifies, SNAP recipiency is primarily determined by income. So, as might be expected, counties with higher poverty rates also tend to have more households receiving benefits. In 2020, 12.8% of Americans lived below the poverty line. All 50 counties on this list have a poverty rate of at least 20%, and in the case of Todd County, South Dakota, 58.9% of the population live below the poverty line, the highest share out of the roughly 3,000 American counties. These are the states where the most children live in poverty.
Because income is the primary determinant for SNAP recipiency, unemployment is a major determinant in how many people receive benefits, as those Americans who are out of a job are likely to have little to no income. Most of the counties on this list have five-year average unemployment rates of at least 10%, compared to the U.S. five-year average unemployment rate of 5.3%. Ziebach County, South Dakota, which has the 14th highest SNAP recipiency rate, has a five-year unemployment rate of 30.4%, the highest of any county or county equivalent. These are the states with the worst spikes in unemployment since the pandemic began.
Click here to see the counties where the most people need food stamps
Click here to read our detailed methodology

50. Lowndes County, Alabama
> Households receiving SNAP benefits: 30.4%
> Poverty rate: 22.4% — 326th highest of 2,987 counties
> Median household income: $33,634 — 105th lowest of 2,987 counties
> Unemployment rate: 10.5% — 102nd highest of 2,987 counties
[in-text-ad]

49. Phillips County, Arkansas
> Households receiving SNAP benefits: 30.5%
> Poverty rate: 31.3% — 50th highest of 2,987 counties
> Median household income: $33,724 — 106th lowest of 2,987 counties
> Unemployment rate: 14.3% — 24th highest of 2,987 counties
[recirclink id=1112369]

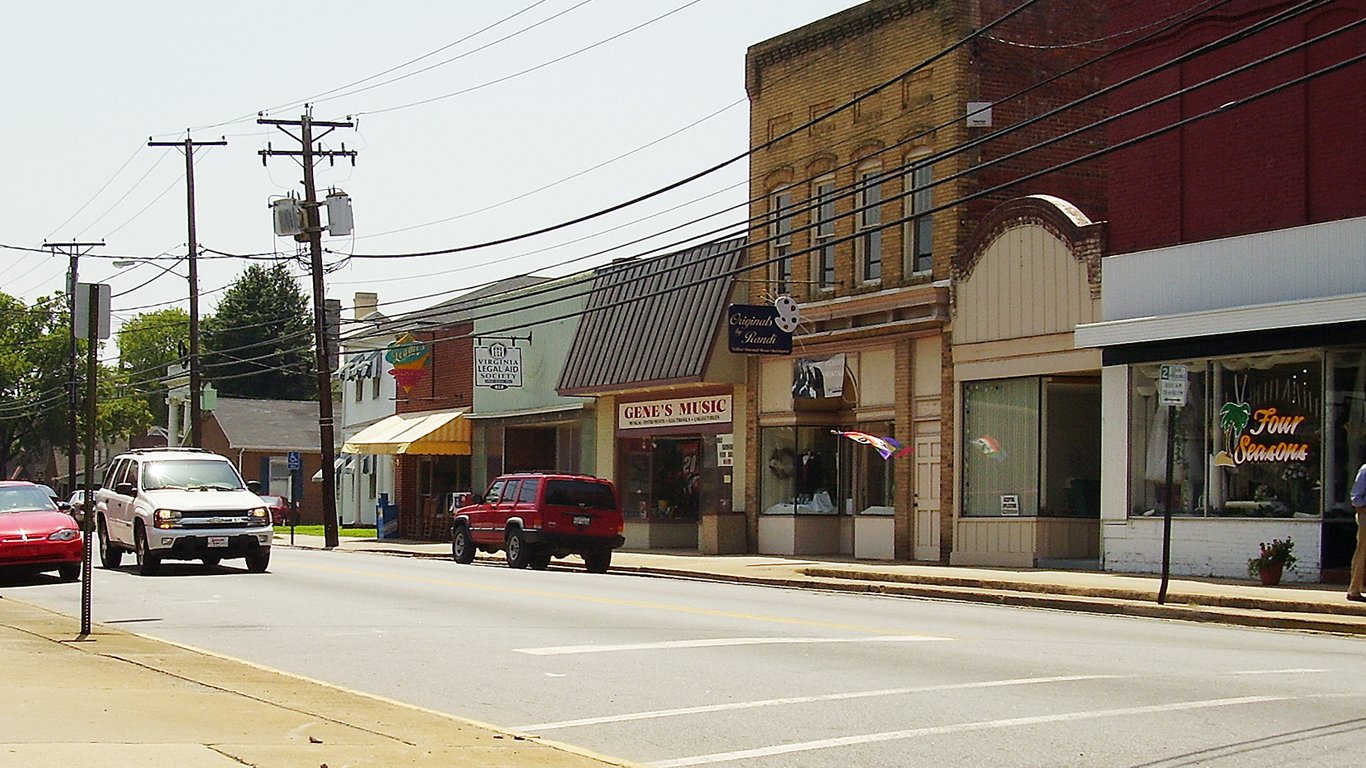
48. Norton city, Virginia
> Households receiving SNAP benefits: 30.6%
> Poverty rate: 31.6% — 46th highest of 2,987 counties
> Median household income: $30,518 — 43rd lowest of 2,987 counties
> Unemployment rate: 8.6% — 252nd highest of 2,987 counties

47. Madison Parish, Louisiana
> Households receiving SNAP benefits: 30.7%
> Poverty rate: 36.1% — 18th highest of 2,987 counties
> Median household income: $32,585 — 81st lowest of 2,987 counties
> Unemployment rate: 9.8% — 138th highest of 2,987 counties
[in-text-ad-2]
46. Emporia city, Virginia
> Households receiving SNAP benefits: 31.0%
> Poverty rate: 21.8% — 364th highest of 2,987 counties
> Median household income: $30,058 — 37th lowest of 2,987 counties
> Unemployment rate: 16.7% — 12th highest of 2,987 counties

45. Knox County, Kentucky
> Households receiving SNAP benefits: 31.1%
> Poverty rate: 33.5% — 32nd highest of 2,987 counties
> Median household income: $30,257 — 40th lowest of 2,987 counties
> Unemployment rate: 6.3% — 748th highest of 2,987 counties
[in-text-ad]

44. Clay County, Georgia
> Households receiving SNAP benefits: 31.3%
> Poverty rate: 32.7% — 38th highest of 2,987 counties
> Median household income: $32,434 — 79th lowest of 2,987 counties
> Unemployment rate: 10.1% — 112th highest of 2,987 counties
[recirclink id=1111559]

43. Brooks County, Texas
> Households receiving SNAP benefits: 31.3%
> Poverty rate: 40.2% — 9th highest of 2,987 counties
> Median household income: $25,058 — 10th lowest of 2,987 counties
> Unemployment rate: 1.1% — 30th lowest of 2,987 counties

42. Quitman County, Mississippi
> Households receiving SNAP benefits: 31.4%
> Poverty rate: 33.9% — 31st highest of 2,987 counties
> Median household income: $24,233 — 6th lowest of 2,987 counties
> Unemployment rate: 15.7% — 16th highest of 2,987 counties
[in-text-ad-2]

41. Webster County, West Virginia
> Households receiving SNAP benefits: 31.4%
> Poverty rate: 27.1% — 128th highest of 2,987 counties
> Median household income: $33,358 — 100th lowest of 2,987 counties
> Unemployment rate: 11.8% — 59th highest of 2,987 counties
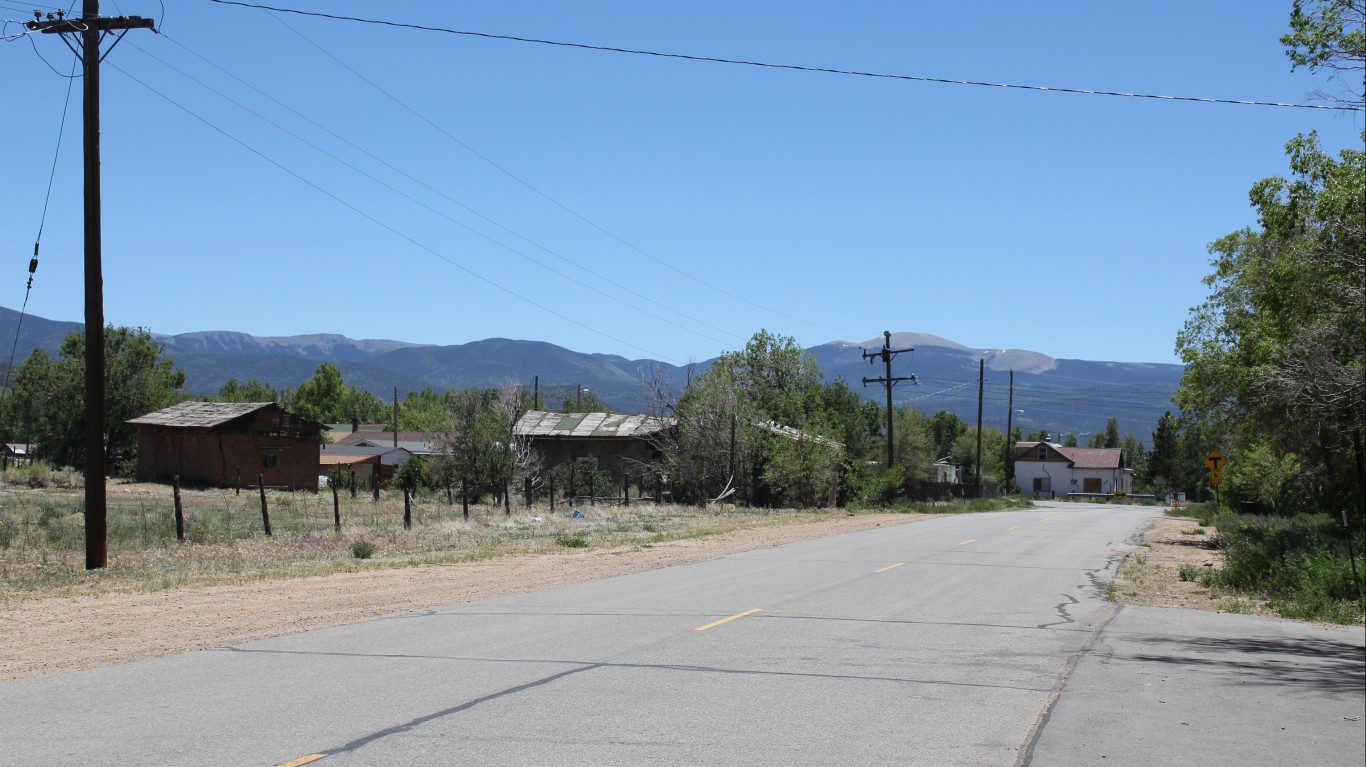
40. Costilla County, Colorado
> Households receiving SNAP benefits: 31.4%
> Poverty rate: 26.6% — 146th highest of 2,987 counties
> Median household income: $34,732 — 131st lowest of 2,987 counties
> Unemployment rate: 9.3% — 169th highest of 2,987 counties
[in-text-ad]

39. McCreary County, Kentucky
> Households receiving SNAP benefits: 31.7%
> Poverty rate: 31.7% — 45th highest of 2,987 counties
> Median household income: $29,499 — 32nd lowest of 2,987 counties
> Unemployment rate: 7.7% — 375th highest of 2,987 counties
[recirclink id=1047662]

38. Tunica County, Mississippi
> Households receiving SNAP benefits: 31.8%
> Poverty rate: 31.7% — 44th highest of 2,987 counties
> Median household income: $34,485 — 123rd lowest of 2,987 counties
> Unemployment rate: 8.1% — 308th highest of 2,987 counties

37. Zavala County, Texas
> Households receiving SNAP benefits: 31.8%
> Poverty rate: 35.2% — 22nd highest of 2,987 counties
> Median household income: $40,090 — 348th lowest of 2,987 counties
> Unemployment rate: 4.4% — 1,141st lowest of 2,987 counties
[in-text-ad-2]

36. Nome Census Area, Alaska
> Households receiving SNAP benefits: 32.0%
> Poverty rate: 22.4% — 328th highest of 2,987 counties
> Median household income: $62,843 — 657th highest of 2,987 counties
> Unemployment rate: 17.9% — 8th highest of 2,987 counties

35. Mississippi County, Missouri
> Households receiving SNAP benefits: 32.0%
> Poverty rate: 23.7% — 251st highest of 2,987 counties
> Median household income: $34,354 — 120th lowest of 2,987 counties
> Unemployment rate: 8.3% — 283rd highest of 2,987 counties
[in-text-ad]

34. Hancock County, Tennessee
> Households receiving SNAP benefits: 32.2%
> Poverty rate: 31.1% — 56th highest of 2,987 counties
> Median household income: $28,234 — 22nd lowest of 2,987 counties
> Unemployment rate: 12.0% — 56th highest of 2,987 counties
[recirclink id=1104870]

33. Taliaferro County, Georgia
> Households receiving SNAP benefits: 32.3%
> Poverty rate: 24.7% — 206th highest of 2,987 counties
> Median household income: $37,717 — 237th lowest of 2,987 counties
> Unemployment rate: 4.2% — 1,038th lowest of 2,987 counties

32. Lake County, Tennessee
> Households receiving SNAP benefits: 32.3%
> Poverty rate: 31.0% — 59th highest of 2,987 counties
> Median household income: $34,230 — 118th lowest of 2,987 counties
> Unemployment rate: 12.3% — 47th highest of 2,987 counties
[in-text-ad-2]

31. Yukon-Koyukuk Census Area, Alaska
> Households receiving SNAP benefits: 32.5%
> Poverty rate: 23.7% — 252nd highest of 2,987 counties
> Median household income: $41,728 — 446th lowest of 2,987 counties
> Unemployment rate: 14.9% — 20th highest of 2,987 counties

30. Mingo County, West Virginia
> Households receiving SNAP benefits: 32.6%
> Poverty rate: 27.4% — 120th highest of 2,987 counties
> Median household income: $35,454 — 156th lowest of 2,987 counties
> Unemployment rate: 14.0% — 27th highest of 2,987 counties
[in-text-ad]

29. Magoffin County, Kentucky
> Households receiving SNAP benefits: 32.9%
> Poverty rate: 29.2% — 88th highest of 2,987 counties
> Median household income: $27,807 — 19th lowest of 2,987 counties
> Unemployment rate: 12.2% — 50th highest of 2,987 counties
[recirclink id=1100321]

28. Hamilton County, Florida
> Households receiving SNAP benefits: 33.0%
> Poverty rate: 25.7% — 171st highest of 2,987 counties
> Median household income: $38,300 — 266th lowest of 2,987 counties
> Unemployment rate: 10.0% — 128th highest of 2,987 counties
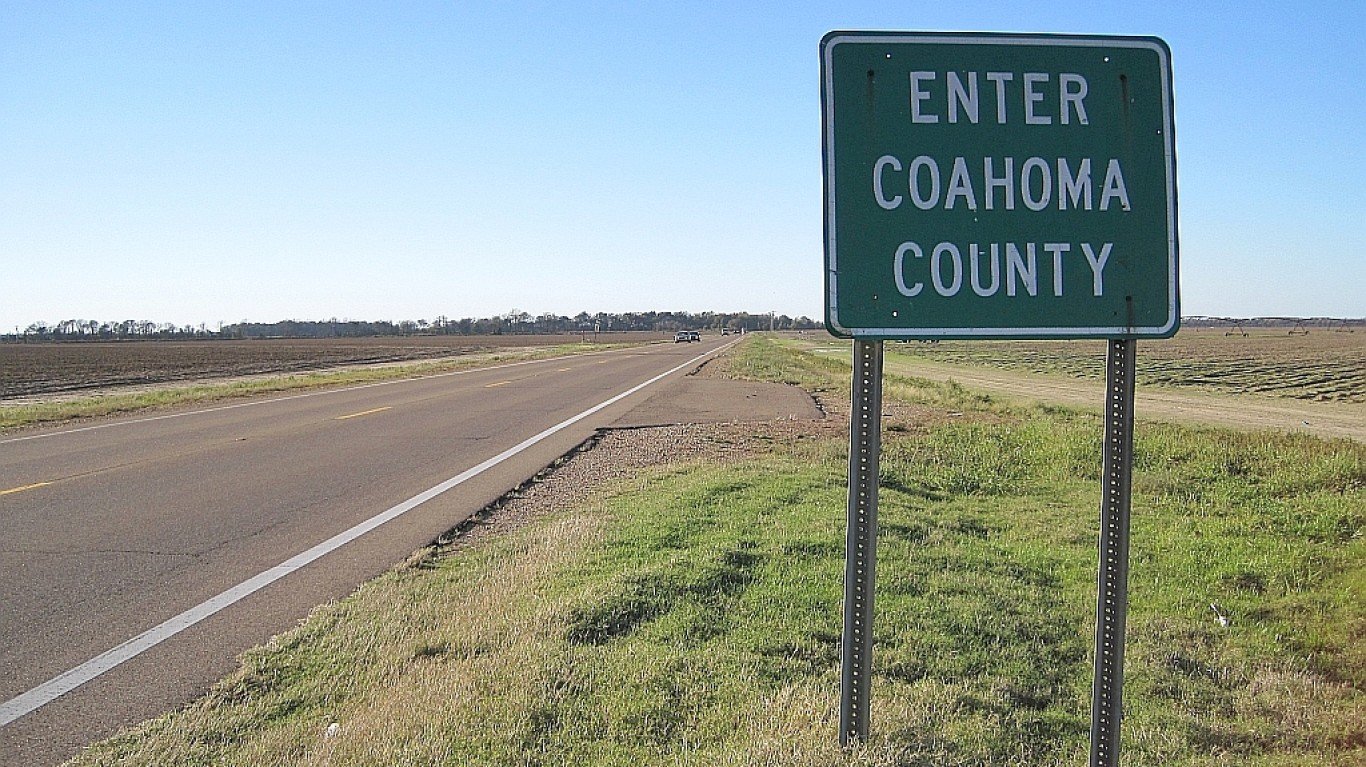
27. Coahoma County, Mississippi
> Households receiving SNAP benefits: 33.1%
> Poverty rate: 36.5% — 15th highest of 2,987 counties
> Median household income: $30,761 — 48th lowest of 2,987 counties
> Unemployment rate: 12.0% — 54th highest of 2,987 counties
[in-text-ad-2]

26. Calhoun County, Georgia
> Households receiving SNAP benefits: 33.1%
> Poverty rate: 24.9% — 198th highest of 2,987 counties
> Median household income: $41,962 — 470th lowest of 2,987 counties
> Unemployment rate: 11.0% — 78th highest of 2,987 counties

25. Mitchell County, Georgia
> Households receiving SNAP benefits: 33.1%
> Poverty rate: 26.3% — 153rd highest of 2,987 counties
> Median household income: $39,404 — 310th lowest of 2,987 counties
> Unemployment rate: 10.9% — 84th highest of 2,987 counties
[in-text-ad]

24. Perry County, Alabama
> Households receiving SNAP benefits: 33.4%
> Poverty rate: 36.1% — 19th highest of 2,987 counties
> Median household income: $23,875 — 3rd lowest of 2,987 counties
> Unemployment rate: 11.4% — 71st highest of 2,987 counties
[recirclink id=1112369]

23. Breathitt County, Kentucky
> Households receiving SNAP benefits: 33.5%
> Poverty rate: 33.4% — 33rd highest of 2,987 counties
> Median household income: $29,538 — 34th lowest of 2,987 counties
> Unemployment rate: 9.1% — 188th highest of 2,987 counties

22. Pemiscot County, Missouri
> Households receiving SNAP benefits: 34.2%
> Poverty rate: 30.0% — 72nd highest of 2,987 counties
> Median household income: $34,709 — 129th lowest of 2,987 counties (tied)
> Unemployment rate: 11.3% — 73rd highest of 2,987 counties
[in-text-ad-2]

21. Clay County, West Virginia
> Households receiving SNAP benefits: 34.2%
> Poverty rate: 28.2% — 103rd highest of 2,987 counties
> Median household income: $35,154 — 146th lowest of 2,987 counties
> Unemployment rate: 12.8% — 39th highest of 2,987 counties

20. Clay County, Kentucky
> Households receiving SNAP benefits: 34.3%
> Poverty rate: 34.9% — 26th highest of 2,987 counties
> Median household income: $27,479 — 18th lowest of 2,987 counties
> Unemployment rate: 9.5% — 154th highest of 2,987 counties
[in-text-ad]

19. Sunflower County, Mississippi
> Households receiving SNAP benefits: 34.5%
> Poverty rate: 30.6% — 65th highest of 2,987 counties
> Median household income: $31,515 — 59th lowest of 2,987 counties (tied)
> Unemployment rate: 11.0% — 82nd highest of 2,987 counties
[recirclink id=1111559]

18. Northwest Arctic Borough, Alaska
> Households receiving SNAP benefits: 34.5%
> Poverty rate: 23.2% — 274th highest of 2,987 counties
> Median household income: $63,750 — 608th highest of 2,987 counties (tied)
> Unemployment rate: 16.0% — 15th highest of 2,987 counties

17. McDowell County, West Virginia
> Households receiving SNAP benefits: 35.0%
> Poverty rate: 32.8% — 37th highest of 2,987 counties
> Median household income: $26,072 — 13th lowest of 2,987 counties
> Unemployment rate: 15.0% — 19th highest of 2,987 counties
[in-text-ad-2]

16. Hudspeth County, Texas
> Households receiving SNAP benefits: 35.0%
> Poverty rate: 23.1% — 280th highest of 2,987 counties
> Median household income: $31,505 — 58th lowest of 2,987 counties
> Unemployment rate: 8.7% — 242nd highest of 2,987 counties

15. Bronx County, New York
> Households receiving SNAP benefits: 35.2%
> Poverty rate: 27.0% — 132nd highest of 2,987 counties
> Median household income: $41,895 — 465th lowest of 2,987 counties
> Unemployment rate: 10.0% — 122nd highest of 2,987 counties
[in-text-ad]

14. Ziebach County, South Dakota
> Households receiving SNAP benefits: 35.4%
> Poverty rate: 42.9% — 5th highest of 2,987 counties
> Median household income: $36,615 — 189th lowest of 2,987 counties
> Unemployment rate: 30.4% — the highest of 2,987 counties
[recirclink id=1047662]

13. Wolfe County, Kentucky
> Households receiving SNAP benefits: 36.3%
> Poverty rate: 36.1% — 17th highest of 2,987 counties
> Median household income: $22,292 — the lowest of 2,987 counties
> Unemployment rate: 25.2% — 2nd highest of 2,987 counties

12. Owsley County, Kentucky
> Households receiving SNAP benefits: 36.5%
> Poverty rate: 28.1% — 109th highest of 2,987 counties
> Median household income: $29,406 — 30th lowest of 2,987 counties
> Unemployment rate: 11.0% — 79th highest of 2,987 counties
[in-text-ad-2]

11. Randolph County, Georgia
> Households receiving SNAP benefits: 36.5%
> Poverty rate: 29.7% — 76th highest of 2,987 counties
> Median household income: $29,400 — 29th lowest of 2,987 counties
> Unemployment rate: 8.8% — 227th highest of 2,987 counties

10. Humphreys County, Mississippi
> Households receiving SNAP benefits: 36.8%
> Poverty rate: 35.8% — 20th highest of 2,987 counties
> Median household income: $28,628 — 26th lowest of 2,987 counties
> Unemployment rate: 14.4% — 21st highest of 2,987 counties
[in-text-ad]

9. Todd County, South Dakota
> Households receiving SNAP benefits: 37.7%
> Poverty rate: 58.9% — the highest of 2,987 counties
> Median household income: $24,102 — 5th lowest of 2,987 counties
> Unemployment rate: 10.7% — 91st highest of 2,987 counties
[recirclink id=1104870]

8. Sharkey County, Mississippi
> Households receiving SNAP benefits: 37.7%
> Poverty rate: 24.1% — 225th highest of 2,987 counties
> Median household income: $35,711 — 165th lowest of 2,987 counties
> Unemployment rate: 10.4% — 104th highest of 2,987 counties

7. Lee County, Kentucky
> Households receiving SNAP benefits: 38.1%
> Poverty rate: 32.2% — 41st highest of 2,987 counties
> Median household income: $24,699 — 9th lowest of 2,987 counties
> Unemployment rate: 10.1% — 121st highest of 2,987 counties
[in-text-ad-2]

6. Starr County, Texas
> Households receiving SNAP benefits: 38.5%
> Poverty rate: 34.2% — 30th highest of 2,987 counties
> Median household income: $30,931 — 52nd lowest of 2,987 counties
> Unemployment rate: 13.1% — 34th highest of 2,987 counties

5. Buffalo County, South Dakota
> Households receiving SNAP benefits: 39.4%
> Poverty rate: 37.3% — 14th highest of 2,987 counties
> Median household income: $35,000 — 137th lowest of 2,987 counties
> Unemployment rate: 22.0% — 5th highest of 2,987 counties
[in-text-ad]

4. Bethel Census Area, Alaska
> Households receiving SNAP benefits: 41.2%
> Poverty rate: 28.6% — 98th highest of 2,987 counties
> Median household income: $54,400 — 1,319th highest of 2,987 counties
> Unemployment rate: 17.5% — 9th highest of 2,987 counties
[recirclink id=1100321]

3. Presidio County, Texas
> Households receiving SNAP benefits: 43.5%
> Poverty rate: 39.9% — 11th highest of 2,987 counties
> Median household income: $22,716 — 2nd lowest of 2,987 counties
> Unemployment rate: 9.9% — 136th highest of 2,987 counties

2. Kusilvak Census Area, Alaska
> Households receiving SNAP benefits: 55.0%
> Poverty rate: 37.9% — 13th highest of 2,987 counties
> Median household income: $37,358 — 224th lowest of 2,987 counties
> Unemployment rate: 22.4% — 4th highest of 2,987 counties
[in-text-ad-2]

1. Oglala Lakota County, South Dakota
> Households receiving SNAP benefits: 55.0%
> Poverty rate: 44.8% — 4th highest of 2,987 counties
> Median household income: $31,423 — 55th lowest of 2,987 counties
> Unemployment rate: 16.3% — 14th highest of 2,987 counties
Methodology
To determine the counties with the highest SNAP recipiency rates, 24/7 Wall St. reviewed five-year estimates of the share of households that received SNAP benefits in the past 12 months from the U.S. Census Bureau’s 2020 American Community Survey.
Counties were excluded if the SNAP recipiency rate was not available in the 2020 ACS, if there were fewer than 500 households, or if the sampling error associated with a county’s data was deemed too high.
The sampling error was defined as too high if the coefficient of variation — a statistical assessment of how reliable an estimate is — for a county’s SNAP recipiency rate was above 15% and greater than two standard deviations above the mean CV for all counties’ SNAP recipiency rates. We similarly excluded counties that had a sampling error too high for their population, using the same definition.
Counties were ranked based on the share of households that received SNAP benefits in the past 12 months. To break ties, we used the number of households that received SNAP benefits in the past 12 months.
Additional information on poverty rate, median household income, and unemployment rate are also five-year estimates from the 2020 ACS.
Contact [email protected] for any questions or corrections.