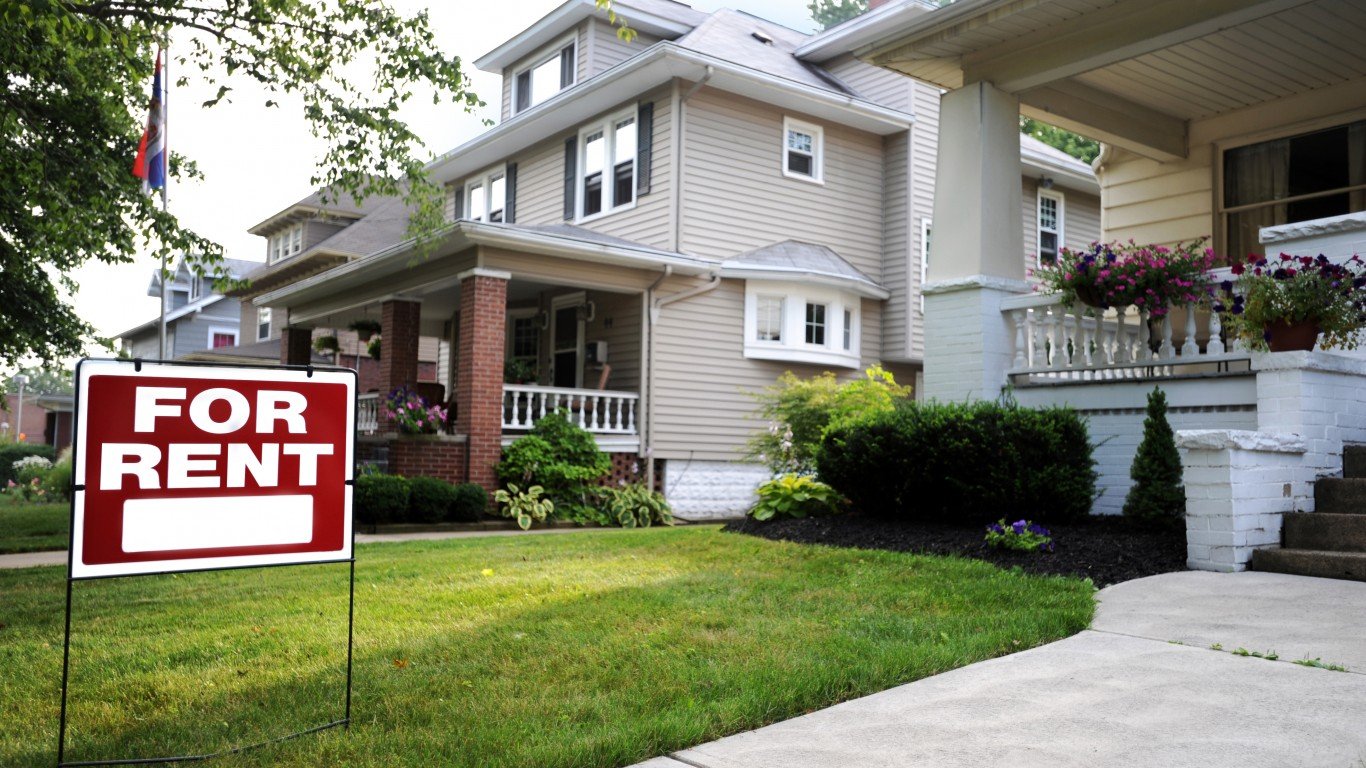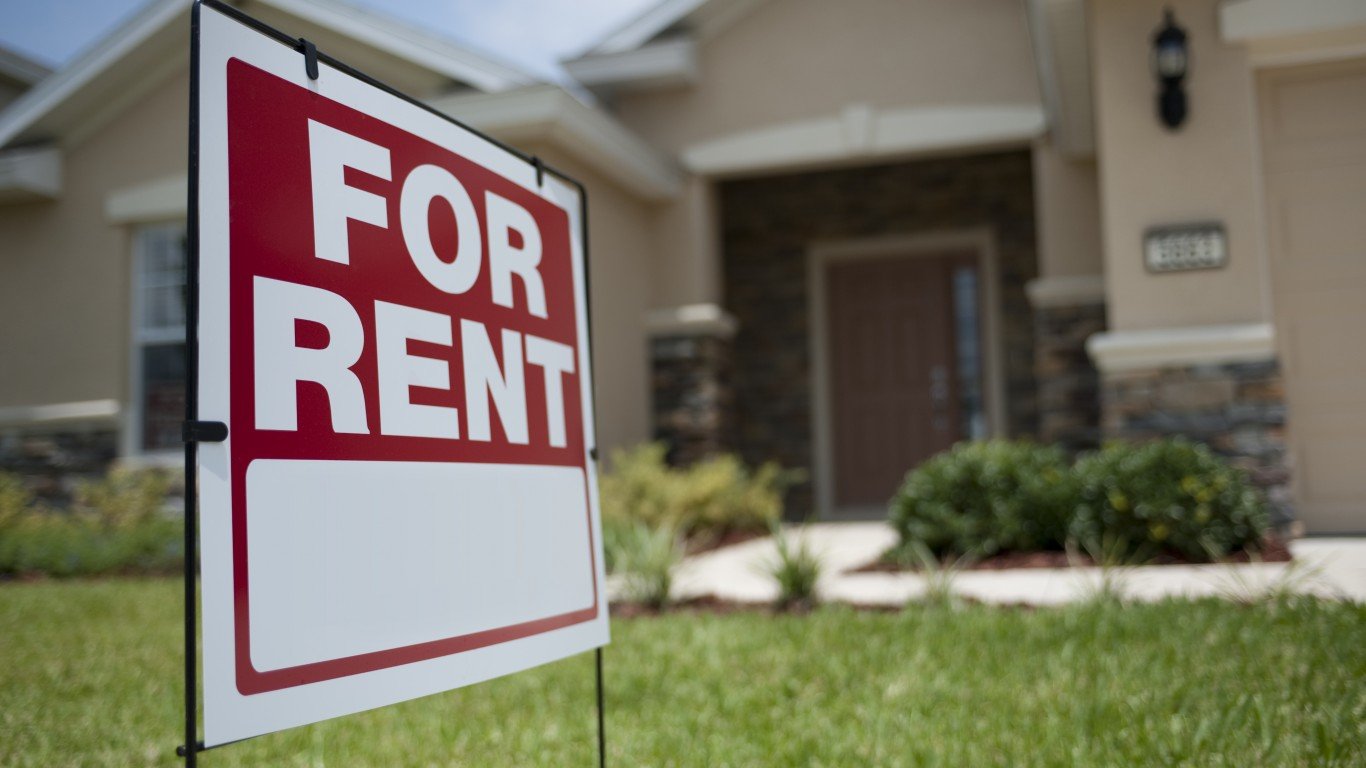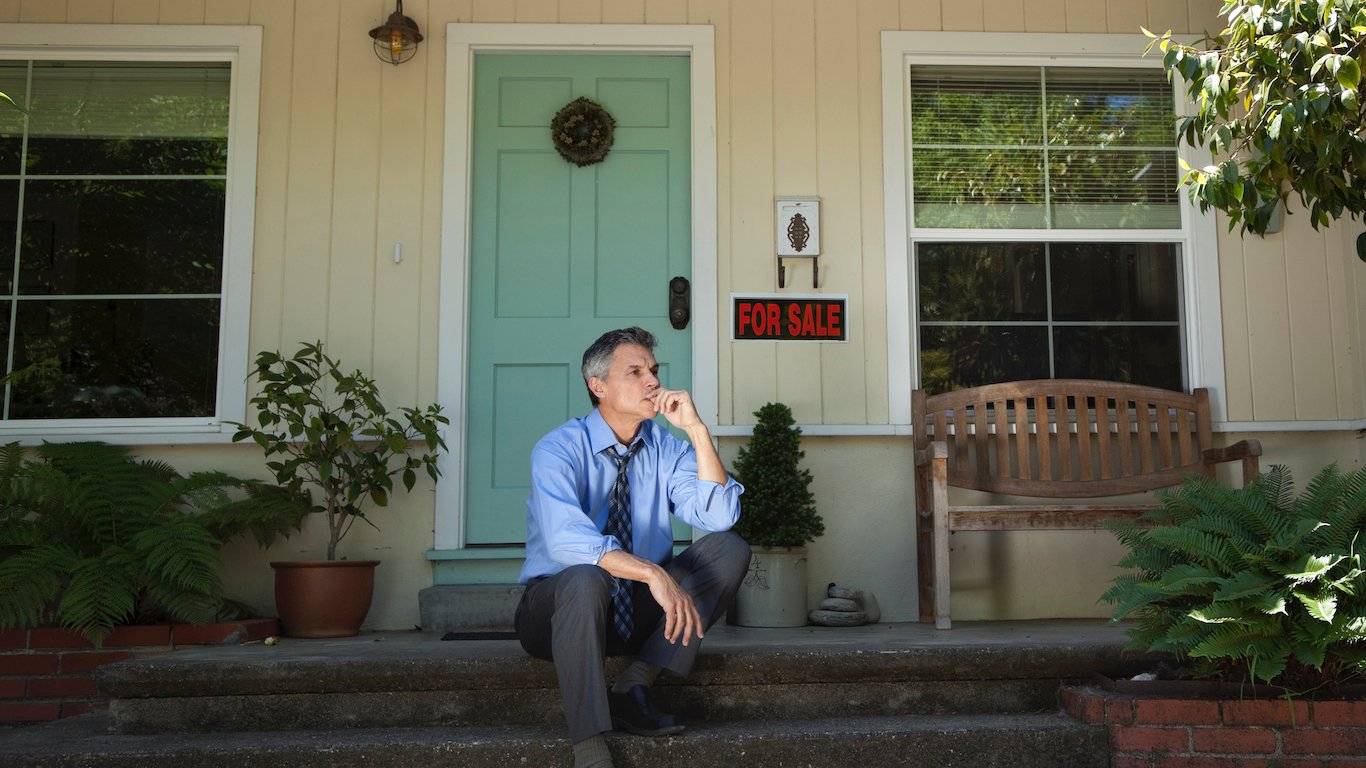
Most neighborhoods in America’s largest cities are becoming increasingly unaffordable to low-income renters, mostly Black residents, according to a recently published report by the National Equity Atlas, an organization that conducts research on racial and economic equity. The report found that prior to the pandemic, nearly half of Black renters were paying unaffordable rent. (Here are the most expensive cities to rent a home.)
According to the National Equity Atlas, in 2019, only 7% of neighborhoods in the nation’s 100 most populous metropolitan areas were affordable to median-income Black households. On the other hand, median-income white households could afford rent in 69% of the neighborhoods.
To identify the 25 major U.S. cities that are becoming more unaffordable to Black residents, 24/7 Wall St. reviewed National Equity Atlas’ report The Shrinking Geography of Opportunity in Metro America. The report calculated the percentage of neighborhoods (ZIP codes) in the 100 largest metropolitan areas that were affordable to low-income renters in 2013 and 2019. We ranked metro areas by the percentage point decline in the percentage of affordable neighborhoods between those years. A ZIP code was deemed affordable to low-income renters if it was affordable households making 80% of the local area median income. (Total population data came from the American Community Survey 2020 five-year estimates.)
Of course, not all Black households are low income, but low-income households are disproportionately people of color. It is also important to note that although no metro areas in California are listed, this is only because the decline in affordability in the state’s cities was not as sharp. In fact, in 2019, 10 out of California’s 11 largest metros had zero affordable housing for Black renters making 80% of the AMI.
While the metro areas with the sharpest decline in affordability are spread around the country, the majority are in the South and the Midwest – in some of the worst states for Black Americans.
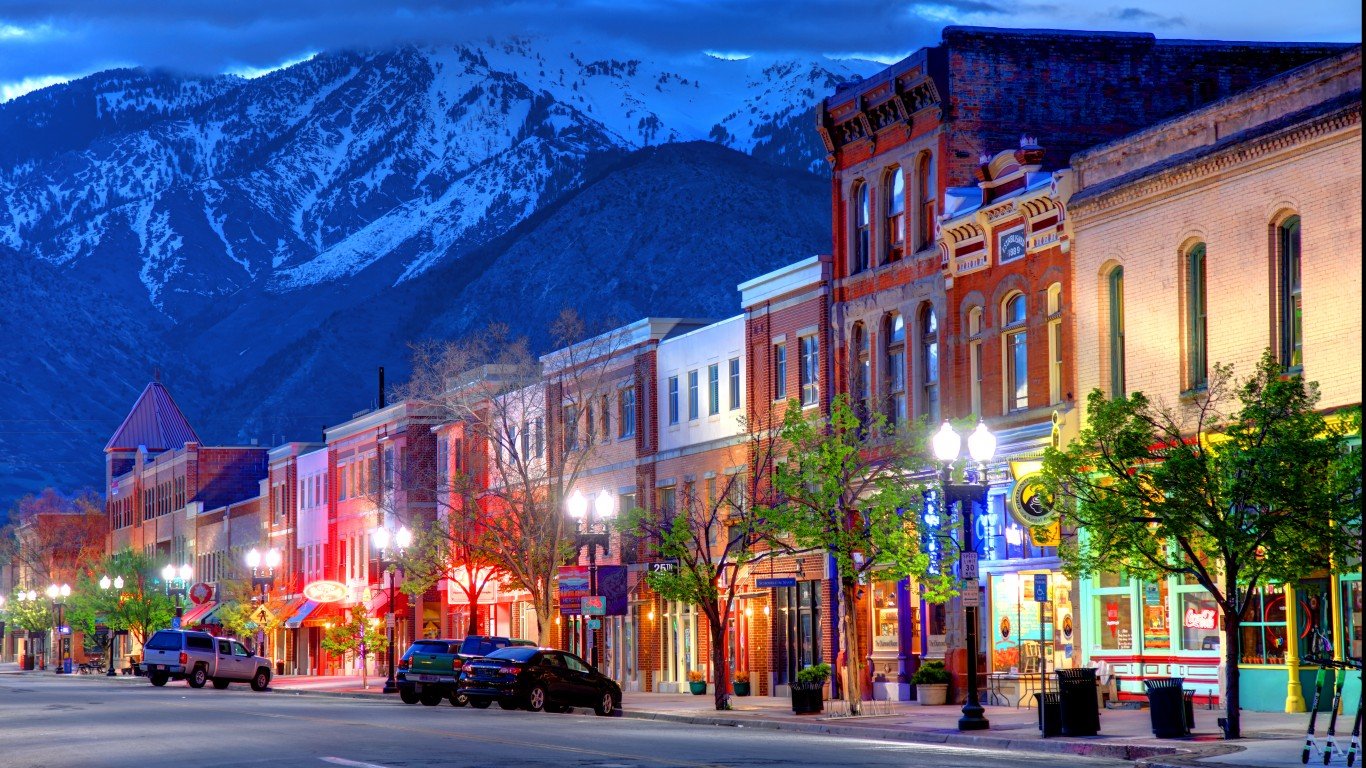
Between 2013 and 2019 – which was a period of economic recovery after the Great Recession – the number of neighborhoods where median market rents were affordable to low-income households declined 50% in the metro areas considered. During that period, affordability for Black households making 80% of AMI declined in 81 of these metro areas and increased in just three, while affordability for white households at the median income decreased in 52 metros and increased in 35. And in the years since 2019, market rents have only continued to increase.
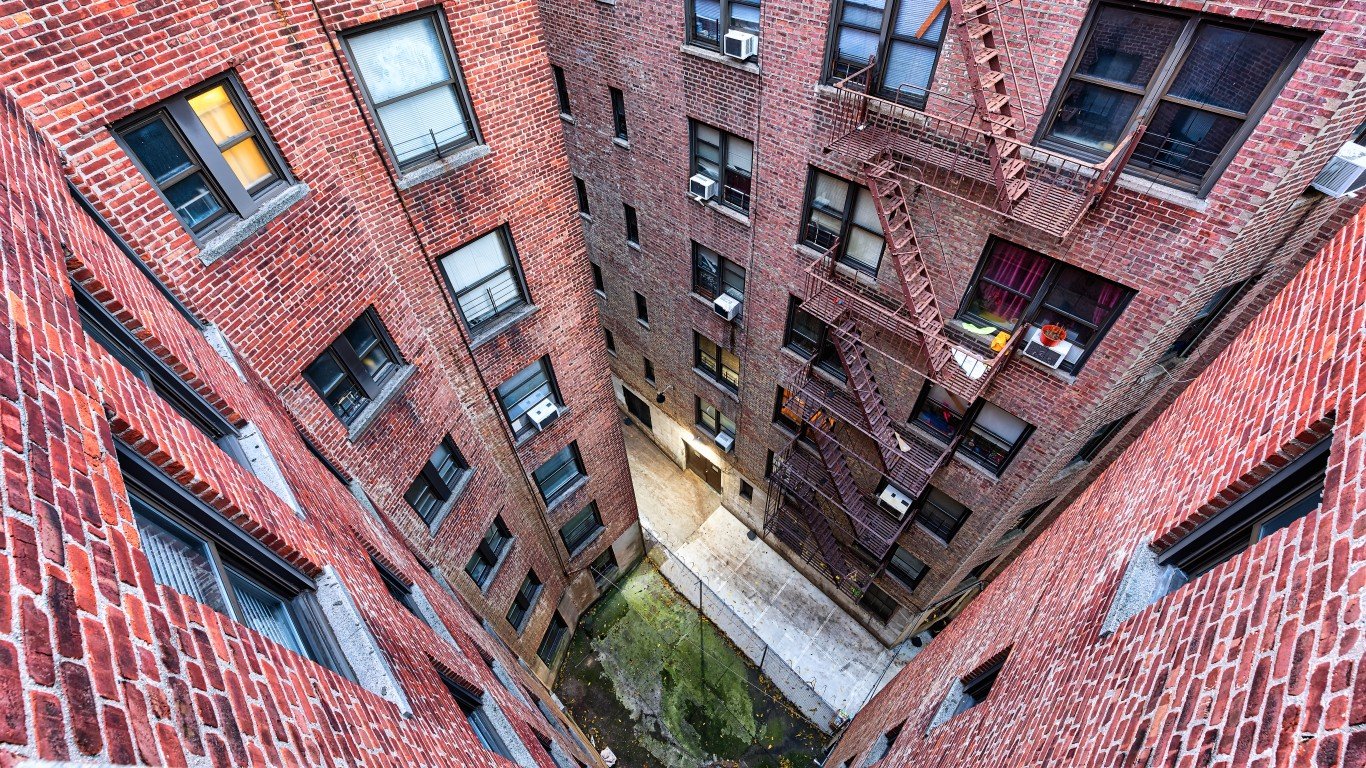
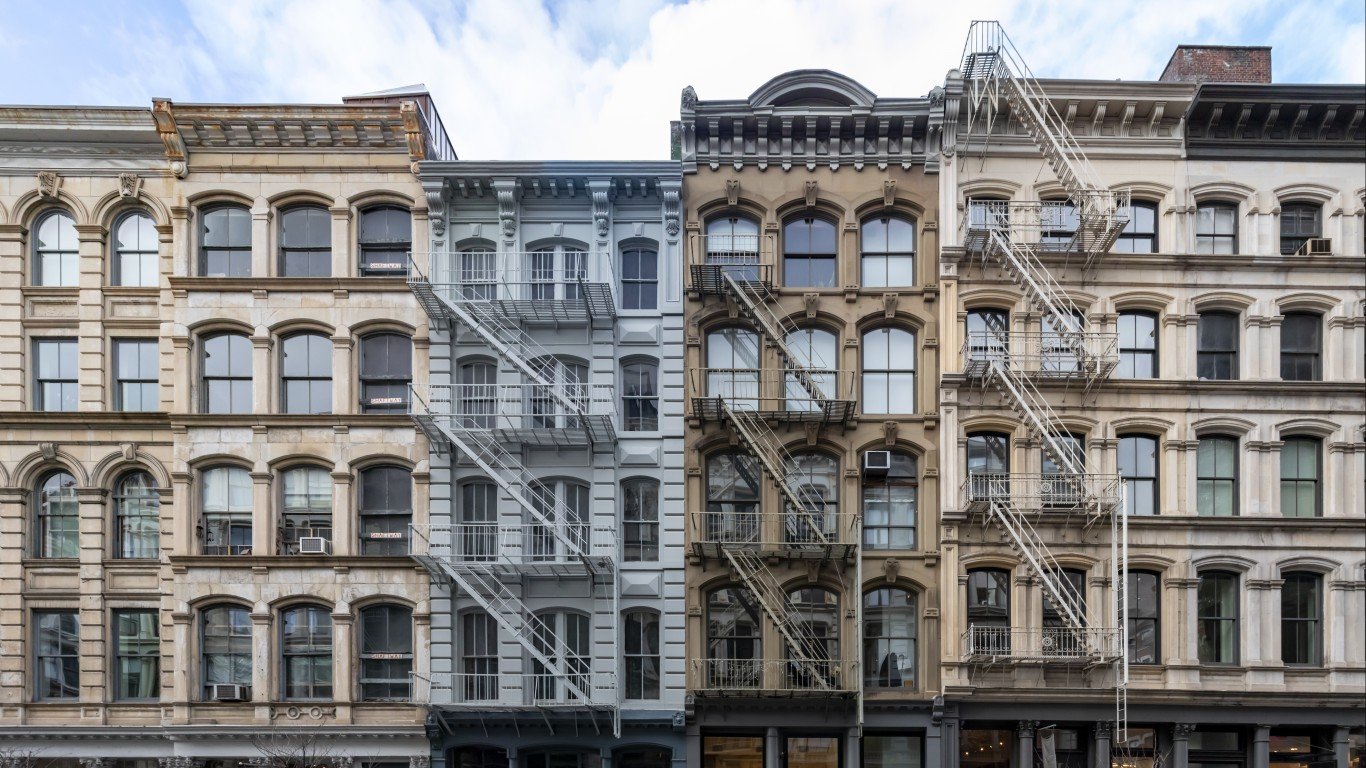
Not only do Black residents have limited housing options, but the majority of options that they do have are in low opportunity neighborhoods – disinvested areas that tend to lack quality schools, parks, clean air, functional public transit, and access to stores and jobs. Research shows that living in low opportunity areas can lead to significantly decreased chances of success, health problems, and limited economic mobility. And these neighborhoods are often rife with dangers including police violence, crumbling infrastructure, and toxic air. Here are 23 places where industrial air pollution is so bad it causes cancer.
The lack of affordable homes in high opportunity neighborhoods is no accident. It is the result of decades of racially discriminatory policies like redlining and exclusionary zoning that have disproportionately affected Black families. As Black residents continue to be priced out of metro areas, they will likely face increasingly poor chances of better health and success.
Click here to see US cities becoming more unaffordable for low-income Americans.

25. Augusta-Richmond County, GA-SC
> Change in the % of neighborhoods affordable to low-income renters: -15.0 ppt
> % of neighborhoods affordable to low-income renters in 2013: 55.0% — #2 out of 100 largest metros
> % of neighborhoods affordable to low-income renters in 2019: 40.0% — #5
> Affordable neighborhoods for black residents: 55.0% (2013), 50.0% (2019)
> Population: 605,303 — #92
[in-text-ad]

24. Minneapolis-St. Paul-Bloomington, MN-WI
> Change in the % of neighborhoods affordable to low-income renters: -15.0 ppt
> % of neighborhoods affordable to low-income renters in 2013: 16.6% — #44 out of 100 largest metros
> % of neighborhoods affordable to low-income renters in 2019: 1.6% — #56
> Affordable neighborhoods for black residents: 0.0% (2013), 0.0% (2019)
> Population: 3,605,450 — #16
[recirclink id=1048284]

23. Houston-Baytown-Sugar Land, TX
> Change in the % of neighborhoods affordable to low-income renters: -15.0 ppt
> % of neighborhoods affordable to low-income renters in 2013: 15.0% — #47 out of 100 largest metros
> % of neighborhoods affordable to low-income renters in 2019: 0.0% — #59
> Affordable neighborhoods for black residents: 8.0% (2013), 0.0% (2019)
> Population: 6,979,613 — #5

22. Birmingham-Hoover, AL
> Change in the % of neighborhoods affordable to low-income renters: -15.5 ppt
> % of neighborhoods affordable to low-income renters in 2013: 43.7% — #11 out of 100 largest metros
> % of neighborhoods affordable to low-income renters in 2019: 28.2% — #9
> Affordable neighborhoods for black residents: 34.0% (2013), 37.0% (2019)
> Population: 1,088,170 — #50
[in-text-ad-2]
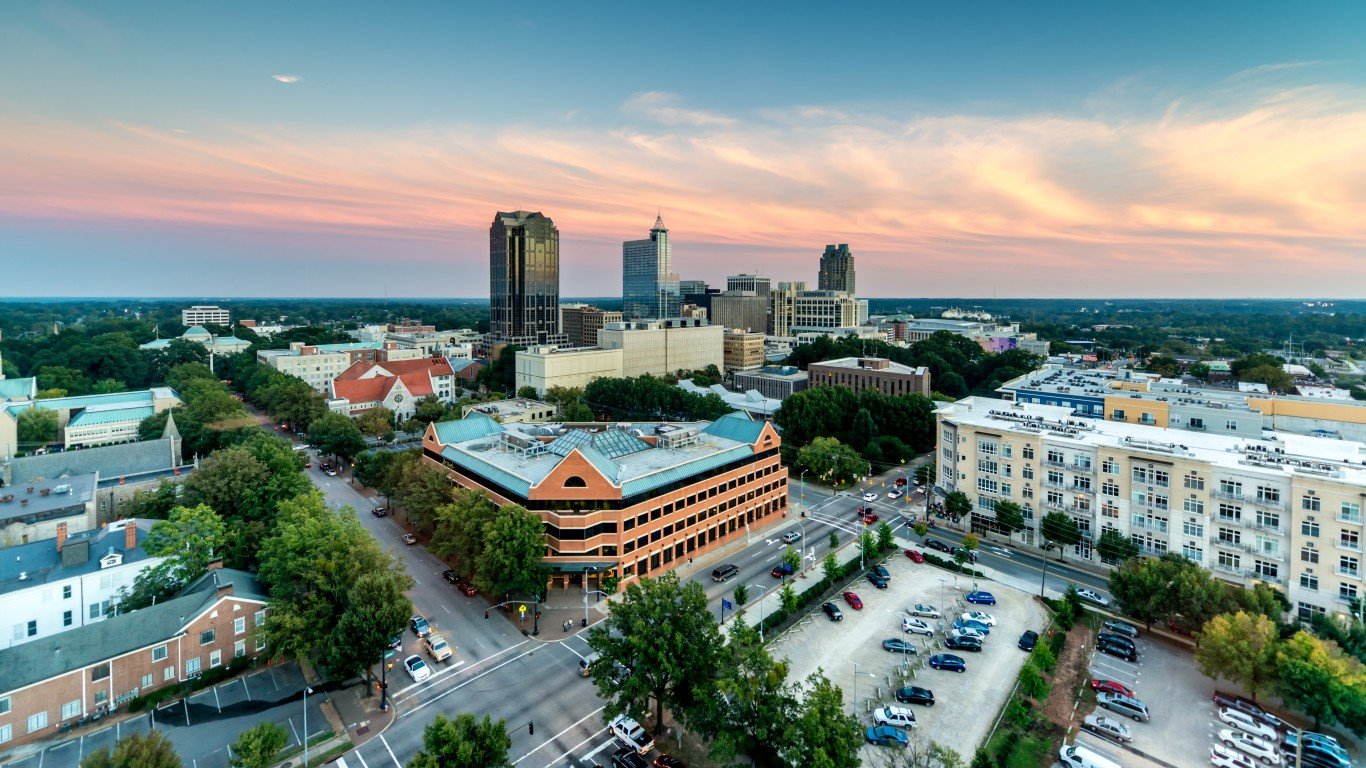
21. Raleigh-Cary, NC
> Change in the % of neighborhoods affordable to low-income renters: -16.3 ppt
> % of neighborhoods affordable to low-income renters in 2013: 37.2% — #17 out of 100 largest metros
> % of neighborhoods affordable to low-income renters in 2019: 20.9% — #16
> Affordable neighborhoods for black residents: 28.0% (2013), 21.0% (2019)
> Population: 1,362,997 — #42

20. Nashville-Davidson-Murfreesboro, TN
> Change in the % of neighborhoods affordable to low-income renters: -16.5 ppt
> % of neighborhoods affordable to low-income renters in 2013: 24.1% — #36 out of 100 largest metros
> % of neighborhoods affordable to low-income renters in 2019: 7.6% — #38
> Affordable neighborhoods for black residents: 6.0% (2013), 9.0% (2019)
> Population: 1,904,186 — #36
[in-text-ad]
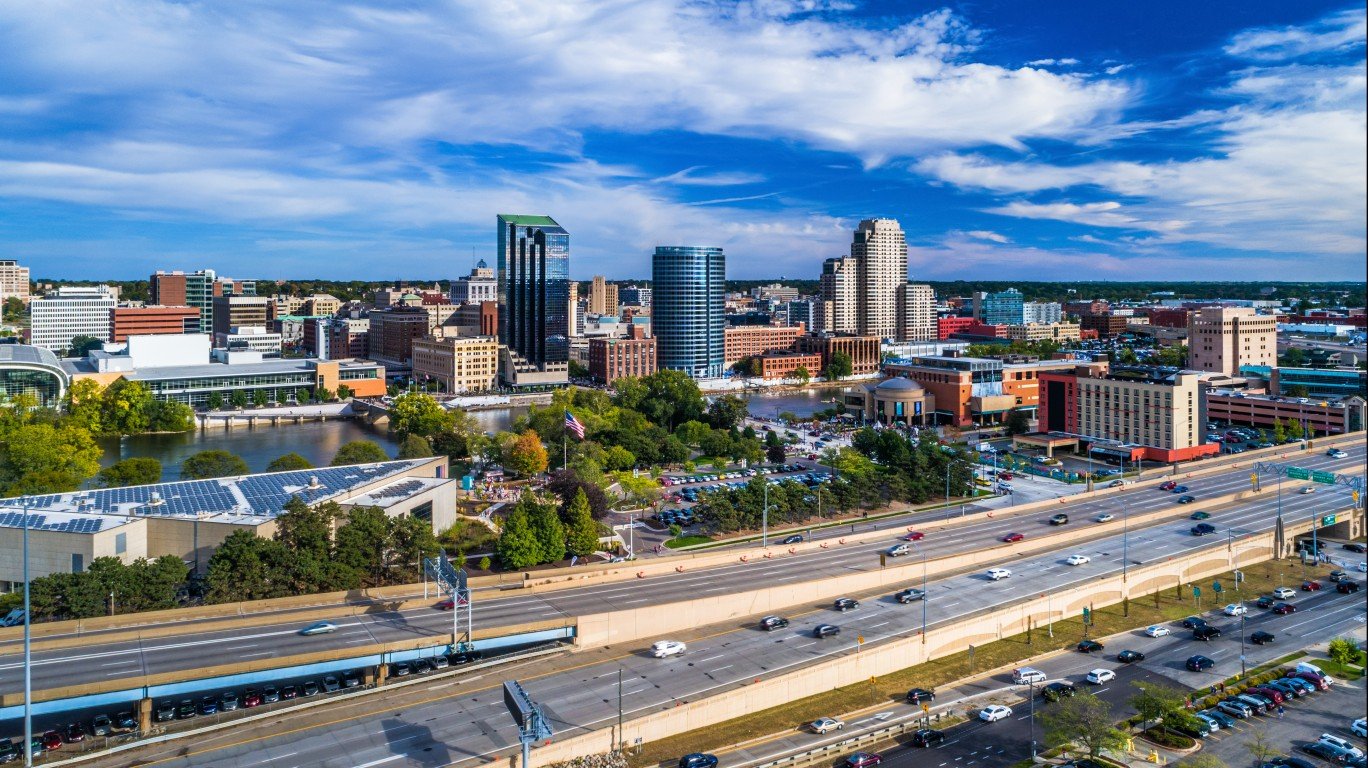
19. Grand Rapids-Wyoming, MI
> Change in the % of neighborhoods affordable to low-income renters: -17.1 ppt
> % of neighborhoods affordable to low-income renters in 2013: 36.6% — #18 out of 100 largest metros
> % of neighborhoods affordable to low-income renters in 2019: 19.5% — #18
> Affordable neighborhoods for black residents: 0.0% (2013), 2.0% (2019)
> Population: 1,069,696 — #52
[recirclink id=1085592]
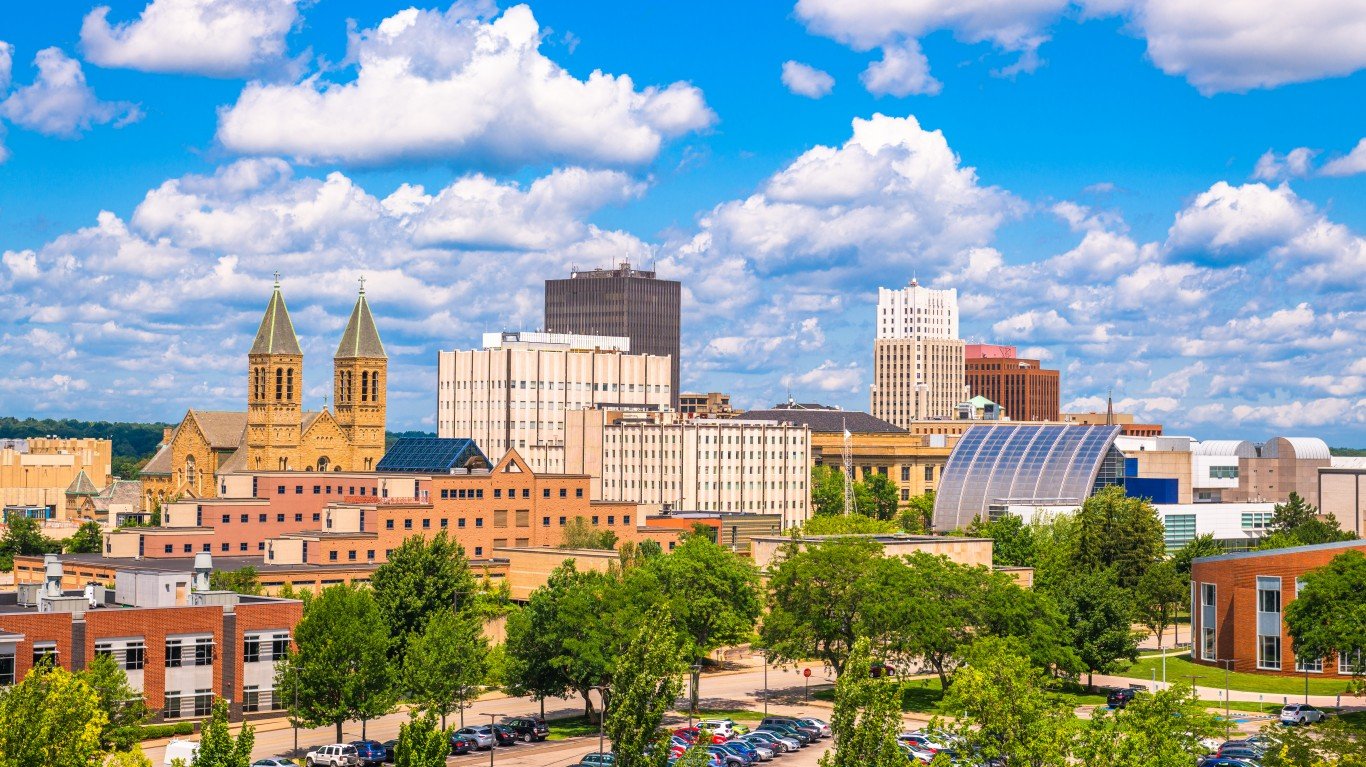
18. Akron, OH
> Change in the % of neighborhoods affordable to low-income renters: -18.2 ppt
> % of neighborhoods affordable to low-income renters in 2013: 47.7% — #6 out of 100 largest metros
> % of neighborhoods affordable to low-income renters in 2019: 29.5% — #7
> Affordable neighborhoods for black residents: 23.0% (2013), 14.0% (2019)
> Population: 703,286 — #82

17. Kansas City, MO-KS
> Change in the % of neighborhoods affordable to low-income renters: -18.7 ppt
> % of neighborhoods affordable to low-income renters in 2013: 47.5% — #7 out of 100 largest metros
> % of neighborhoods affordable to low-income renters in 2019: 28.8% — #8
> Affordable neighborhoods for black residents: 17.0% (2013), 21.0% (2019)
> Population: 2,144,129 — #31
[in-text-ad-2]

16. Dallas-Fort Worth-Arlington, TX
> Change in the % of neighborhoods affordable to low-income renters: -19.1 ppt
> % of neighborhoods affordable to low-income renters in 2013: 22.0% — #38 out of 100 largest metros
> % of neighborhoods affordable to low-income renters in 2019: 2.9% — #52
> Affordable neighborhoods for black residents: 11.0% (2013), 4.0% (2019)
> Population: 7,451,858 — #4
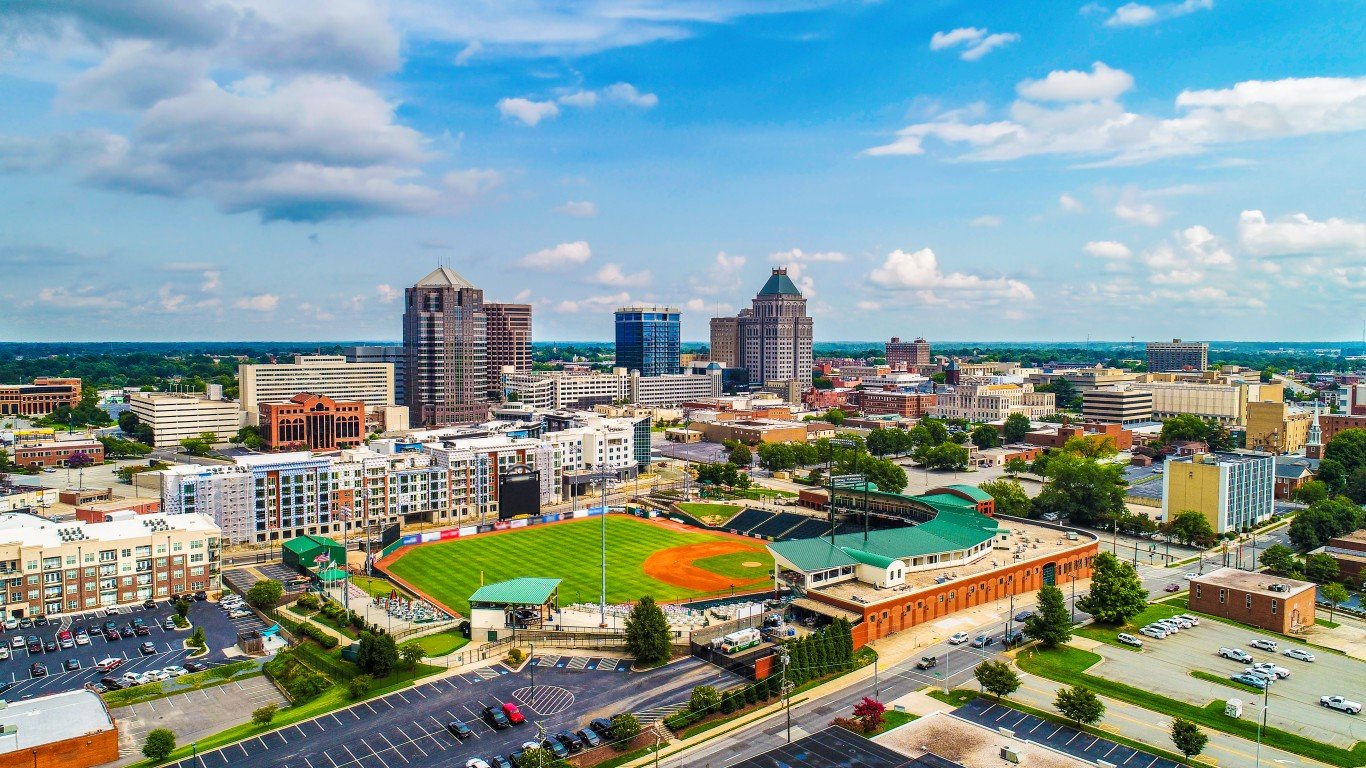
15. Greensboro-High Point, NC
> Change in the % of neighborhoods affordable to low-income renters: -20.6 ppt
> % of neighborhoods affordable to low-income renters in 2013: 38.2% — #14 out of 100 largest metros
> % of neighborhoods affordable to low-income renters in 2019: 17.6% — #22
> Affordable neighborhoods for black residents: 38.0% (2013), 26.0% (2019)
> Population: 767,467 — #75
[in-text-ad]

14. Charlotte-Gastonia-Concord, NC-SC
> Change in the % of neighborhoods affordable to low-income renters: -21.4 ppt
> % of neighborhoods affordable to low-income renters in 2013: 34.3% — #20 out of 100 largest metros
> % of neighborhoods affordable to low-income renters in 2019: 12.9% — #32
> Affordable neighborhoods for black residents: 23.0% (2013), 17.0% (2019)
> Population: 2,595,027 — #22
[recirclink id=967245]
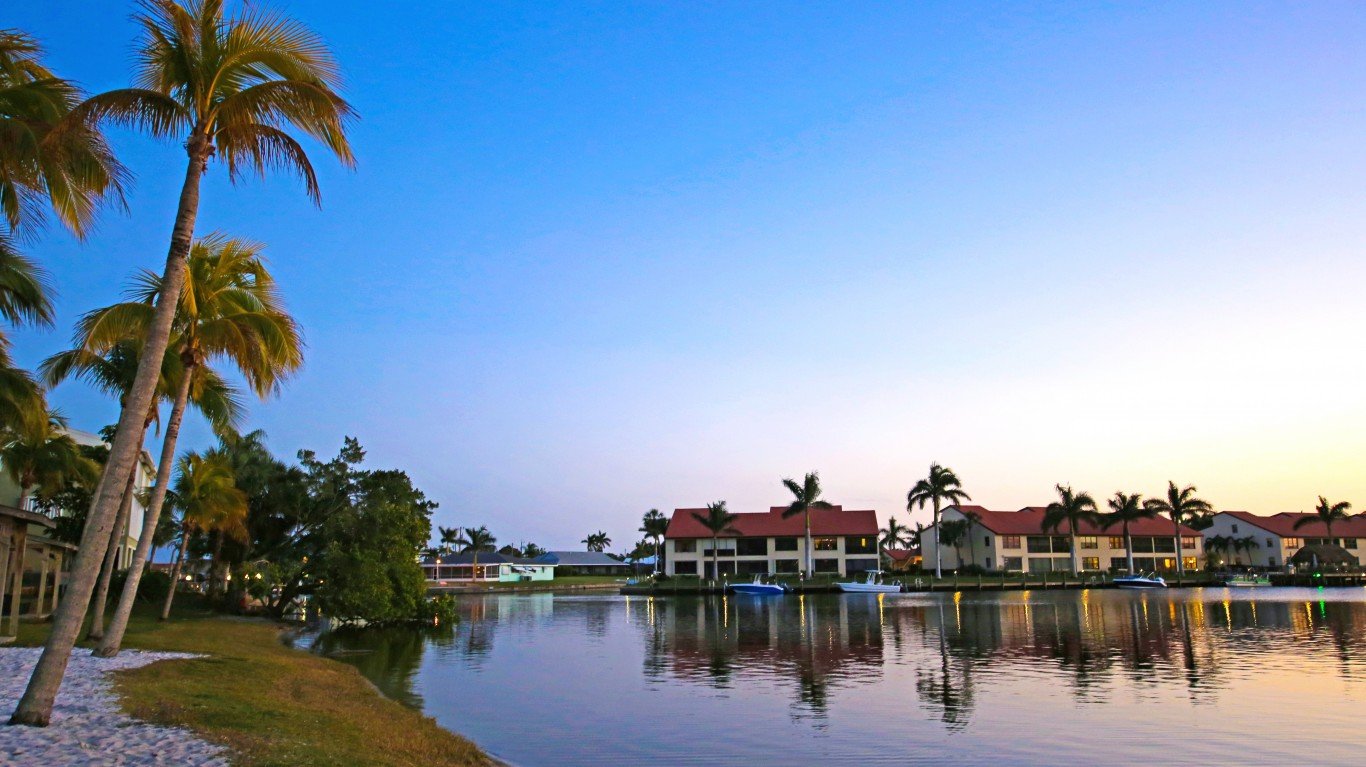
13. Cape Coral-Fort Myers, FL
> Change in the % of neighborhoods affordable to low-income renters: -21.9 ppt
> % of neighborhoods affordable to low-income renters in 2013: 21.9% — #39 out of 100 largest metros
> % of neighborhoods affordable to low-income renters in 2019: 0.0% — #59
> Affordable neighborhoods for black residents: 3.0% (2013), 0.0% (2019)
> Population: 756,570 — #76
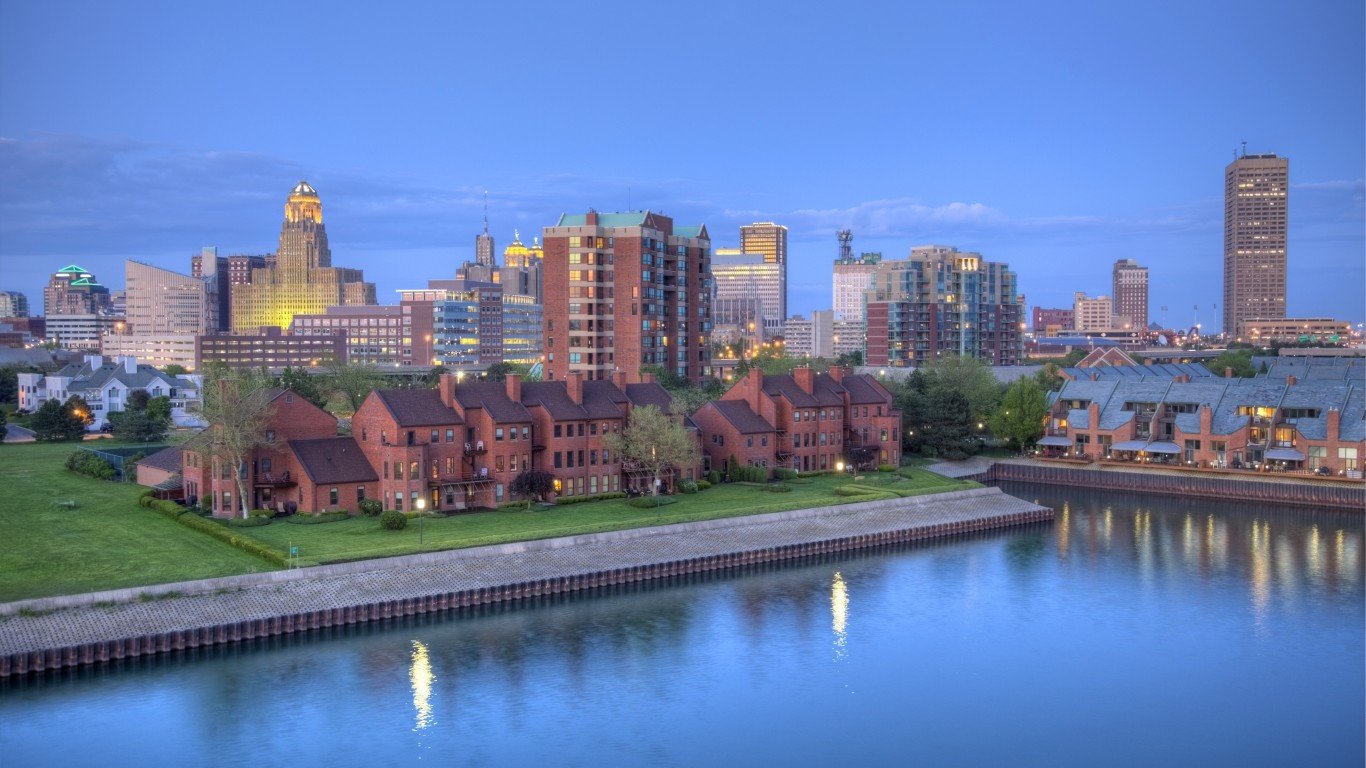
11. Buffalo-Niagara Falls, NY
> Change in the % of neighborhoods affordable to low-income renters: -22.9 ppt
> % of neighborhoods affordable to low-income renters in 2013: 38.6% — #13 out of 100 largest metros
> % of neighborhoods affordable to low-income renters in 2019: 15.7% — #26
> Affordable neighborhoods for black residents: 0.0% (2013), 3.0% (2019)
> Population: 1,129,018 — #49
[in-text-ad-2]

11. Harrisburg-Carlisle, PA
> Change in the % of neighborhoods affordable to low-income renters: -22.9 ppt
> % of neighborhoods affordable to low-income renters in 2013: 34.3% — #20 out of 100 largest metros
> % of neighborhoods affordable to low-income renters in 2019: 11.4% — #33
> Affordable neighborhoods for black residents: 20.0% (2013), 6.0% (2019)
> Population: 574,691 — #95

10. Phoenix-Mesa-Scottsdale, AZ
> Change in the % of neighborhoods affordable to low-income renters: -26.1 ppt
> % of neighborhoods affordable to low-income renters in 2013: 30.4% — #27 out of 100 largest metros
> % of neighborhoods affordable to low-income renters in 2019: 4.3% — #49
> Affordable neighborhoods for black residents: 17.0% (2013), 4.0% (2019)
> Population: 4,860,338 — #10
[in-text-ad]

9. Louisville, KY-IN
> Change in the % of neighborhoods affordable to low-income renters: -28.6 ppt
> % of neighborhoods affordable to low-income renters in 2013: 42.9% — #12 out of 100 largest metros
> % of neighborhoods affordable to low-income renters in 2019: 14.3% — #30
> Affordable neighborhoods for black residents: 2.0% (2013), 8.0% (2019)
> Population: 1,262,287 — #46
[recirclink id=1126490]

8. San Antonio, TX
> Change in the % of neighborhoods affordable to low-income renters: -28.7 ppt
> % of neighborhoods affordable to low-income renters in 2013: 28.7% — #29 out of 100 largest metros
> % of neighborhoods affordable to low-income renters in 2019: 0.0% — #59
> Affordable neighborhoods for black residents: 43.0% (2013), 34.0% (2019)
> Population: 2,510,211 — #24
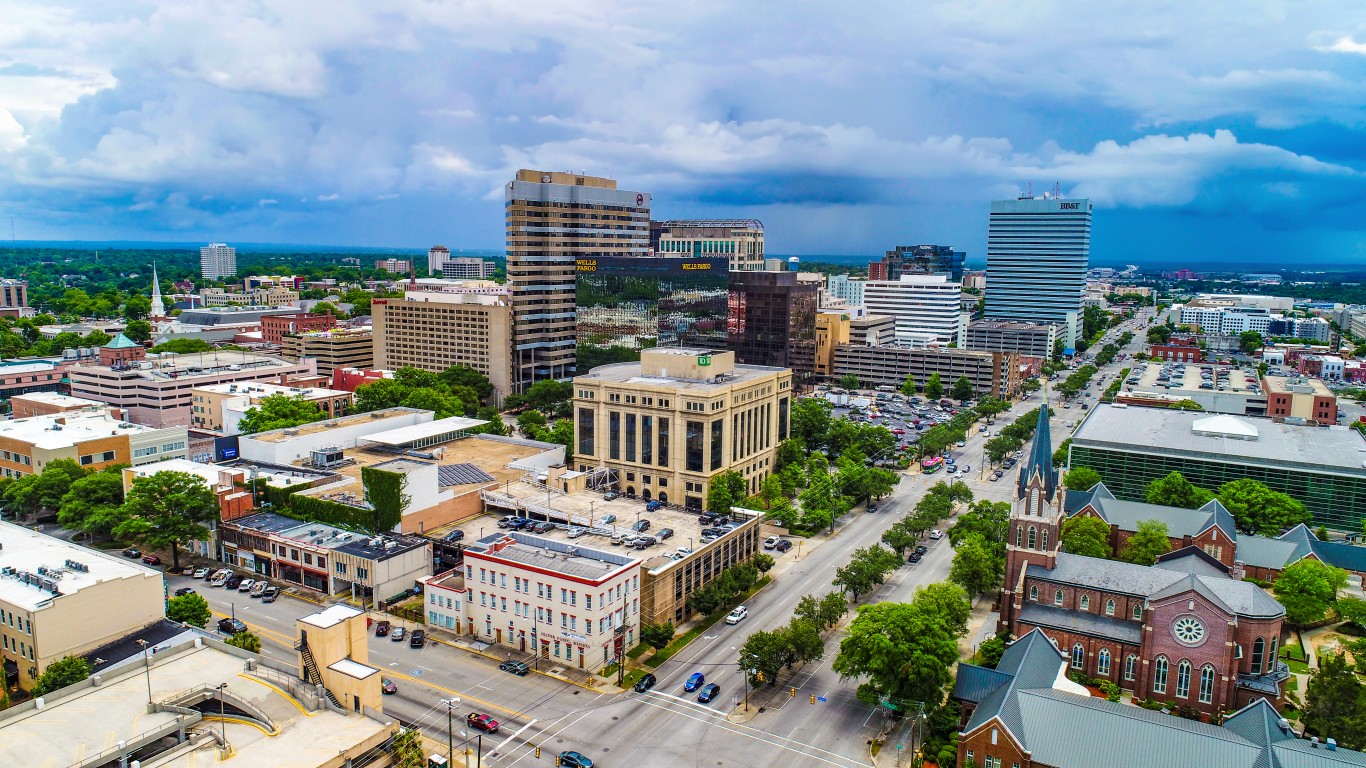
7. Columbia, SC
> Change in the % of neighborhoods affordable to low-income renters: -29.4 ppt
> % of neighborhoods affordable to low-income renters in 2013: 38.2% — #14 out of 100 largest metros
> % of neighborhoods affordable to low-income renters in 2019: 8.8% — #36
> Affordable neighborhoods for black residents: 29.0% (2013), 26.0% (2019)
> Population: 832,925 — #71
[in-text-ad-2]

6. Cincinnati-Middletown, OH-KY-IN
> Change in the % of neighborhoods affordable to low-income renters: -30.6 ppt
> % of neighborhoods affordable to low-income renters in 2013: 45.9% — #10 out of 100 largest metros
> % of neighborhoods affordable to low-income renters in 2019: 15.3% — #27
> Affordable neighborhoods for black residents: 0.0% (2013), 0.0% (2019)
> Population: 2,214,265 — #29
5. Ogden-Clearfield, UT
> Change in the % of neighborhoods affordable to low-income renters: -31.6 ppt
> % of neighborhoods affordable to low-income renters in 2013: 31.6% — #24 out of 100 largest metros
> % of neighborhoods affordable to low-income renters in 2019: 0.0% — #59
> Affordable neighborhoods for black residents: 11.0% (2013), 0.0% (2019)
> Population: 672,948 — #86
[in-text-ad]

4. Lancaster, PA
> Change in the % of neighborhoods affordable to low-income renters: -33.3 ppt
> % of neighborhoods affordable to low-income renters in 2013: 33.3% — #22 out of 100 largest metros
> % of neighborhoods affordable to low-income renters in 2019: 0.0% — #59
> Affordable neighborhoods for black residents: 15.0% (2013), 0.0% (2019)
> Population: 543,050 — #99
[recirclink id=1119264]

3. Atlanta-Sandy Springs-Marietta, GA
> Change in the % of neighborhoods affordable to low-income renters: -36.4 ppt
> % of neighborhoods affordable to low-income renters in 2013: 47.1% — #9 out of 100 largest metros
> % of neighborhoods affordable to low-income renters in 2019: 10.7% — #34
> Affordable neighborhoods for black residents: 37.0% (2013), 30.0% (2019)
> Population: 5,947,008 — #9

2. Youngstown-Warren-Boardman, OH-PA
> Change in the % of neighborhoods affordable to low-income renters: -37.2 ppt
> % of neighborhoods affordable to low-income renters in 2013: 69.8% — #1 out of 100 largest metros
> % of neighborhoods affordable to low-income renters in 2019: 32.6% — #6
> Affordable neighborhoods for black residents: 21.0% (2013), 9.0% (2019)
> Population: 538,115 — #100
[in-text-ad-2]

1. Boise City-Nampa, ID
> Change in the % of neighborhoods affordable to low-income renters: -48.1 ppt
> % of neighborhoods affordable to low-income renters in 2013: 48.1% — #5 out of 100 largest metros
> % of neighborhoods affordable to low-income renters in 2019: 0.0% — #59
> Affordable neighborhoods for black residents: 0.0% (2013), 0.0% (2019)
> Population: 730,483 — #80
Contact [email protected] for any questions or corrections.