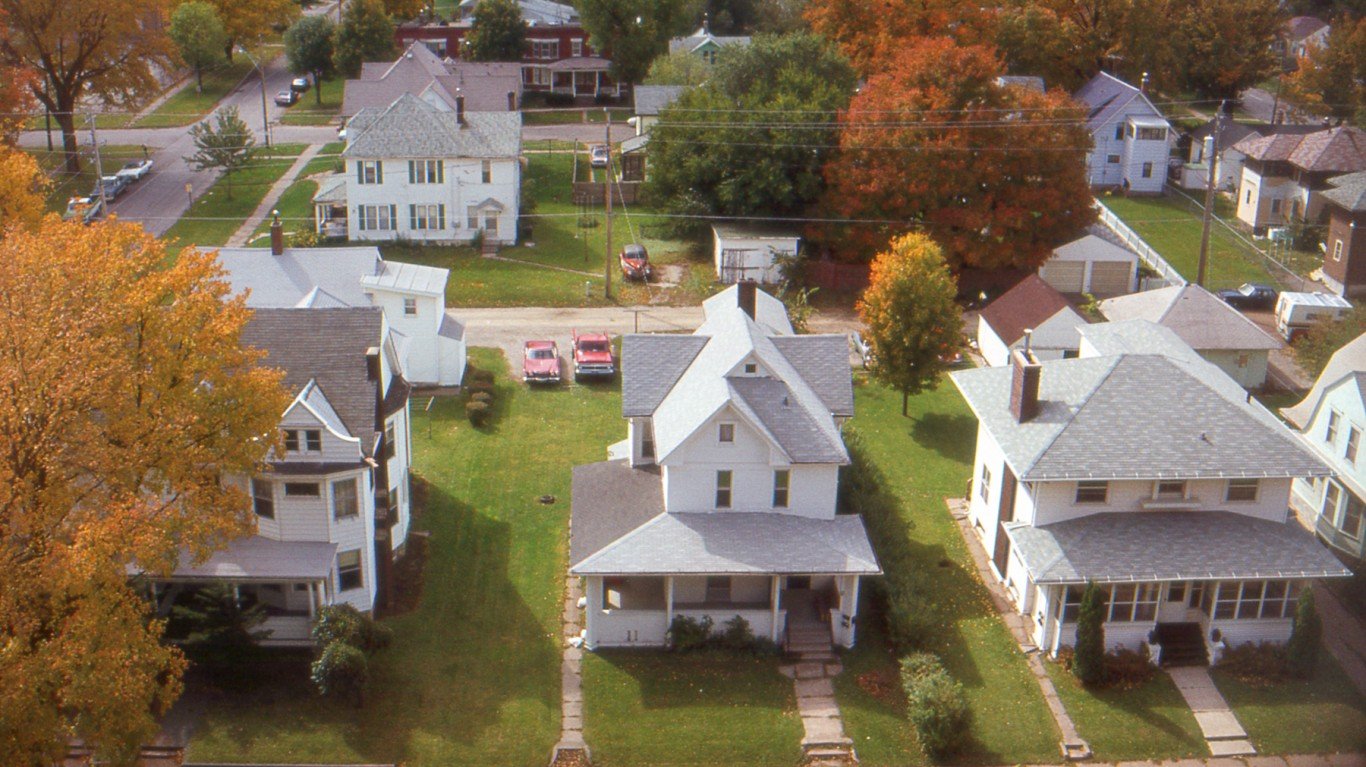
Median rents have hit record highs across the country, thanks to inflation and pandemic-related shortages of housing and building supplies. In many parts of the country, people who choose to rent may find it difficult to meet conventional wisdom’s rule that monthly rent should not exceed 30% of one’s monthly income. While rent prices are much more affordable in some parts of the country, in the majority of states there is at least one county where rents are especially high.
To find the county with the highest rent in every state, 24/7 Wall St. reviewed five-year estimates of median gross rent of counties and county equivalents from the U.S. Census Bureau’s 2020 American Community Survey. It is important to note that the figures reflected here are for 2020, the most recent data available through the census. While prices today are much higher across much of the country, the most expensive rental market in each state in 2020 is likely still one of the most expensive markets in 2022. The national 2020 median rent was $1,096. In 38 of the 50 states, there is at least one county with a higher 2020 median gross rent.
Housing costs reflect the income levels of the population living there. Housing costs tend to be more expensive in wealthier communities. Of the 50 counties on this list, 48 have higher typical household incomes compared to their home state. California’s San Mateo County, which has both the highest median gross rent in California as well as the country as a whole, has a median household income of $128,088, compared to the U.S. value of $10,674. This is the richest town in every state.
As a result of those higher incomes, most of the counties or county equivalents on this list were actually relatively affordable in 2020. Nationwide, 2020 median gross rent comes to 29.6% of household income. In 37 of the counties with the most expensive rent in each state, that figure is lower. In the Aleutians West Census Area, which is treated as a county by the census, 2020 median gross rent is equal to just 19.1% of income. 2022 rents have risen considerably, so this figure has almost certainly increased in many of these metro areas in the past two years. These are the U.S. cities where the most families need food stamps.
Click here to see the county with the highest rent in every state
Click here to see our detailed methodology

Alabama: Shelby County
> Median monthly rental cost: $1,078 (Alabama: $811)
> Share of income typically spent on rent: 26.2% (Alabama: 28.8%)
> Rental occupied housing units: 19.6% (Alabama: 30.8%)
> Median home value: $220,700 (Alabama: $149,600)
> No. of counties considered in ranking: 65
[in-text-ad]
Alaska: Aleutians West Census Area
> Median monthly rental cost: $1,476 (Alaska: $1,240)
> Share of income typically spent on rent: 19.1% (Alaska: 27.5%)
> Rental occupied housing units: 72.3% (Alaska: 35.2%)
> Median home value: $316,700 (Alaska: $275,600)
> No. of counties considered in ranking: 17
[recirclink id=1090849]

Arizona: Coconino County
> Median monthly rental cost: $1,185 (Arizona: $1,097)
> Share of income typically spent on rent: 31.5% (Arizona: 29.0%)
> Rental occupied housing units: 39.2% (Arizona: 34.7%)
> Median home value: $299,100 (Arizona: $242,000)
> No. of counties considered in ranking: 15

Arkansas: Benton County
> Median monthly rental cost: $945 (Arkansas: $760)
> Share of income typically spent on rent: 22.9% (Arkansas: 27.2%)
> Rental occupied housing units: 34.1% (Arkansas: 34.2%)
> Median home value: $192,900 (Arkansas: $133,600)
> No. of counties considered in ranking: 73
[in-text-ad-2]

California: San Mateo County
> Median monthly rental cost: $2,435 (California: $1,586)
> Share of income typically spent on rent: 29.2% (California: 32.2%)
> Rental occupied housing units: 40.1% (California: 44.7%)
> Median home value: $1,163,100 (California: $538,500)
> No. of counties considered in ranking: 56

Colorado: Douglas County
> Median monthly rental cost: $1,749 (Colorado: $1,335)
> Share of income typically spent on rent: 29.0% (Colorado: 30.6%)
> Rental occupied housing units: 20.8% (Colorado: 33.8%)
> Median home value: $493,500 (Colorado: $369,900)
> No. of counties considered in ranking: 49
[in-text-ad]

Connecticut: Fairfield County
> Median monthly rental cost: $1,511 (Connecticut: $1,201)
> Share of income typically spent on rent: 32.2% (Connecticut: 30.8%)
> Rental occupied housing units: 33.3% (Connecticut: 33.9%)
> Median home value: $433,000 (Connecticut: $279,700)
> No. of counties considered in ranking: 8
[recirclink id=1090988]
Delaware: New Castle County
> Median monthly rental cost: $1,182 (Delaware: $1,150)
> Share of income typically spent on rent: 28.5% (Delaware: 29.7%)
> Rental occupied housing units: 32.1% (Delaware: 28.6%)
> Median home value: $266,500 (Delaware: $258,300)
> No. of counties considered in ranking: 3

Florida: Monroe County
> Median monthly rental cost: $1,714 (Florida: $1,218)
> Share of income typically spent on rent: 34.1% (Florida: 33.3%)
> Rental occupied housing units: 40.9% (Florida: 33.8%)
> Median home value: $558,100 (Florida: $232,000)
> No. of counties considered in ranking: 67
[in-text-ad-2]

Georgia: Forsyth County
> Median monthly rental cost: $1,432 (Georgia: $1,042)
> Share of income typically spent on rent: 27.9% (Georgia: 29.6%)
> Rental occupied housing units: 15.8% (Georgia: 36.0%)
> Median home value: $362,300 (Georgia: $190,200)
> No. of counties considered in ranking: 146

Hawaii: Honolulu County
> Median monthly rental cost: $1,779 (Hawaii: $1,651)
> Share of income typically spent on rent: 33.4% (Hawaii: 32.5%)
> Rental occupied housing units: 42.5% (Hawaii: 39.7%)
> Median home value: $702,300 (Hawaii: $636,400)
> No. of counties considered in ranking: 4
[in-text-ad]

Idaho: Ada County
> Median monthly rental cost: $1,062 (Idaho: $887)
> Share of income typically spent on rent: 27.7% (Idaho: 27.9%)
> Rental occupied housing units: 29.8% (Idaho: 29.2%)
> Median home value: $298,600 (Idaho: $235,600)
> No. of counties considered in ranking: 35
[recirclink id=1094298]

Illinois: Kendall County
> Median monthly rental cost: $1,487 (Illinois: $1,038)
> Share of income typically spent on rent: 29.2% (Illinois: 28.7%)
> Rental occupied housing units: 16.5% (Illinois: 33.7%)
> Median home value: $243,700 (Illinois: $202,100)
> No. of counties considered in ranking: 95

Indiana: Hamilton County
> Median monthly rental cost: $1,188 (Indiana: $844)
> Share of income typically spent on rent: 25.2% (Indiana: 28.3%)
> Rental occupied housing units: 23.3% (Indiana: 30.5%)
> Median home value: $282,700 (Indiana: $148,900)
> No. of counties considered in ranking: 91
[in-text-ad-2]

Iowa: Dallas County
> Median monthly rental cost: $1,064 (Iowa: $806)
> Share of income typically spent on rent: 24.1% (Iowa: 26.7%)
> Rental occupied housing units: 27.8% (Iowa: 28.8%)
> Median home value: $258,300 (Iowa: $153,900)
> No. of counties considered in ranking: 94

Kansas: Johnson County
> Median monthly rental cost: $1,147 (Kansas: $863)
> Share of income typically spent on rent: 25.9% (Kansas: 27.0%)
> Rental occupied housing units: 31.0% (Kansas: 33.8%)
> Median home value: $277,500 (Kansas: $157,600)
> No. of counties considered in ranking: 66
[in-text-ad]
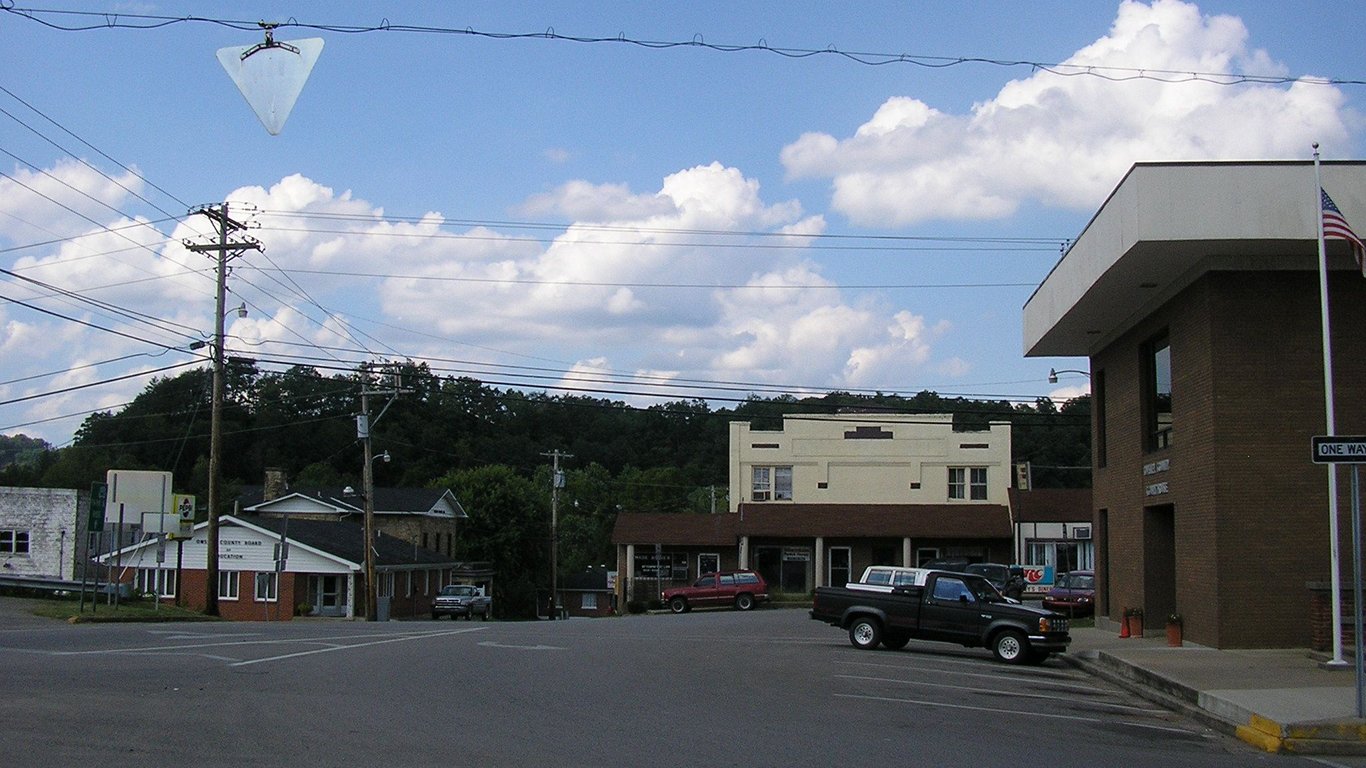
Kentucky: Boone County
> Median monthly rental cost: $1,029 (Kentucky: $783)
> Share of income typically spent on rent: 25.8% (Kentucky: 27.1%)
> Rental occupied housing units: 24.1% (Kentucky: 32.4%)
> Median home value: $194,700 (Kentucky: $147,100)
> No. of counties considered in ranking: 113
[recirclink id=1101677]
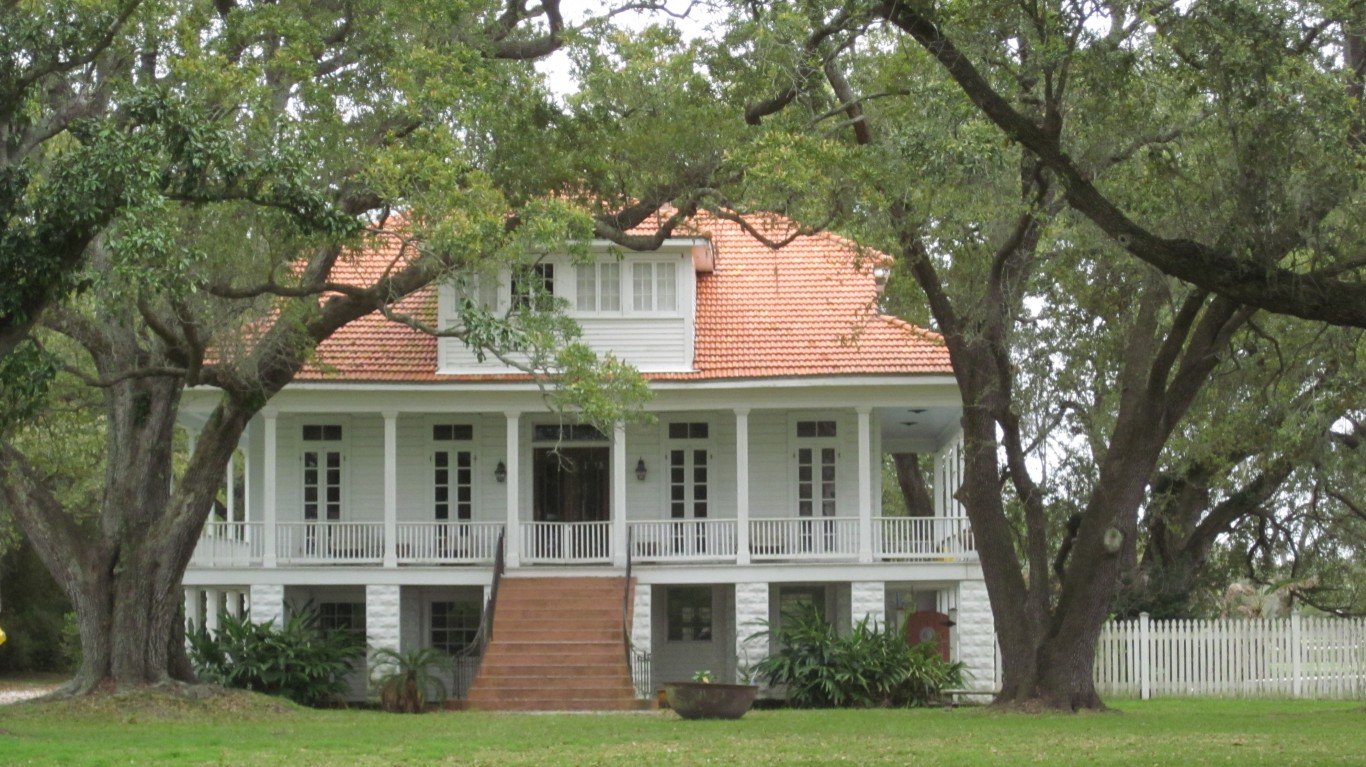
Louisiana: Plaquemines Parish
> Median monthly rental cost: $1,312 (Louisiana: $876)
> Share of income typically spent on rent: 29.6% (Louisiana: 32.3%)
> Rental occupied housing units: 27.0% (Louisiana: 33.4%)
> Median home value: $202,700 (Louisiana: $168,100)
> No. of counties considered in ranking: 62

Maine: Cumberland County
> Median monthly rental cost: $1,193 (Maine: $873)
> Share of income typically spent on rent: 28.9% (Maine: 28.6%)
> Rental occupied housing units: 30.0% (Maine: 27.1%)
> Median home value: $288,800 (Maine: $198,000)
> No. of counties considered in ranking: 16
[in-text-ad-2]

Maryland: Montgomery County
> Median monthly rental cost: $1,784 (Maryland: $1,415)
> Share of income typically spent on rent: 30.2% (Maryland: 29.7%)
> Rental occupied housing units: 34.4% (Maryland: 32.9%)
> Median home value: $491,700 (Maryland: $325,400)
> No. of counties considered in ranking: 24

Massachusetts: Nantucket County
> Median monthly rental cost: $1,781 (Massachusetts: $1,336)
> Share of income typically spent on rent: 27.6% (Massachusetts: 29.6%)
> Rental occupied housing units: 30.9% (Massachusetts: 37.5%)
> Median home value: $1,117,300 (Massachusetts: $398,800)
> No. of counties considered in ranking: 14
[in-text-ad]
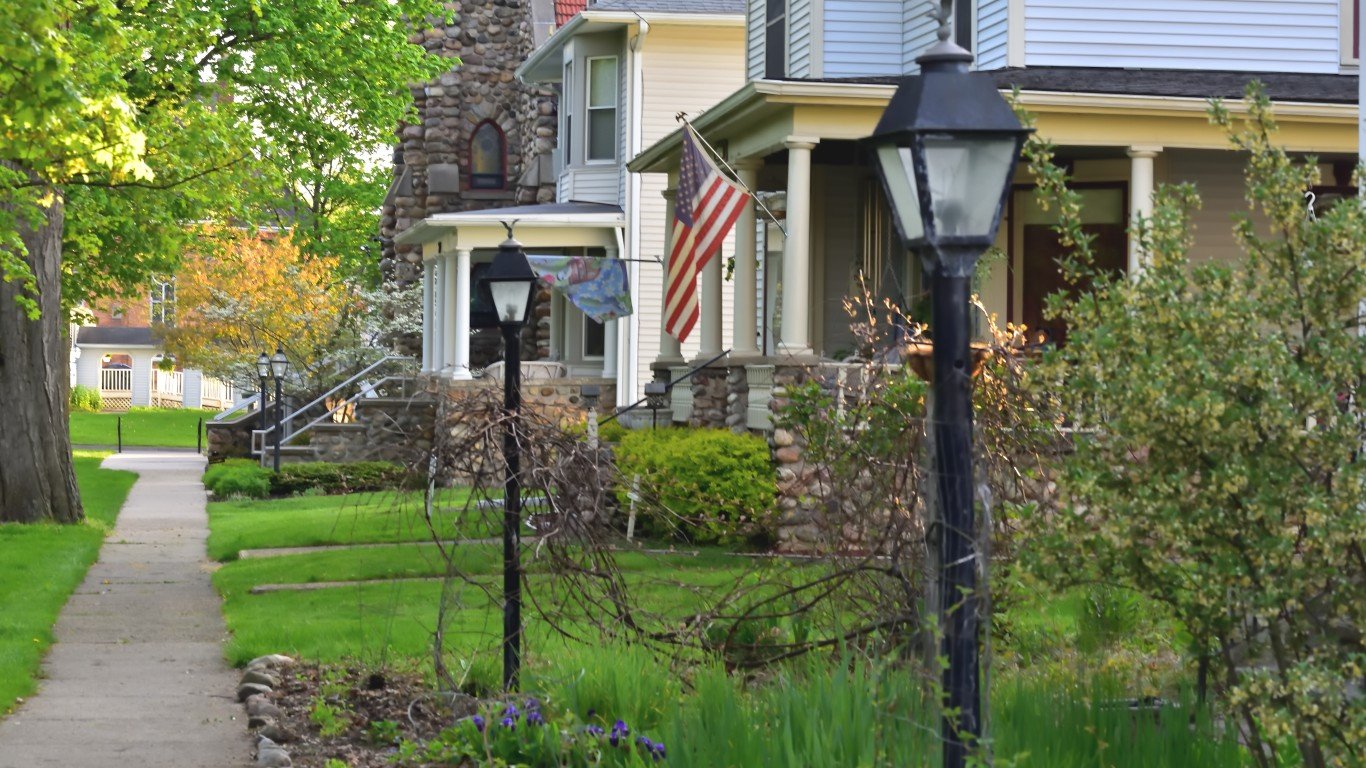
Michigan: Washtenaw County
> Median monthly rental cost: $1,161 (Michigan: $892)
> Share of income typically spent on rent: 30.6% (Michigan: 29.3%)
> Rental occupied housing units: 38.5% (Michigan: 28.3%)
> Median home value: $278,500 (Michigan: $162,600)
> No. of counties considered in ranking: 80
[recirclink id=1102674]
Minnesota: Washington County
> Median monthly rental cost: $1,329 (Minnesota: $1,010)
> Share of income typically spent on rent: 29.8% (Minnesota: 28.2%)
> Rental occupied housing units: 18.4% (Minnesota: 28.1%)
> Median home value: $301,000 (Minnesota: $235,700)
> No. of counties considered in ranking: 83

Mississippi: DeSoto County
> Median monthly rental cost: $1,073 (Mississippi: $789)
> Share of income typically spent on rent: 27.4% (Mississippi: 29.6%)
> Rental occupied housing units: 25.2% (Mississippi: 31.2%)
> Median home value: $177,800 (Mississippi: $125,500)
> No. of counties considered in ranking: 77
[in-text-ad-2]

Missouri: Platte County
> Median monthly rental cost: $1,073 (Missouri: $843)
> Share of income typically spent on rent: 24.6% (Missouri: 27.6%)
> Rental occupied housing units: 32.8% (Missouri: 32.9%)
> Median home value: $238,800 (Missouri: $163,600)
> No. of counties considered in ranking: 107

Montana: Gallatin County
> Median monthly rental cost: $1,131 (Montana: $836)
> Share of income typically spent on rent: 28.9% (Montana: 27.7%)
> Rental occupied housing units: 38.9% (Montana: 31.5%)
> Median home value: $388,000 (Montana: $244,900)
> No. of counties considered in ranking: 34
[in-text-ad]
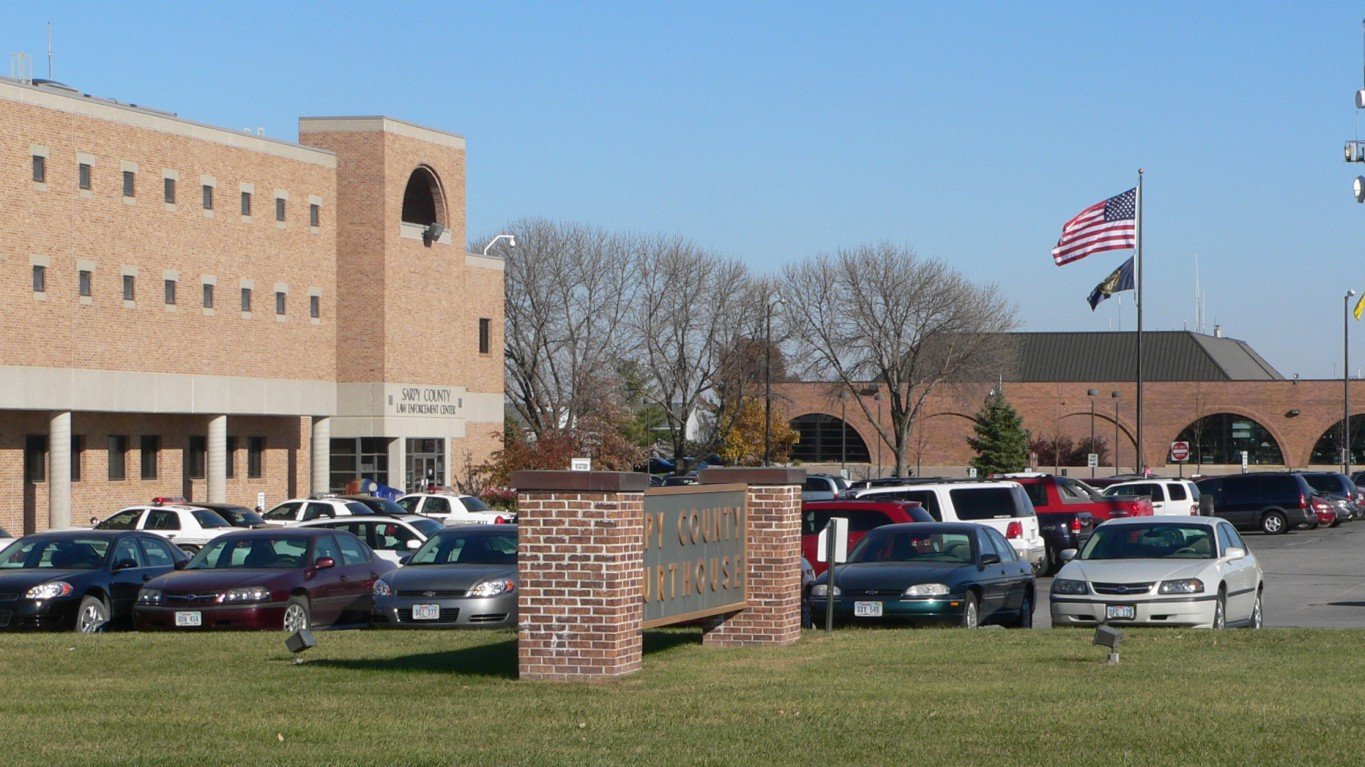
Nebraska: Sarpy County
> Median monthly rental cost: $1,050 (Nebraska: $857)
> Share of income typically spent on rent: 25.7% (Nebraska: 26.3%)
> Rental occupied housing units: 31.1% (Nebraska: 33.8%)
> Median home value: $211,400 (Nebraska: $164,000)
> No. of counties considered in ranking: 55
[recirclink id=1090849]

Nevada: Clark County
> Median monthly rental cost: $1,181 (Nevada: $1,159)
> Share of income typically spent on rent: 30.9% (Nevada: 30.0%)
> Rental occupied housing units: 45.2% (Nevada: 42.9%)
> Median home value: $285,100 (Nevada: $290,200)
> No. of counties considered in ranking: 13

New Hampshire: Rockingham County
> Median monthly rental cost: $1,274 (New Hampshire: $1,145)
> Share of income typically spent on rent: 28.2% (New Hampshire: 28.6%)
> Rental occupied housing units: 22.2% (New Hampshire: 28.8%)
> Median home value: $344,000 (New Hampshire: $272,300)
> No. of counties considered in ranking: 10
[in-text-ad-2]
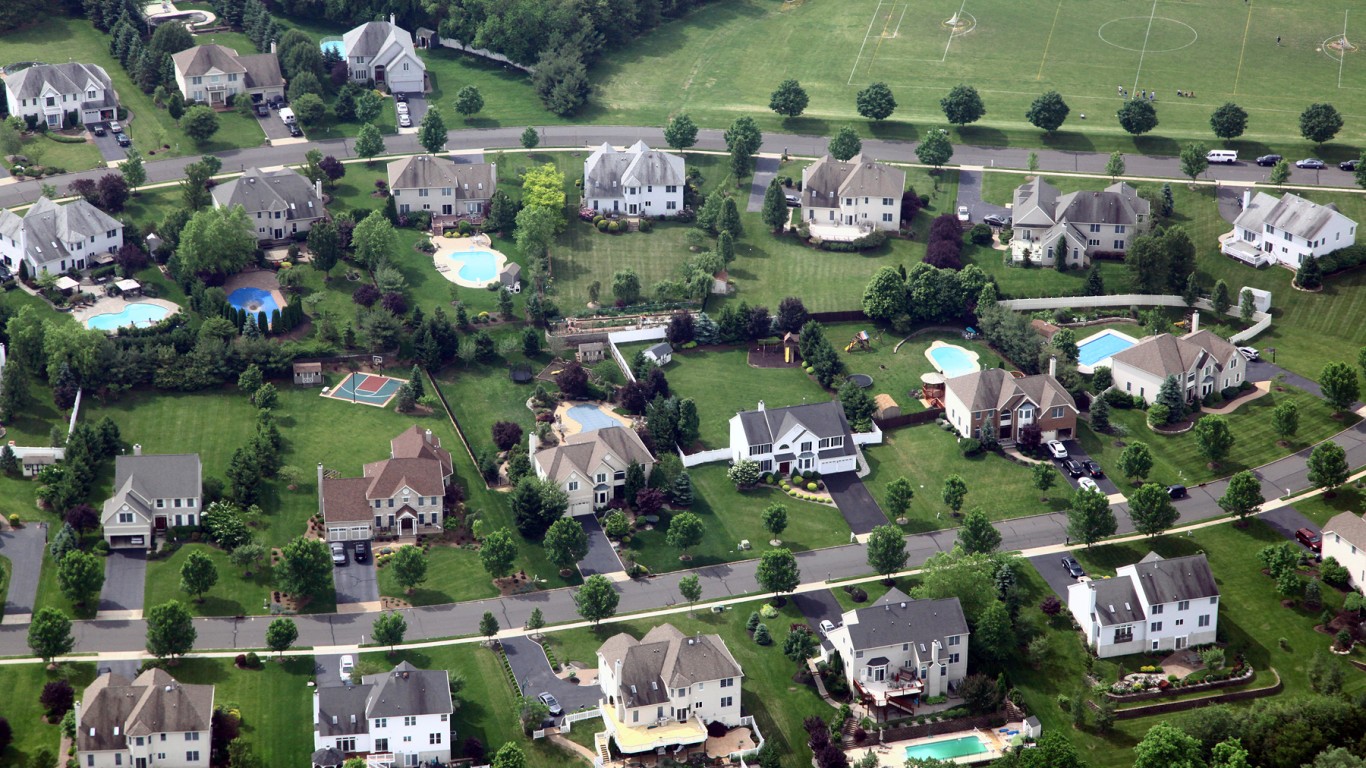
New Jersey: Somerset County
> Median monthly rental cost: $1,636 (New Jersey: $1,368)
> Share of income typically spent on rent: 28.8% (New Jersey: 30.3%)
> Rental occupied housing units: 24.3% (New Jersey: 36.0%)
> Median home value: $436,700 (New Jersey: $343,500)
> No. of counties considered in ranking: 21
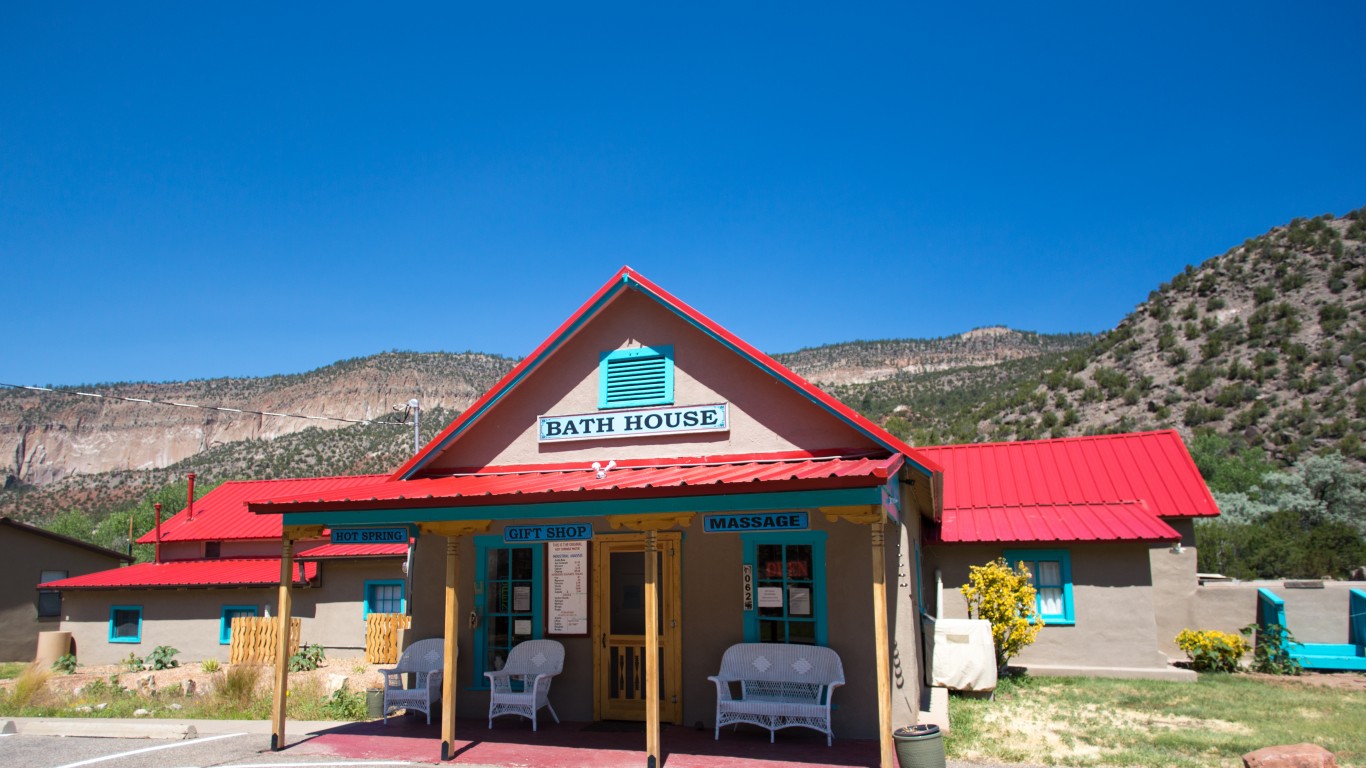
New Mexico: Sandoval County
> Median monthly rental cost: $1,114 (New Mexico: $857)
> Share of income typically spent on rent: 30.5% (New Mexico: 29.3%)
> Rental occupied housing units: 20.0% (New Mexico: 32.0%)
> Median home value: $211,700 (New Mexico: $175,700)
> No. of counties considered in ranking: 28
[in-text-ad]

New York: Nassau County
> Median monthly rental cost: $1,831 (New York: $1,315)
> Share of income typically spent on rent: 32.5% (New York: 30.8%)
> Rental occupied housing units: 18.9% (New York: 45.9%)
> Median home value: $524,400 (New York: $325,000)
> No. of counties considered in ranking: 61
[recirclink id=1090988]

North Carolina: Wake County
> Median monthly rental cost: $1,204 (North Carolina: $932)
> Share of income typically spent on rent: 27.3% (North Carolina: 28.6%)
> Rental occupied housing units: 36.1% (North Carolina: 34.3%)
> Median home value: $301,600 (North Carolina: $182,100)
> No. of counties considered in ranking: 98

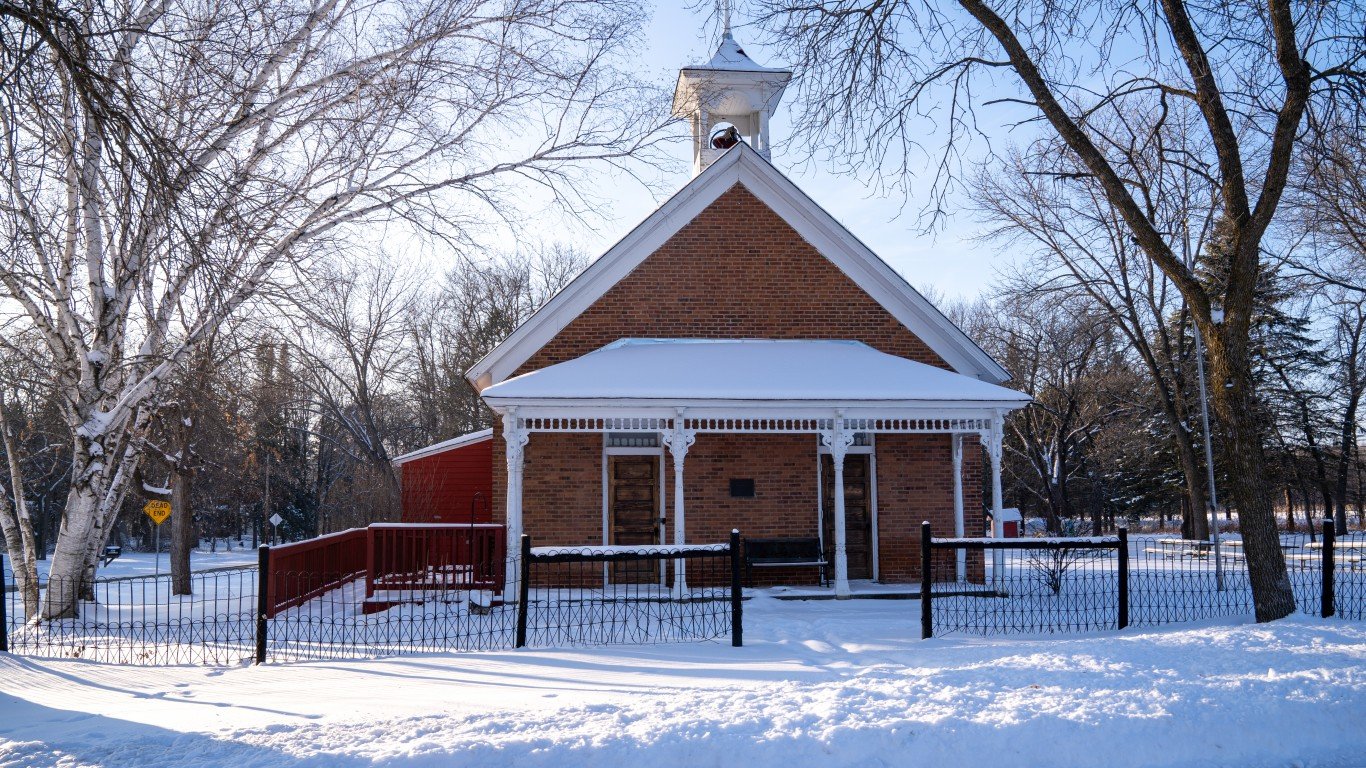
North Dakota: McKenzie County
> Median monthly rental cost: $1,088 (North Dakota: $828)
> Share of income typically spent on rent: 21.7% (North Dakota: 24.4%)
> Rental occupied housing units: 42.5% (North Dakota: 37.5%)
> Median home value: $283,400 (North Dakota: $199,900)
> No. of counties considered in ranking: 25
[in-text-ad-2]
Ohio: Delaware County
> Median monthly rental cost: $1,118 (Ohio: $825)
> Share of income typically spent on rent: 23.6% (Ohio: 27.5%)
> Rental occupied housing units: 19.3% (Ohio: 33.7%)
> Median home value: $320,300 (Ohio: $151,400)
> No. of counties considered in ranking: 88
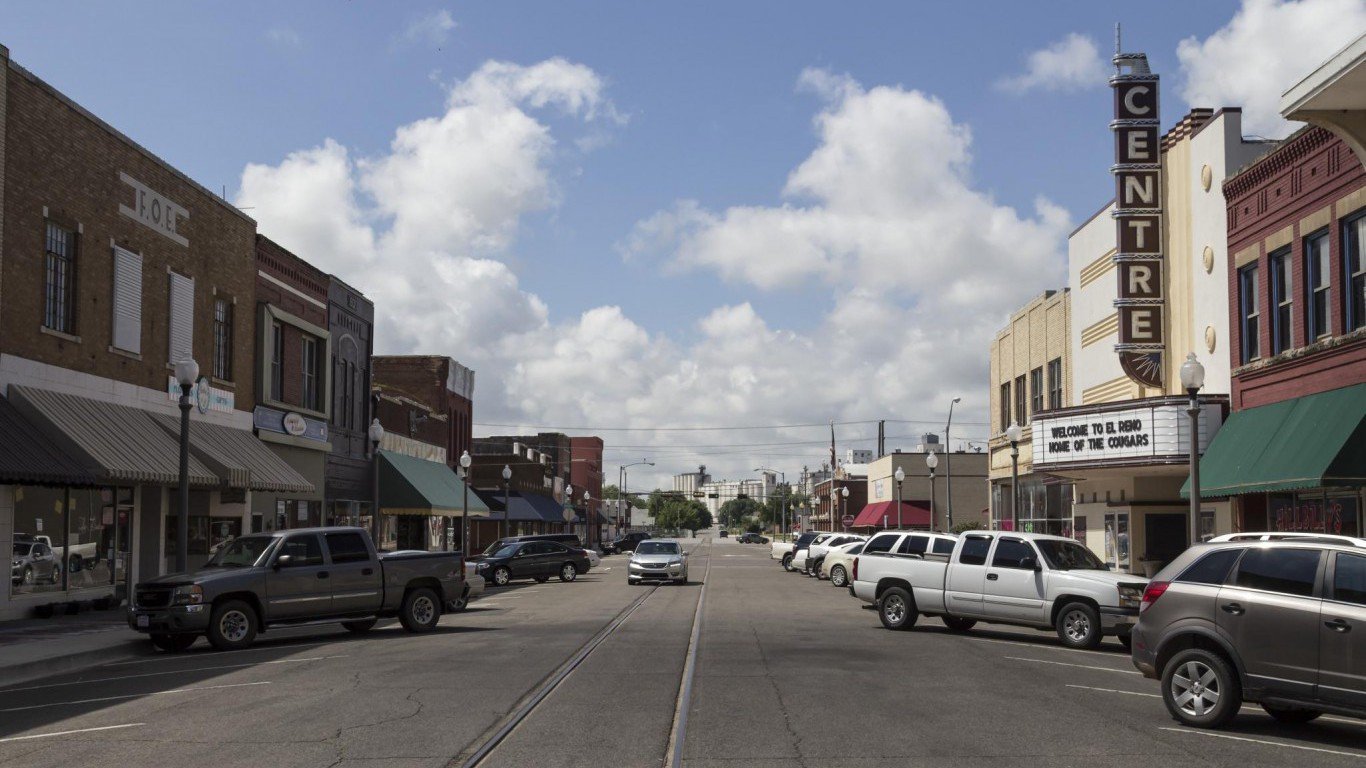
Oklahoma: Canadian County
> Median monthly rental cost: $966 (Oklahoma: $818)
> Share of income typically spent on rent: 24.9% (Oklahoma: 27.2%)
> Rental occupied housing units: 23.7% (Oklahoma: 33.9%)
> Median home value: $170,700 (Oklahoma: $142,400)
> No. of counties considered in ranking: 67
[in-text-ad]
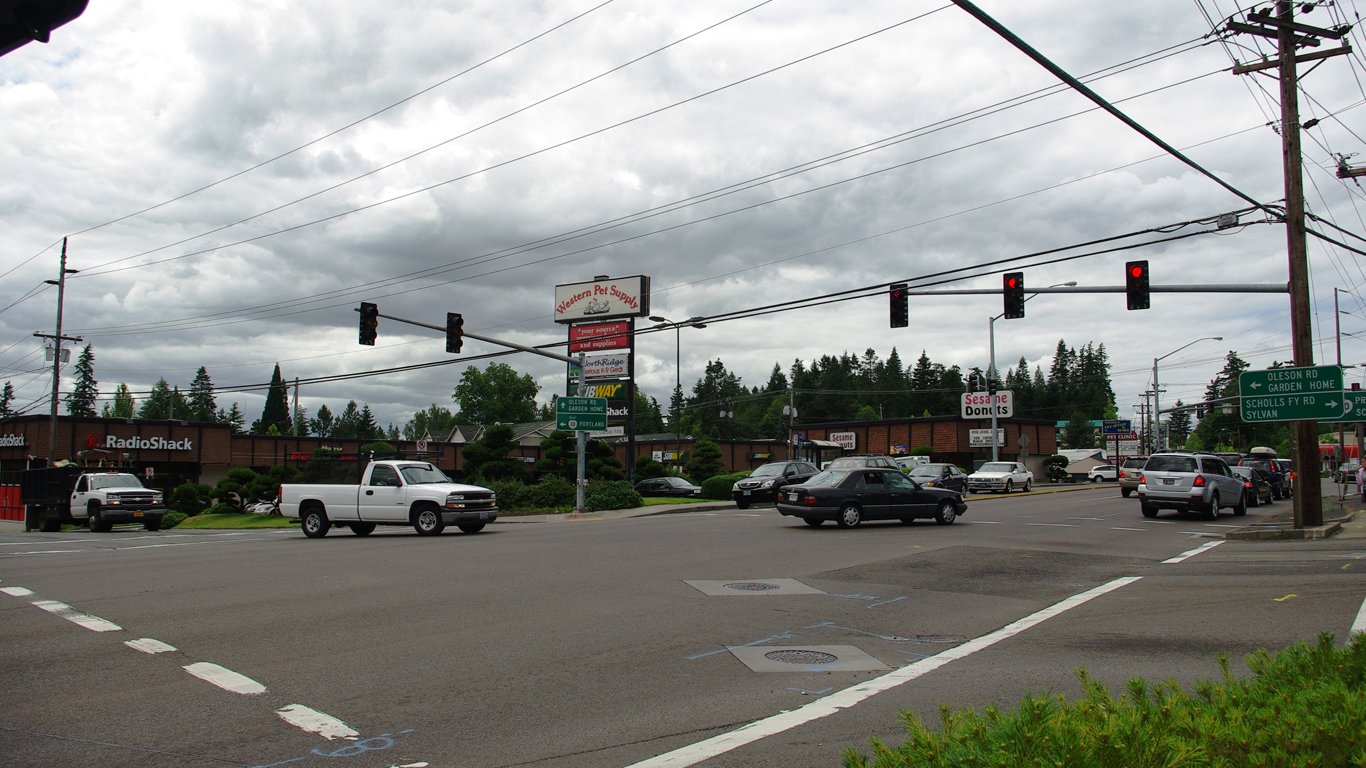
Oregon: Washington County
> Median monthly rental cost: $1,440 (Oregon: $1,173)
> Share of income typically spent on rent: 28.4% (Oregon: 30.3%)
> Rental occupied housing units: 38.7% (Oregon: 37.2%)
> Median home value: $413,500 (Oregon: $336,700)
> No. of counties considered in ranking: 33
[recirclink id=1094298]

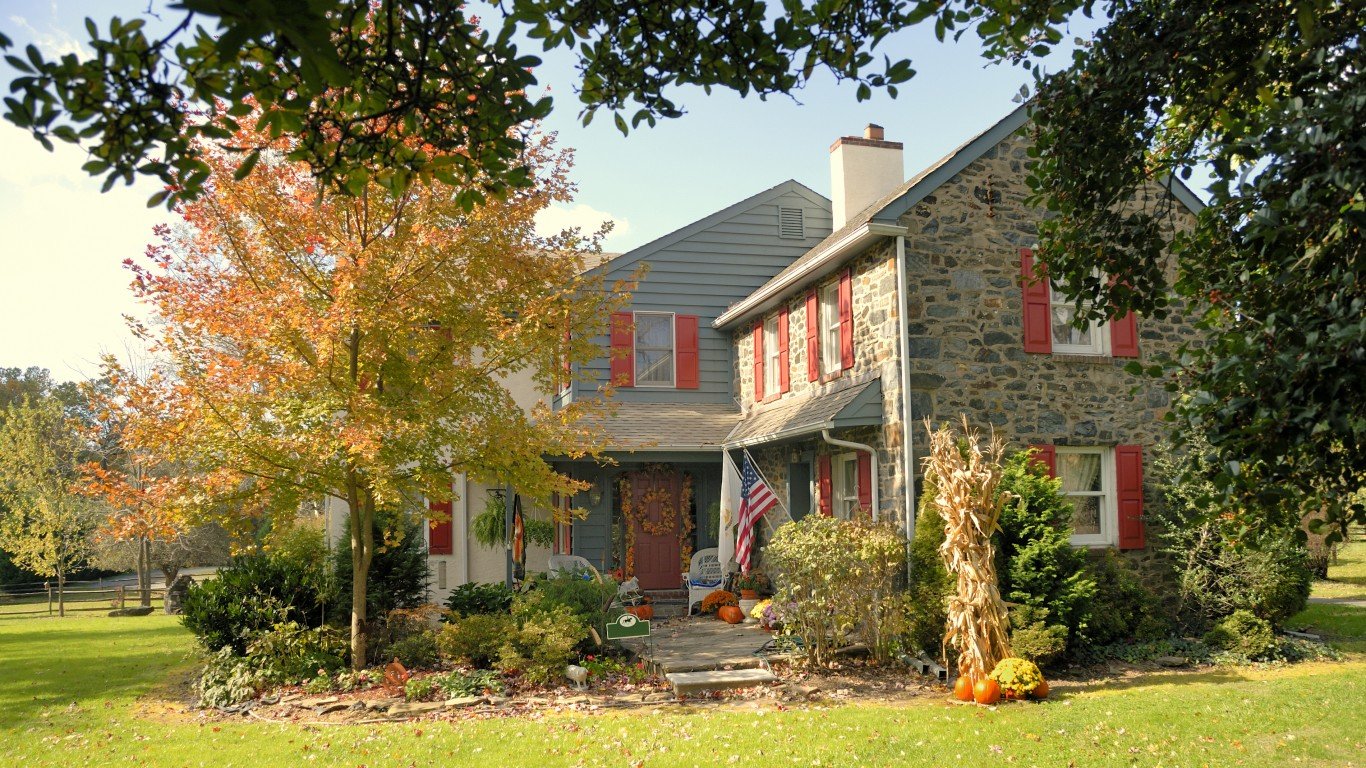
Pennsylvania: Chester County
> Median monthly rental cost: $1,354 (Pennsylvania: $958)
> Share of income typically spent on rent: 27.9% (Pennsylvania: 28.6%)
> Rental occupied housing units: 25.0% (Pennsylvania: 31.0%)
> Median home value: $369,500 (Pennsylvania: $187,500)
> No. of counties considered in ranking: 65
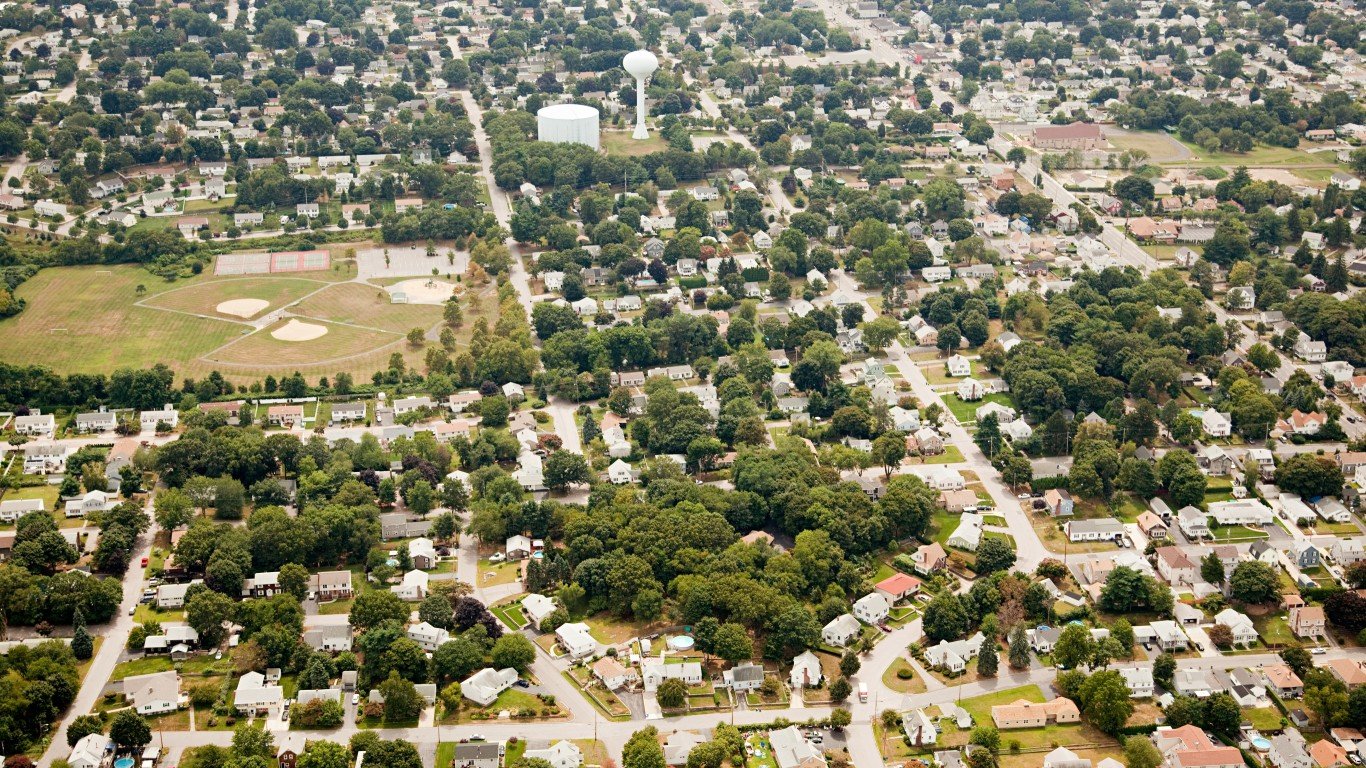
Rhode Island: Newport County
> Median monthly rental cost: $1,348 (Rhode Island: $1,031)
> Share of income typically spent on rent: 28.7% (Rhode Island: 29.0%)
> Rental occupied housing units: 35.1% (Rhode Island: 38.4%)
> Median home value: $399,500 (Rhode Island: $276,600)
> No. of counties considered in ranking: 5
[in-text-ad-2]

South Carolina: Beaufort County
> Median monthly rental cost: $1,229 (South Carolina: $918)
> Share of income typically spent on rent: 31.0% (South Carolina: 29.7%)
> Rental occupied housing units: 25.2% (South Carolina: 29.9%)
> Median home value: $309,600 (South Carolina: $170,100)
> No. of counties considered in ranking: 46
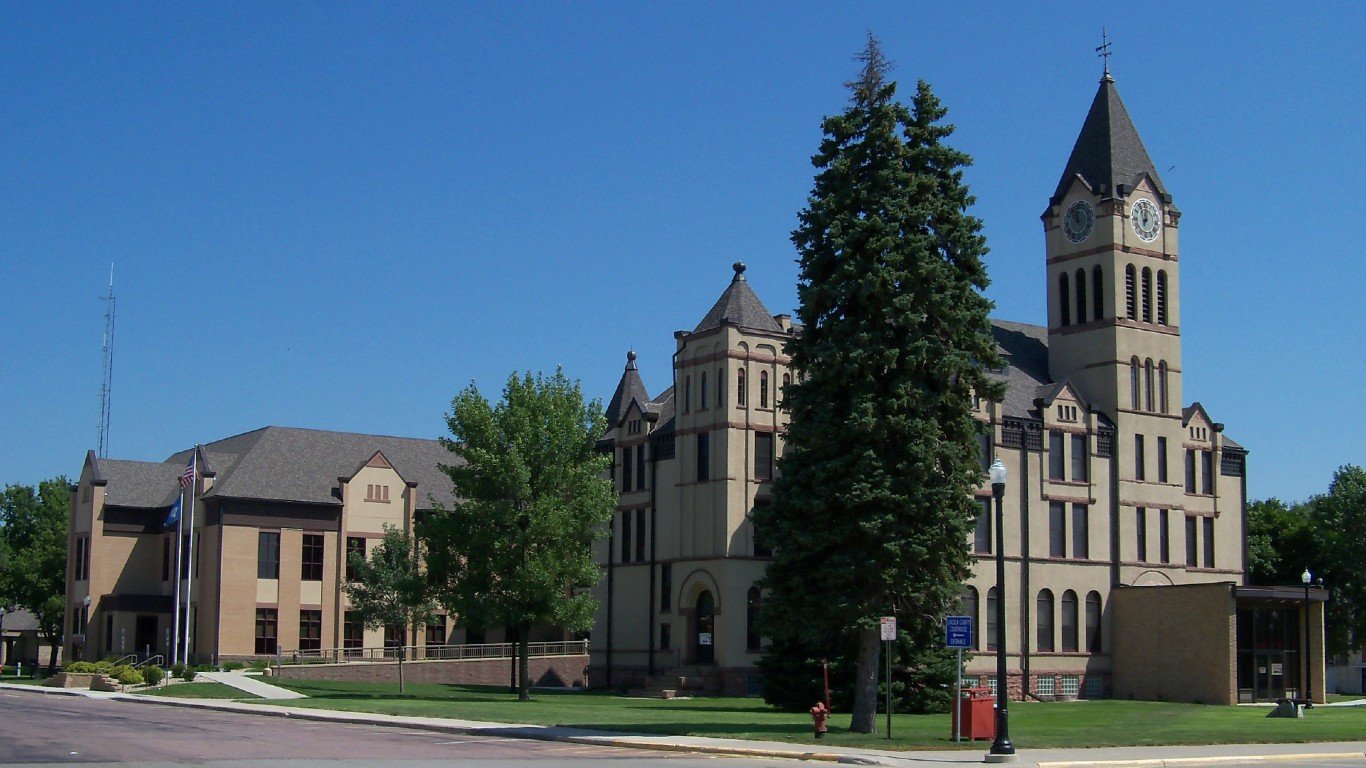
South Dakota: Lincoln County
> Median monthly rental cost: $994 (South Dakota: $761)
> Share of income typically spent on rent: 26.4% (South Dakota: 25.2%)
> Rental occupied housing units: 24.1% (South Dakota: 32.0%)
> Median home value: $240,200 (South Dakota: $174,600)
> No. of counties considered in ranking: 34
[in-text-ad]

Tennessee: Williamson County
> Median monthly rental cost: $1,596 (Tennessee: $897)
> Share of income typically spent on rent: 27.1% (Tennessee: 28.8%)
> Rental occupied housing units: 20.6% (Tennessee: 33.5%)
> Median home value: $471,300 (Tennessee: $177,600)
> No. of counties considered in ranking: 90
[recirclink id=1101677]
Texas: Fort Bend County
> Median monthly rental cost: $1,474 (Texas: $1,082)
> Share of income typically spent on rent: 29.5% (Texas: 29.1%)
> Rental occupied housing units: 22.5% (Texas: 37.7%)
> Median home value: $277,600 (Texas: $187,200)
> No. of counties considered in ranking: 191

Utah: Summit County
> Median monthly rental cost: $1,477 (Utah: $1,090)
> Share of income typically spent on rent: 25.1% (Utah: 27.8%)
> Rental occupied housing units: 21.9% (Utah: 29.5%)
> Median home value: $678,500 (Utah: $305,400)
> No. of counties considered in ranking: 21
[in-text-ad-2]
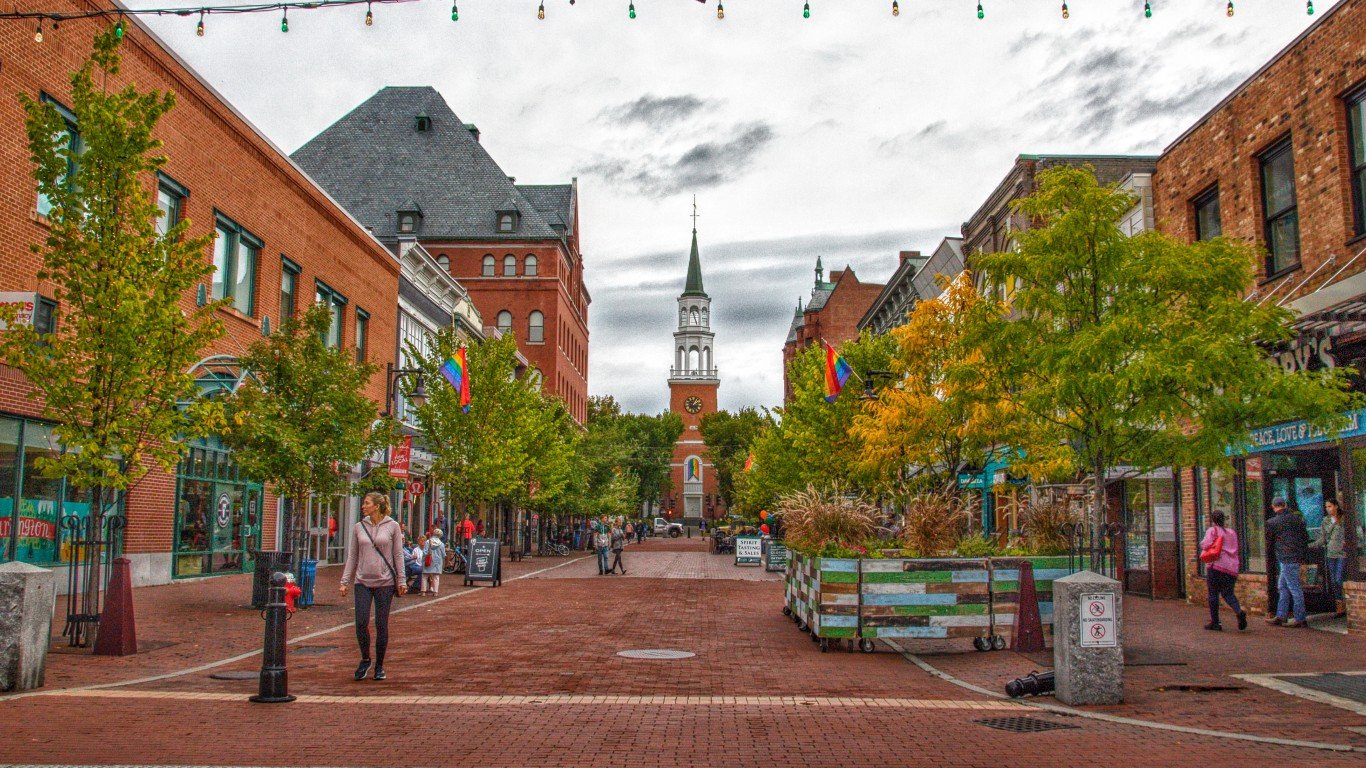
Vermont: Chittenden County
> Median monthly rental cost: $1,293 (Vermont: $999)
> Share of income typically spent on rent: 32.3% (Vermont: 29.8%)
> Rental occupied housing units: 37.1% (Vermont: 28.7%)
> Median home value: $314,200 (Vermont: $230,900)
> No. of counties considered in ranking: 12
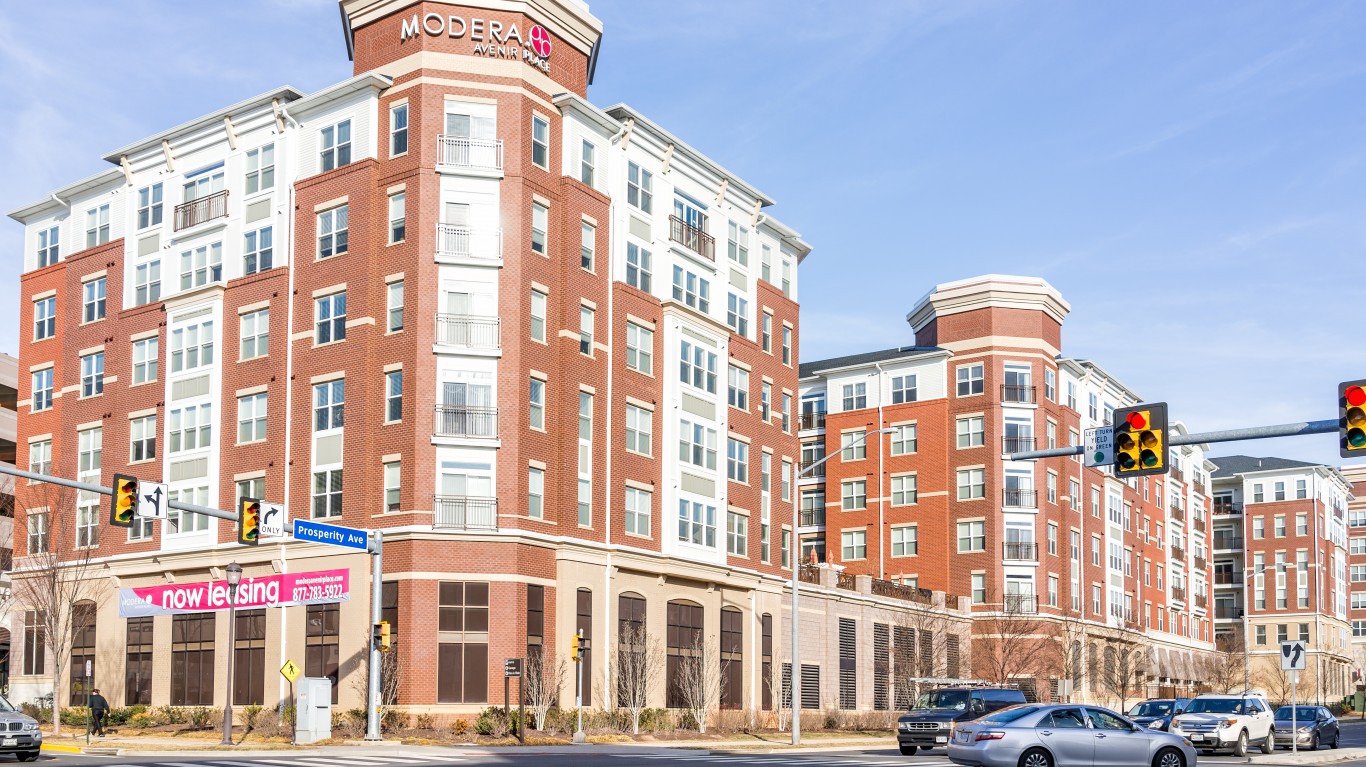
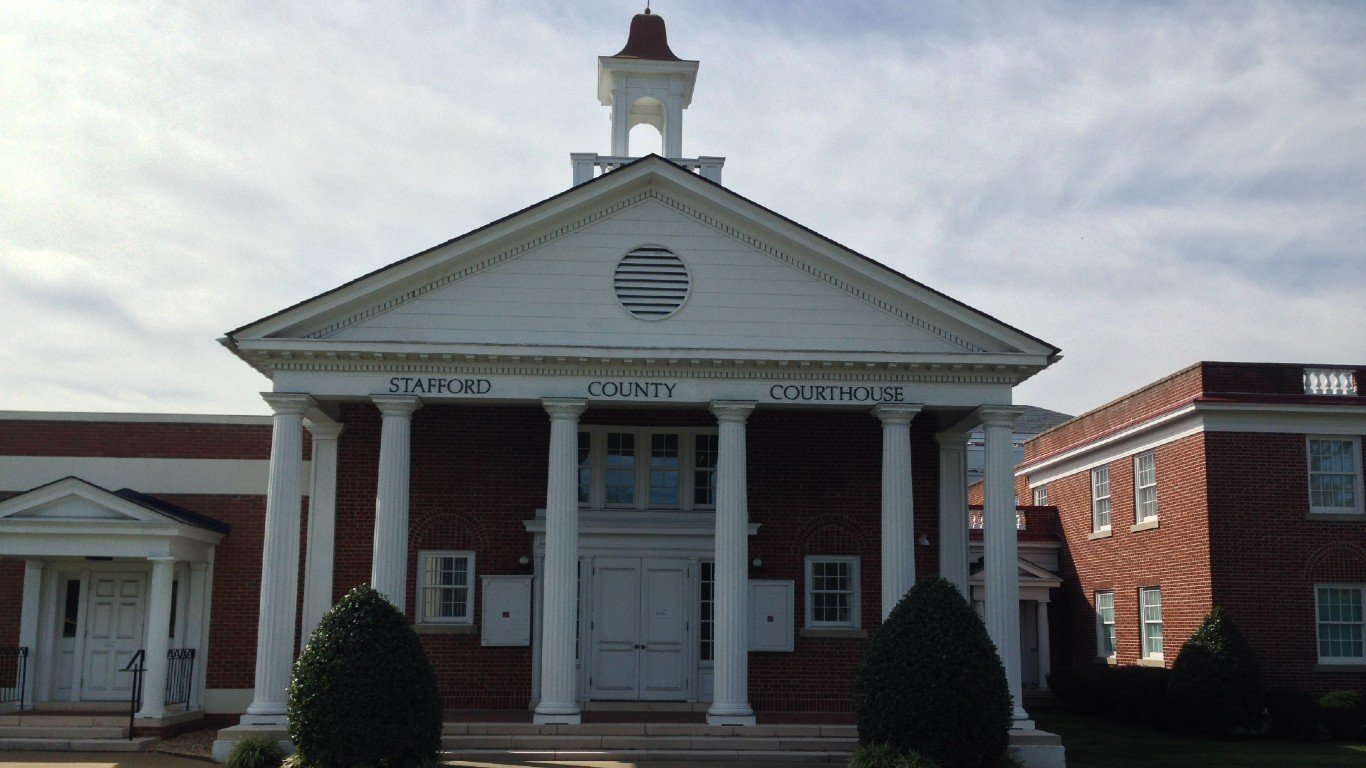
Virginia: Falls Church city
> Median monthly rental cost: $2,044 (Virginia: $1,257)
> Share of income typically spent on rent: 24.3% (Virginia: 28.8%)
> Rental occupied housing units: 41.2% (Virginia: 33.3%)
> Median home value: $810,900 (Virginia: $282,800)
> No. of counties considered in ranking: 125
[in-text-ad]

Washington: King County
> Median monthly rental cost: $1,695 (Washington: $1,337)
> Share of income typically spent on rent: 28.1% (Washington: 29.1%)
> Rental occupied housing units: 43.5% (Washington: 36.7%)
> Median home value: $601,100 (Washington: $366,800)
> No. of counties considered in ranking: 37
[recirclink id=1102674]

West Virginia: Jefferson County
> Median monthly rental cost: $1,063 (West Virginia: $732)
> Share of income typically spent on rent: 28.5% (West Virginia: 28.9%)
> Rental occupied housing units: 21.4% (West Virginia: 26.3%)
> Median home value: $261,500 (West Virginia: $123,200)
> No. of counties considered in ranking: 51
Wisconsin: Dane County
> Median monthly rental cost: $1,118 (Wisconsin: $872)
> Share of income typically spent on rent: 28.3% (Wisconsin: 27.0%)
> Rental occupied housing units: 41.0% (Wisconsin: 32.9%)
> Median home value: $277,000 (Wisconsin: $189,200)
> No. of counties considered in ranking: 70
[in-text-ad-2]

Wyoming: Teton County
> Median monthly rental cost: $1,402 (Wyoming: $853)
> Share of income typically spent on rent: 24.6% (Wyoming: 26.3%)
> Rental occupied housing units: 44.1% (Wyoming: 29.0%)
> Median home value: $850,800 (Wyoming: $228,000)
> No. of counties considered in ranking: 20
Methodology
To determine the county with the highest rent in every state, 24/7 Wall St. reviewed five-year estimates of median gross rent from the U.S. Census Bureau’s 2020 American Community Survey.
Counties were excluded if median gross rent was not available in the 2020 ACS, if there were fewer than 500 renter-occupied housing units, or if the sampling error associated with a county’s data was deemed too high.
The sampling error was defined as too high if the coefficient of variation — a statistical assessment of how reliable an estimate is — for a county’s median gross rent was above 15% and greater than two standard deviations above the mean CV for all counties’ median gross rents. We similarly excluded counties that had a sampling error too high for their population, using the same definition.
Metros were ranked based on the median gross rent. To break ties, we used the median gross rent as a share of household income.
Additional information on median gross rent as a share of household income, share of households occupied by renters, and median home value are also five-year estimates from the 2020 ACS. Because the Census Bureau didn’t release one-year estimates for 2020 due to data collection issues caused by the COVID-19 pandemic, all ACS data are five-year estimates.
Contact [email protected] for any questions or corrections.