The cost of everything from gasoline to restaurant meals to new and used vehicles has been on a relentless march upward, causing inflation to hit a 40-year high. Prices of U.S. consumer goods and services jumped 8.6% in the 12 months ending in May, led by a 34.6% rise in the energy index (fuel oil prices, for example, more than doubled) and a 10.1% jump in the food index (egg prices, for one, jumped 32%). Inflation, however, is not affecting the U.S. alone. In general, global commodity prices have been rising.
To determine the 25 global commodities that have increased in price the most, 24/7 Wall St. data from the World Bank. Commodities are ranked by the annual change in prices as of May 2022. All other data is from the World Bank. We only considered commodities with prices in any month in 2022. Also, to provide better diversity, we selected the average tea price and average crude oil price rather than separate tea and crude oil categories. In all, 61 commodities were considered.
Among the 25 global commodities whose prices have increased the most from May 2021 to May 2022 prices have jumped by nearly 20% for Mexican shrimp and by as much as 235% for European natural gas, a market that was severely disrupted by Russia’s invasion of Ukraine.
Prices for oranges and meat soared 50% in the 12 months ending in May. The cost of urea, a low-cost fertilizer that countless farmers in the developing world rely on for their livelihoods, has more than doubled.
Many of these commodities are connected to each other. If phosphate rock becomes more expensive, so does the cost of the fertilizers that use it as an ingredient as well as the agricultural products that rely on fertilizers for higher yields. In a world so deeply dependent on fossil fuels, any energy cost increase also pushes up costs to manufacturers, distributors, and ultimately the consumer.
The main causes of these price spikes have been the coronavirus pandemic that disrupted global supply chains and the war Russia unleashed on Ukraine, which led to Western sanctions on Russia that have raised the price of some important commodities. (This is the country that is most dependent on Russian oil.)
Ukraine produces nearly half of the world’s sunflower oil, and the interrupted supply of this popular cooking oil has created demand for alternatives like oils derived from rapeseed, soybean, and palm, pushing their prices higher too. Rapeseed (canola) and soybean oil prices have also been impacted by drought in South America and Canada.
Sunflower meal, a byproduct of sunflower oil production, is also a low-cost source of livestock feed. Russia and Ukraine produce more than a quarter of global wheat exports, while Russia is a major exporter of natural gas and fertilizers. (These are Ukraine’s leading trading partners.)
There are signs that some of these commodity prices are starting to level off or fall. Nearly half of these commodities experienced a month-to-month decline in May.
Here are the global commodity prices that have risen the most

25. Shrimps, Mexican (Other food)
> Annual price change, May 2022: 19.6%
> Monthly price change, May 2022: 0.9% – 7th lowest increase
> Price, May 2022 ($/kg): $15.1
> Price 2021 ($/kg): $13.7
> Price 2019 ($/kg): $12.6
U.S. fresh shrimp sales declined by more than 19% over the 12 months through May as food inflation pushes consumers away from fresh and frozen seafood sales. In the same period of time, the cost of Mexican shrimp has increased the most among seafood commodities.
[in-text-ad]
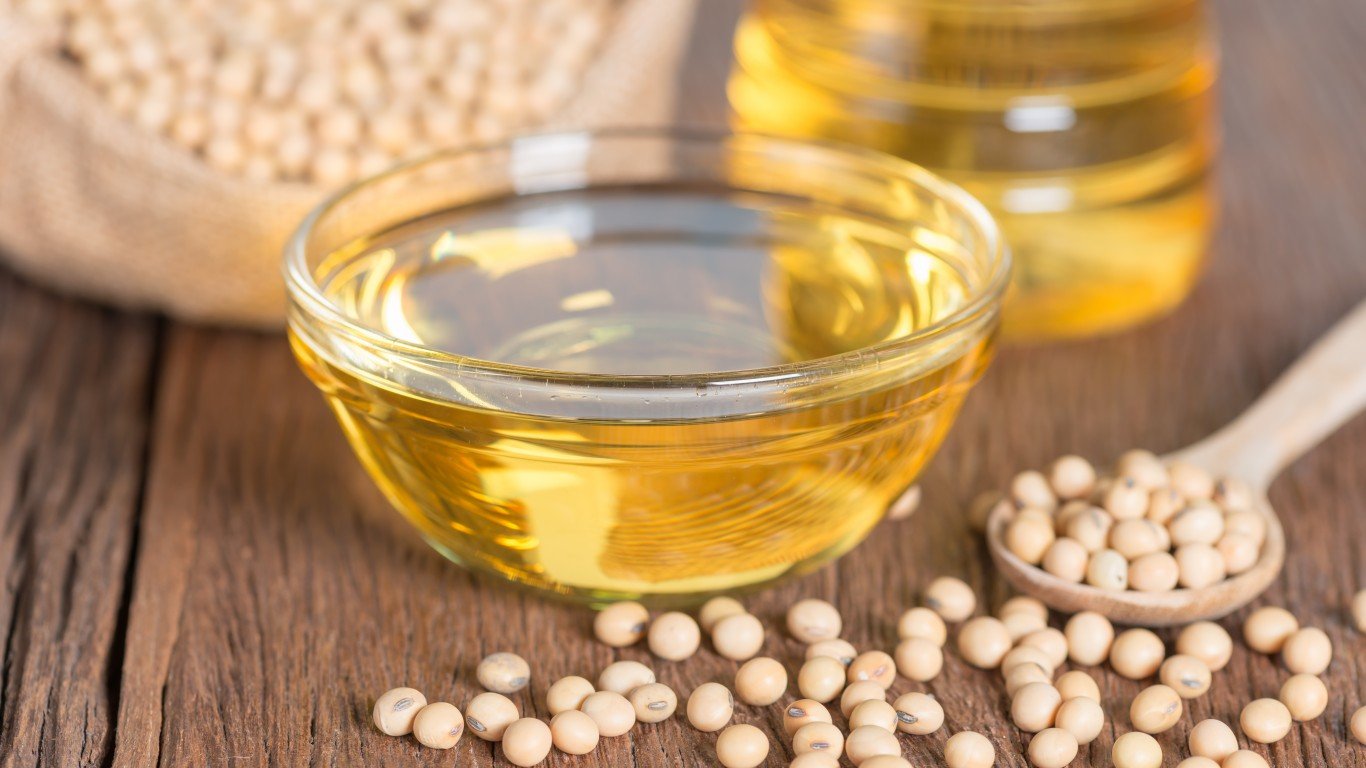
24. Soybean oil (Food: Oils and meals)
> Annual price change, May 2022: 24.7%
> Monthly price change, May 2022: 0.8% – 6th lowest increase
> Price, May 2022 ($/metric ton): $1,962.9
> Price 2021 ($/metric ton): $1,385.4
> Price 2019 ($/metric ton): $765.4
Russia’s invasion of Ukraine severely disrupted the market for sunflower oil, which accounts for 13% of the world’s vegetable oils. The absence of Ukrainian sunflower oil has increased demand for alternatives like soybean oil, pushing their prices higher as well. But already before the war soybean oil prices rose as drought in South America reduced crop yields.
[recirclink id=1142222]

23. Zinc (Metals and minerals)
> Annual price change, May 2022: 26.5%
> Monthly price change, May 2022: -14.0% – 4th highest decline
> Price, May 2022 ($/metric ton): $3,751.5
> Price 2021 ($/metric ton): $3,002.5
> Price 2019 ($/metric ton): $2,550.4
Supply chain disruptions caused by Russia’s war in Ukraine caused the price of zinc, a metal used in galvanizing and producing alloys, to skyrocket for much of the past year. More recently, zinc prices have started to trade lower along with other industrial metals amid concerns of an impending U.S. recession.
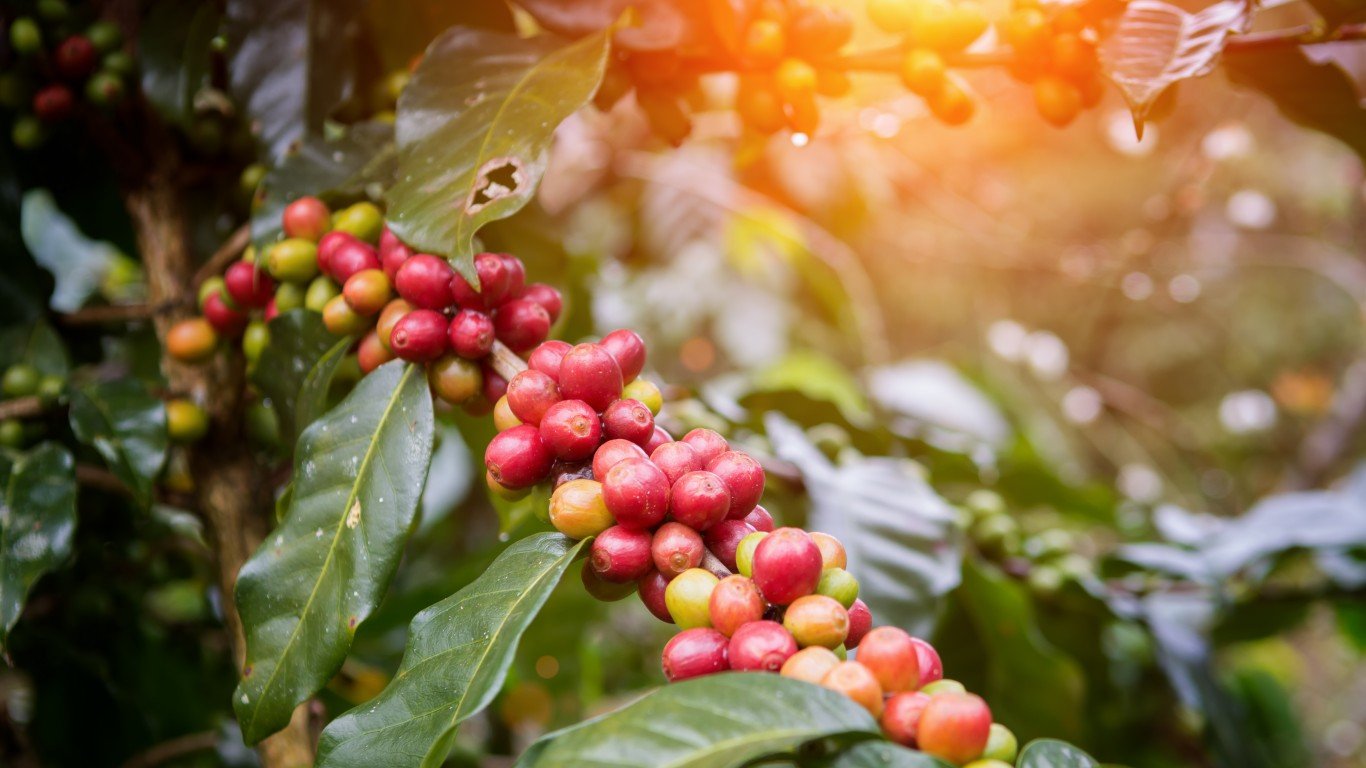
22. Coffee, Robusta (Beverages)
> Annual price change, May 2022: 29.4%
> Monthly price change, May 2022: -0.8% – 5th lowest decline
> Price, May 2022 ($/kg): $2.3
> Price 2021 ($/kg): $2.0
> Price 2019 ($/kg): $1.6
Brazil is the world’s top coffee producer, but dry weather there last year resulted in a significant reduction in crop yields for some types of coffee and an increased demand for the cheaper robusta, which is more resistant to dry conditions. As a result, the prices of both arabica and robusta have been rising since the coronavirus pandemic emerged in 2020, but more recently, coffee prices appear to have reached a peak as growing conditions have improved in Brazil since October.
[in-text-ad-2]
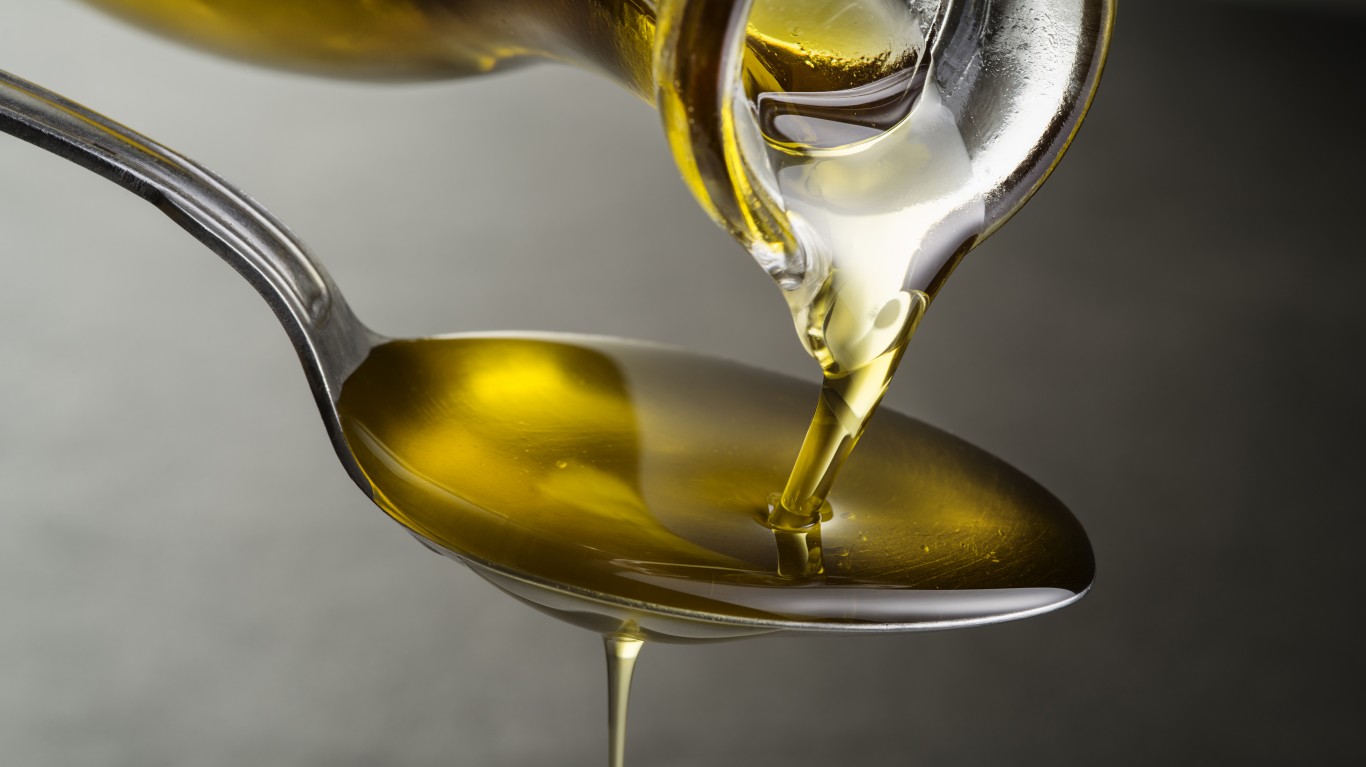
21. Sunflower oil (Food: Oils and meals)
> Annual price change, May 2022: 31.2%
> Monthly price change, May 2022: -8.6% – 12th highest decline
> Price, May 2022 ($/metric ton): $2,079.3
> Price 2021 ($/metric ton): $1,404.1
> Price 2019 ($/metric ton): $741.1
The root cause of the global cooking oil price hike over the past year has been Russia’s invasion of Ukraine, the producer of nearly half of the world’s sunflower oil. Prices appear to be falling now in part because of higher yields in other producing countries, like Spain. Some Ukrainian sunflower oil also appears to be making its way out of Ukraine onto European store shelves.
20. Coffee, Arabica (Beverages)
> Annual price change, May 2022: 39.7%
> Monthly price change, May 2022: -1.9% – 10th lowest decline
> Price, May 2022 ($/kg): $5.7
> Price 2021 ($/kg): $4.5
> Price 2019 ($/kg): $2.9
Dry weather in Brazil, the world’s largest coffee producer, resulted in a 15% decline in projected coffee crop yields this year compared to 2020, exacerbating price pressure already impacted by inflation in energy costs. Arabica coffee is milder and more popular than robusta, which is mostly used to make instant coffee, but arabica is less resistant to heat and dryness. Coffee prices have recently shown signs of leveling off.
[in-text-ad]
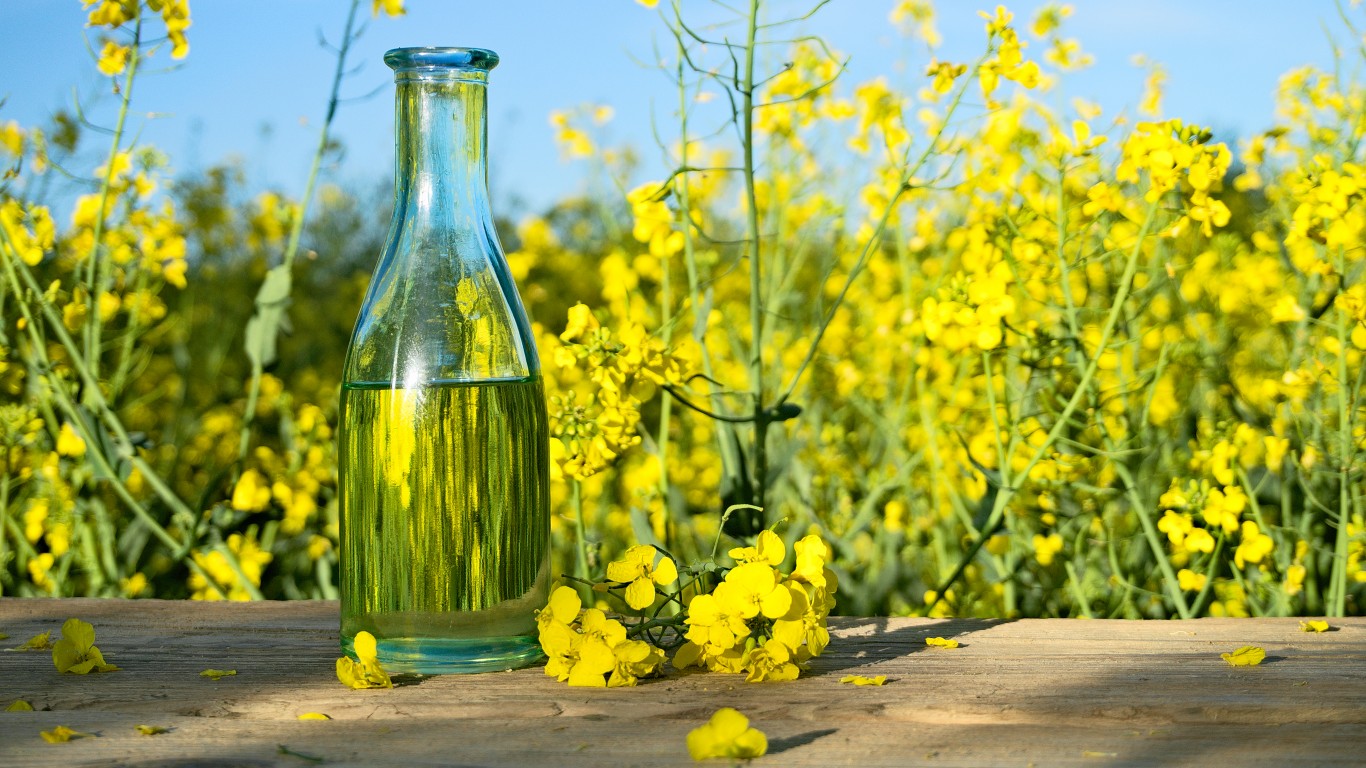
19. Rapeseed oil (Food: Oils and meals)
> Annual price change, May 2022: 44.9%
> Monthly price change, May 2022: -2.1% – 13th lowest decline
> Price, May 2022 ($/metric ton): $2,218.4
> Price 2021 ($/metric ton): $1,502.3
> Price 2019 ($/metric ton): $857.2
The price of rapeseed (canola) oil has been rising as dry weather in Canada cut output, and more recently, as consumers and companies have shifted to alternatives after the global supply of sunflower oil was disrupted by Russia’s invasion of Ukraine. Still, prices of both oils have started to edge lower thanks to higher projected harvests in the Czech Republic, Baltic states, Sweden, and France.
[recirclink id=1135797]
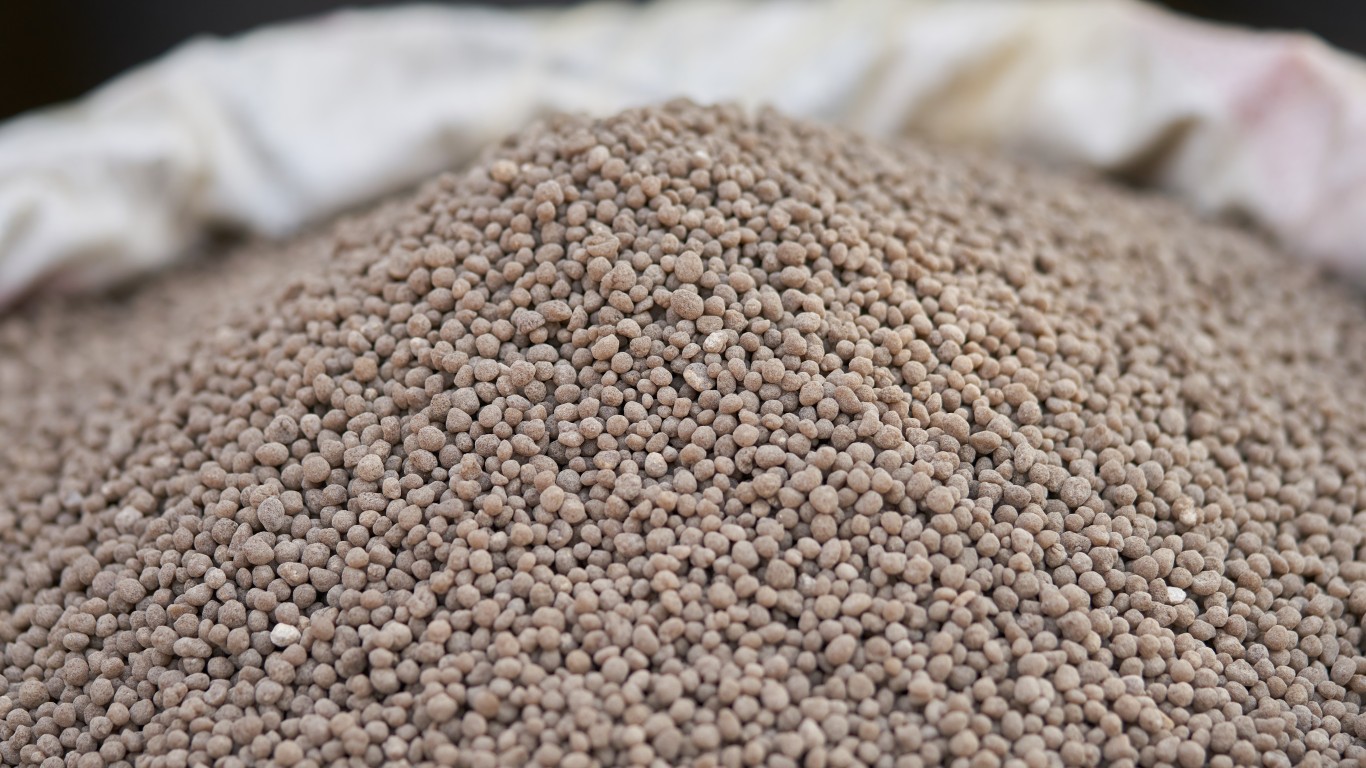
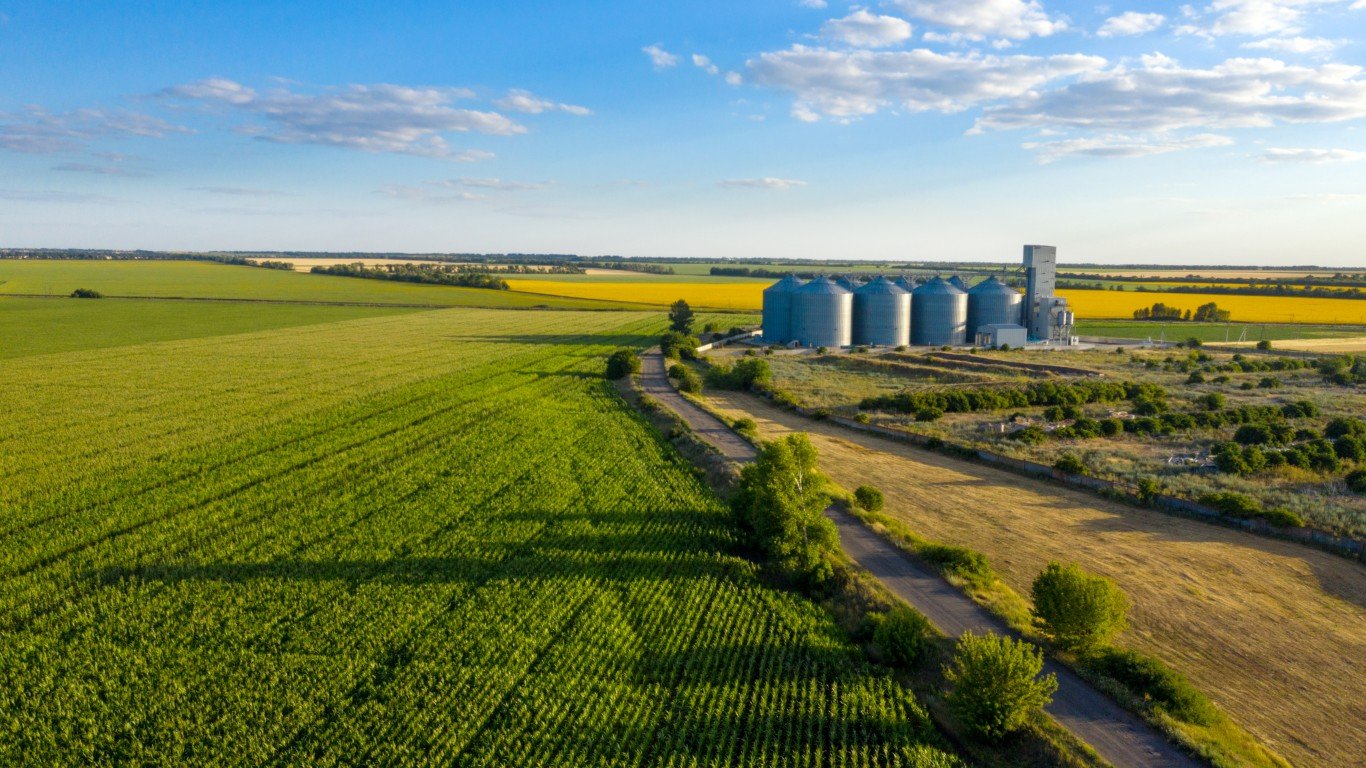
18. DAP (Fertilizers)
> Annual price change, May 2022: 46.6%
> Monthly price change, May 2022: -11.7% – 9th highest decline
> Price, May 2022 ($/metric ton): $842.5
> Price 2021 ($/metric ton): $601.0
> Price 2019 ($/metric ton): $306.4
Phosphate fertilizers like DAP (diammonium phosphate) use ammonia as a key input, and ammonia is produced using natural gas or coal. Soaring prices for these fuels has led to deep cutbacks in ammonia production, especially in China, leading to high costs for agricultural production. A recent decline in DAP prices suggests that prices might be past their peak.
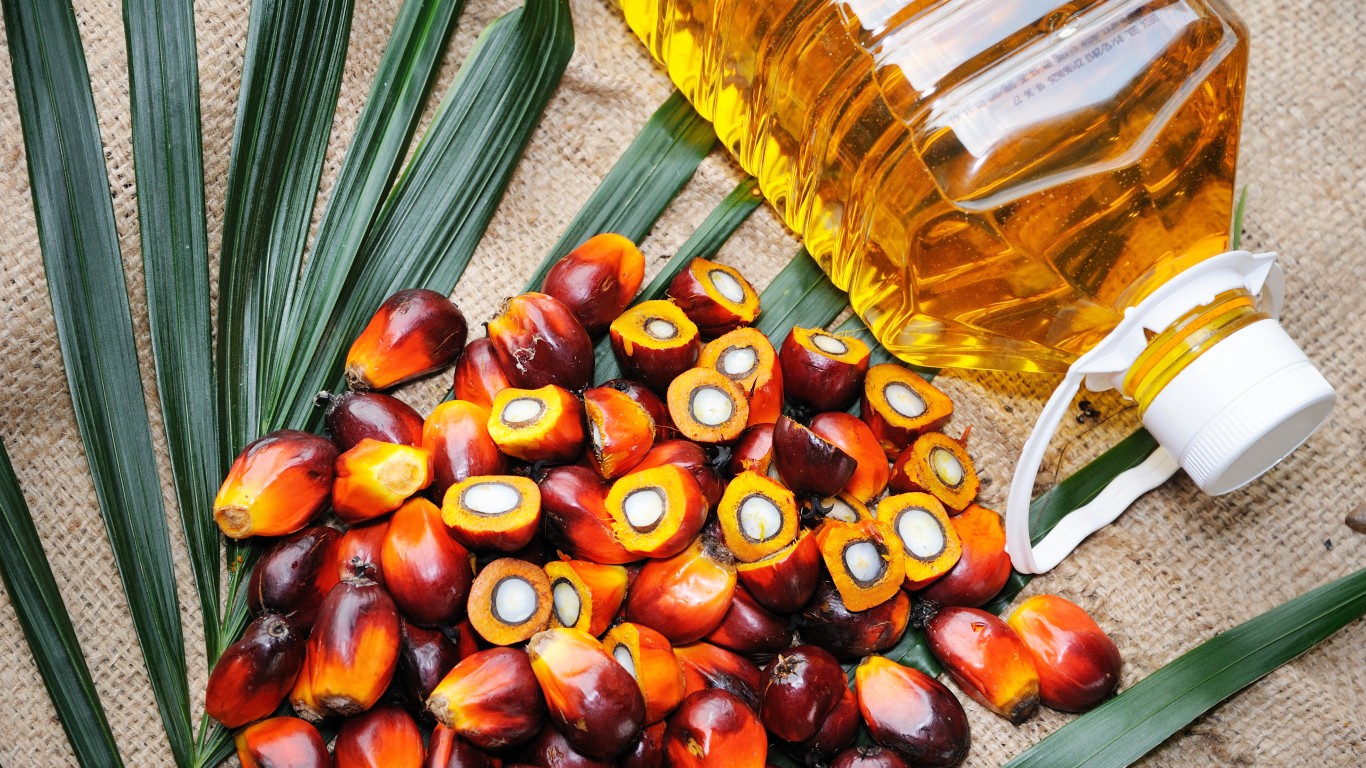
17. Palm oil (Food: Oils and meals)
> Annual price change, May 2022: 51.1%
> Monthly price change, May 2022: 2.0% – 11th lowest increase
> Price, May 2022 ($/metric ton): $1,716.9
> Price 2021 ($/metric ton): $1,130.6
> Price 2019 ($/metric ton): $601.4
The cost of the world’s most popular and cheapest cooking oil has been rising since the start of the coronavirus pandemic, affecting the world’s poorer countries. The resulting surge in food prices has led to civil unrest in Sri Lanka and Peru. Indonesia produces about 60% of the world’s palm oil. When cooking oil prices began to rise due to the disruption in sunflower oil exports caused by Russia’s invasion of Ukraine, Indonesian President Joko Widodo banned palm oil exports to stabilize domestic prices, causing a global shortage.
[in-text-ad-2]
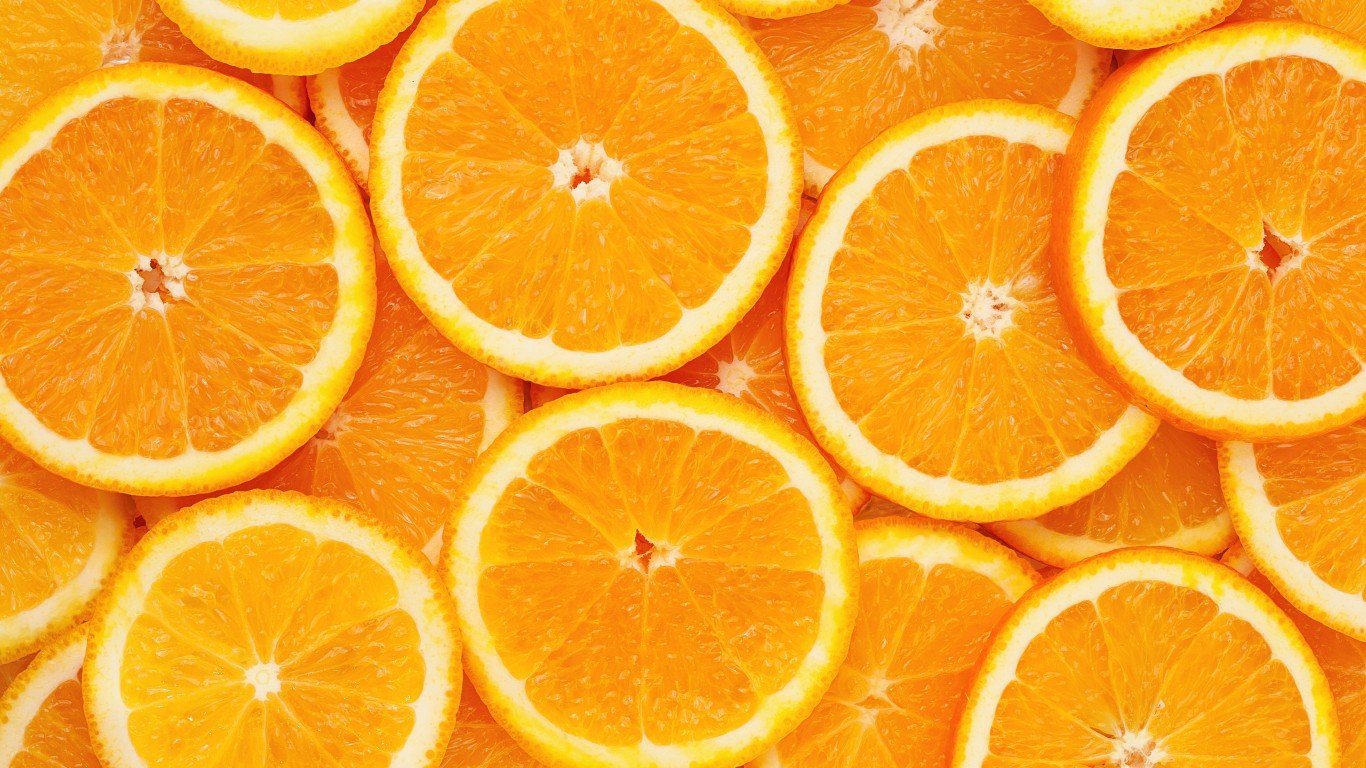
16. Orange (Other food)
> Annual price change, May 2022: 51.3%
> Monthly price change, May 2022: 1.6% – 10th lowest increase
> Price, May 2022 ($/kg): $0.9
> Price 2021 ($/kg): $0.7
> Price 2019 ($/kg): $0.6
Orange prices have risen more than other fruit and vegetables thanks to unseasonably cold weather during the last growing season in Florida and Texas, as well as the spread of citrus greening, an incurable disease that reduces crop yields and sugar content in oranges. Unlike other sugary juices, orange juice demand has been rising, adding to the price pressure.
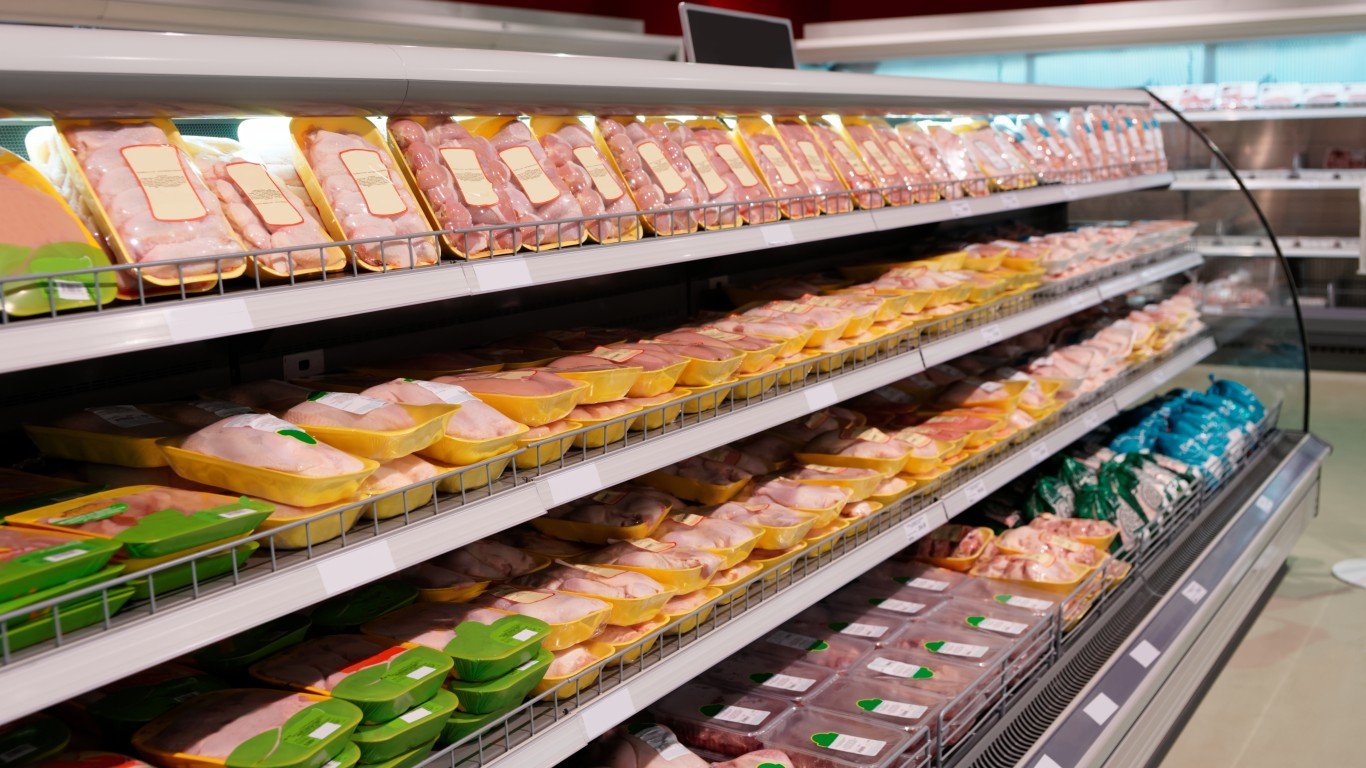
15. Meat, chicken (Other food)
> Annual price change, May 2022: 56.0%
> Monthly price change, May 2022: 0.8% – 5th lowest increase
> Price, May 2022 ($/kg): $3.7
> Price 2021 ($/kg): $2.3
> Price 2019 ($/kg): $2.0
The cost of chicken continues to soar. The main causes for these increases are pandemic-related labor shortages at production facilities and higher cost of grain used to make feed, higher energy costs, and consumers who have been willing to pay higher prices. But critics point to rising profits at companies like Tyson Foods, arguing that producers are using inflation as an excuse to gouge consumers.
[in-text-ad]

14. TSP (Fertilizers)
> Annual price change, May 2022: 56.9%
> Monthly price change, May 2022: -3.3% – 17th lowest decline
> Price, May 2022 ($/metric ton): $827.5
> Price 2021 ($/metric ton): $538.2
> Price 2019 ($/metric ton): $294.5
Production of phosphate fertilizers, including TSP (triple superphosphate), relies on raw material inputs like phosphate rock, ammonia, sulfur and requires natural gas or coal to produce. The prices of all these related materials have been rising along with long-term demand for phosphate by the world’s largest agrarian economies like Brazil and India. Phosphate fertilizer prices are expected to return to normal as the global effects of the pandemic subside.
[recirclink id=1140618]
13. Nickel (Metals and minerals)
> Annual price change, May 2022: 59.7%
> Monthly price change, May 2022: -15.3% – 3rd highest decline
> Price, May 2022 ($/metric ton): $28,062.6
> Price 2021 ($/metric ton): $18,465.0
> Price 2019 ($/metric ton): $13,913.9
Nickel, a key component in the production of stainless steel and other alloys, saw its price skyrocket amid supply chain disruptions caused by Russia’s invasion of Ukraine. Russia is a major miner and producer of the metal. But like zinc and other industrial metals, zinc prices are falling amid concerns of an impending U.S. recession.

12. Crude oil, average (Energy)
> Annual price change, May 2022: 65.8%
> Monthly price change, May 2022: 6.5% – 6th highest increase
> Price, May 2022 ($/barrel): $110.1
> Price 2021 ($/barrel): $69.1
> Price 2019 ($/barrel): $61.4
The 23 members of OPEC+, led by Saudi Arabia, agreed at the end of June to increase oil production after greatly reducing output during the height of the coronavirus pandemic that initially sent demand for fuels plummeting. The price of crude has been soaring as the world began returning to business as usual, though some OPEC+ members like Angola and Nigeria are struggling to meet current production targets. Meanwhile, Russian oil exports have been hit as some major oil-consuming nations shy away from its oil due to its invasion of Ukraine.
[in-text-ad-2]
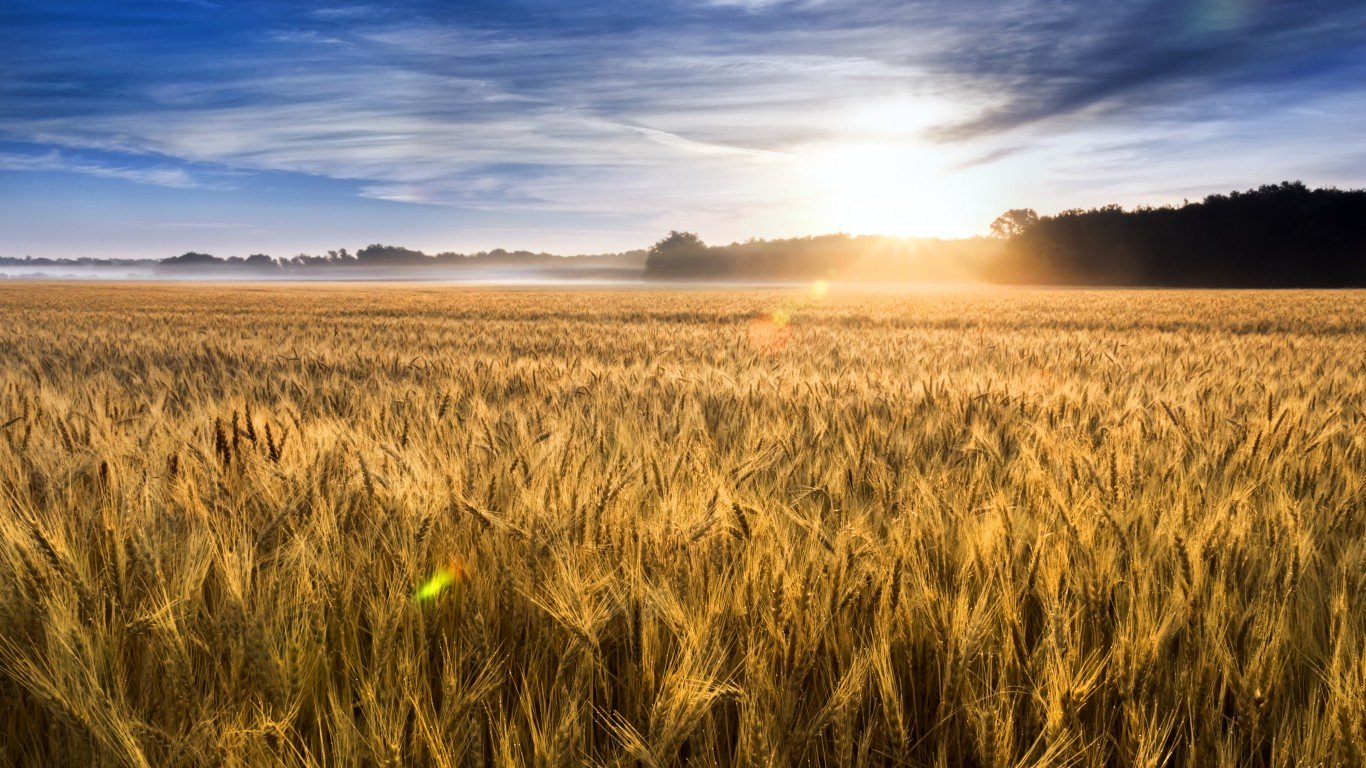
11. Wheat, US HRW (Food: Grains)
> Annual price change, May 2022: 75.7%
> Monthly price change, May 2022: 5.5% – 7th highest increase
> Price, May 2022 ($/metric ton): $522.3
> Price 2021 ($/metric ton): $315.2
> Price 2019 ($/metric ton): $201.7
Russia and Ukraine are major wheat exporters, but Russia’s war on Ukraine has severely hindered global supply of the staple, forcing wheat-importing countries to look elsewhere. This shift has driven up prices for American hard red winter wheat (HRW), the source of general-purpose flour. Though the price of U.S. HRW increased in May, grain prices appear to be stabilizing.

10. Cotton, A Index (Other raw materials)
> Annual price change, May 2022: 80.2%
> Monthly price change, May 2022: 5.4% – 8th highest increase
> Price, May 2022 ($/kg): $3.6
> Price 2021 ($/kg): $2.2
> Price 2019 ($/kg): $1.7
In addition to the high cost of fertilizer, cotton prices have been driven skyward by unseasonable rainfall and a blight of pink bollworms in cotton-growing areas of India, the world’s leading producer of cotton. Cotton futures may soon fall as fears of an impending U.S. recession rises.
[in-text-ad]
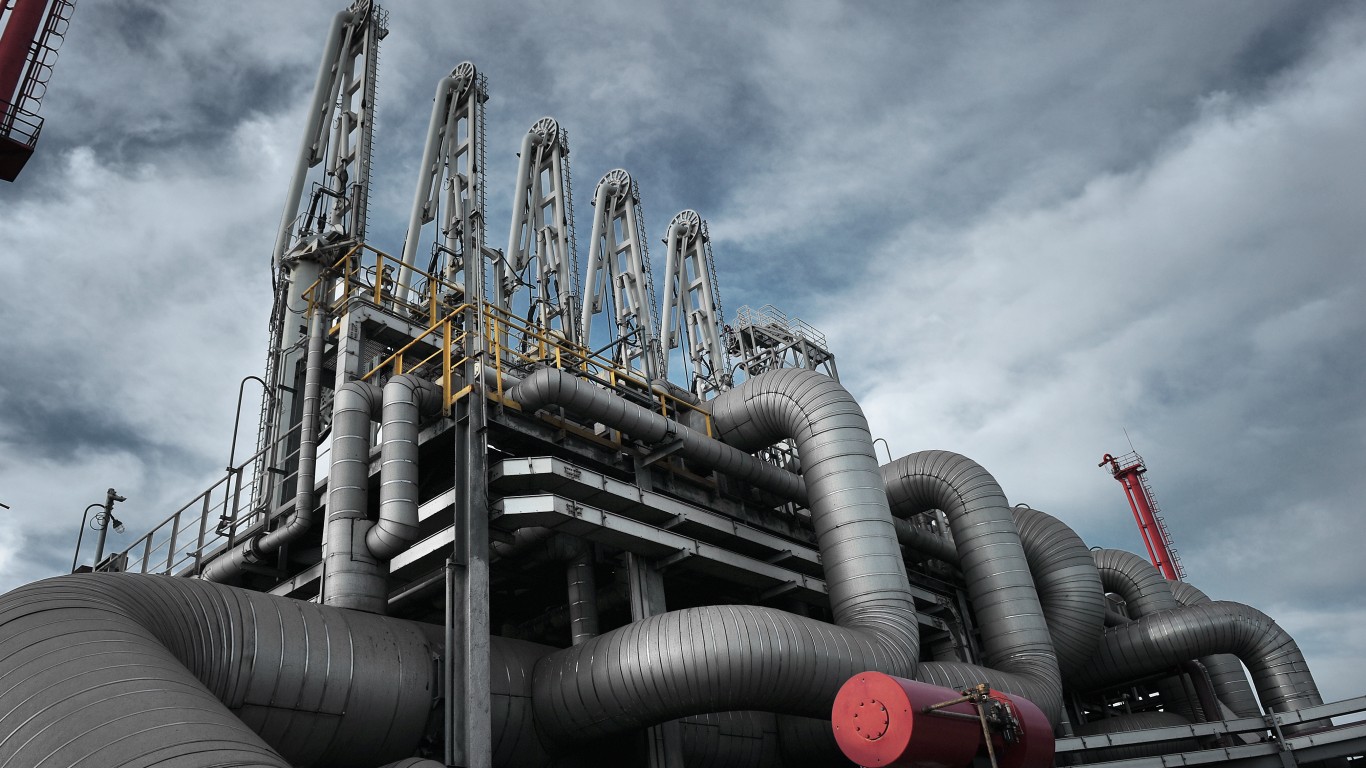
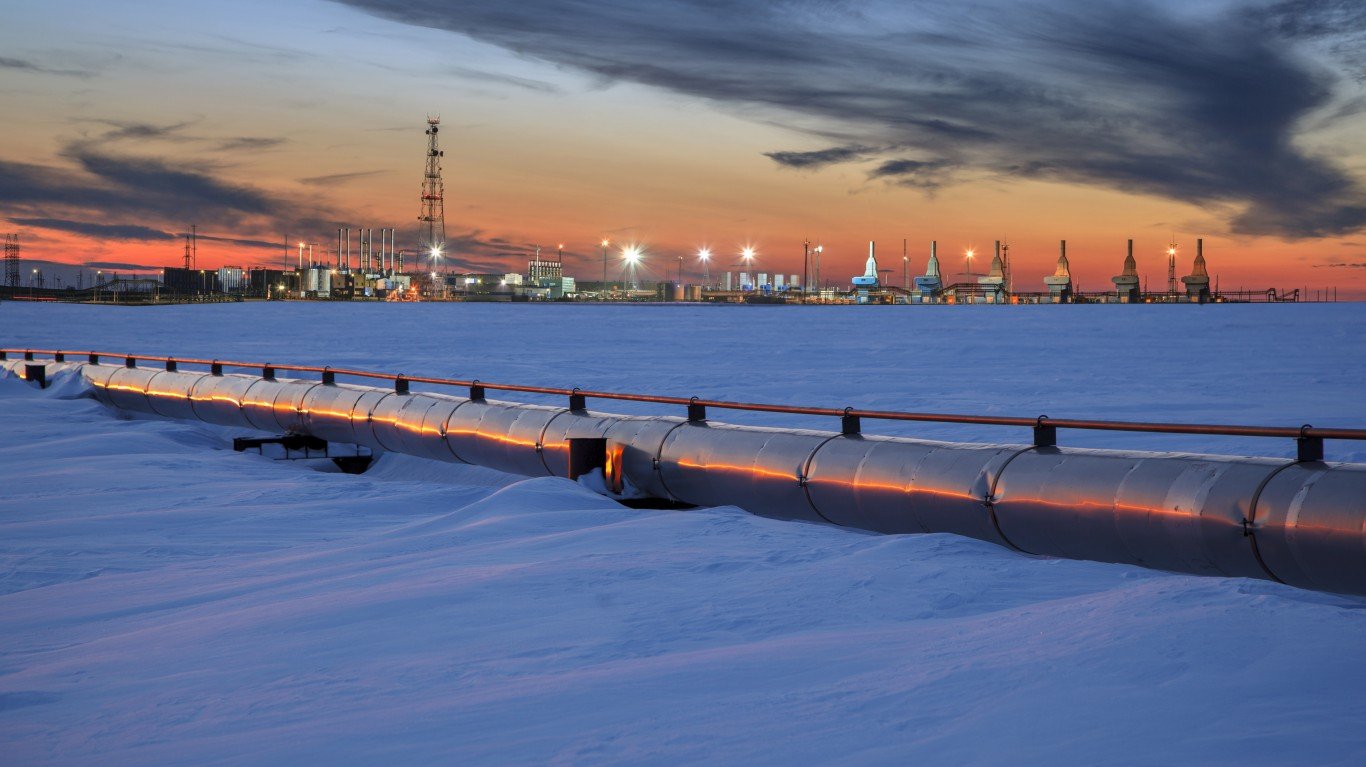
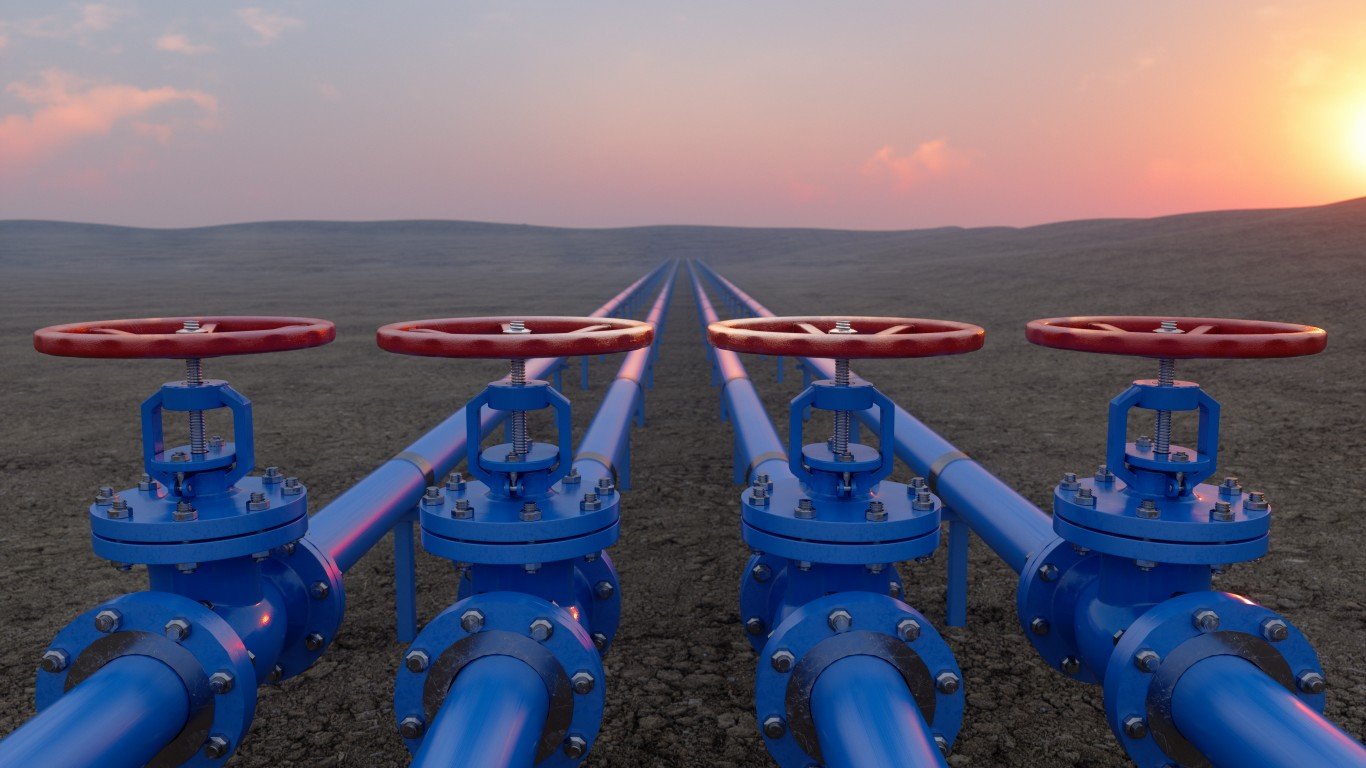
9. Liquefied natural gas, Japan (Energy)
> Annual price change, May 2022: 85.4%
> Monthly price change, May 2022: 1.5% – 9th lowest increase
> Price, May 2022 ($/million British thermal units): $16.5
> Price 2021 ($/million British thermal units): $10.8
> Price 2019 ($/million British thermal units): $10.6
Russia’s war on Ukraine upended global energy markets that were already scrambling to keep up with a rebound in global demand that plummeted during the earlier months of the coronavirus pandemic. Europe’s increased demand for liquefied natural gas in order to reduce its dependence on Russian natural gas, but that has sent LNG prices soaring even as the U.S., the world’s largest natural gas producer, has greatly increased exports.
[recirclink id=1076517]
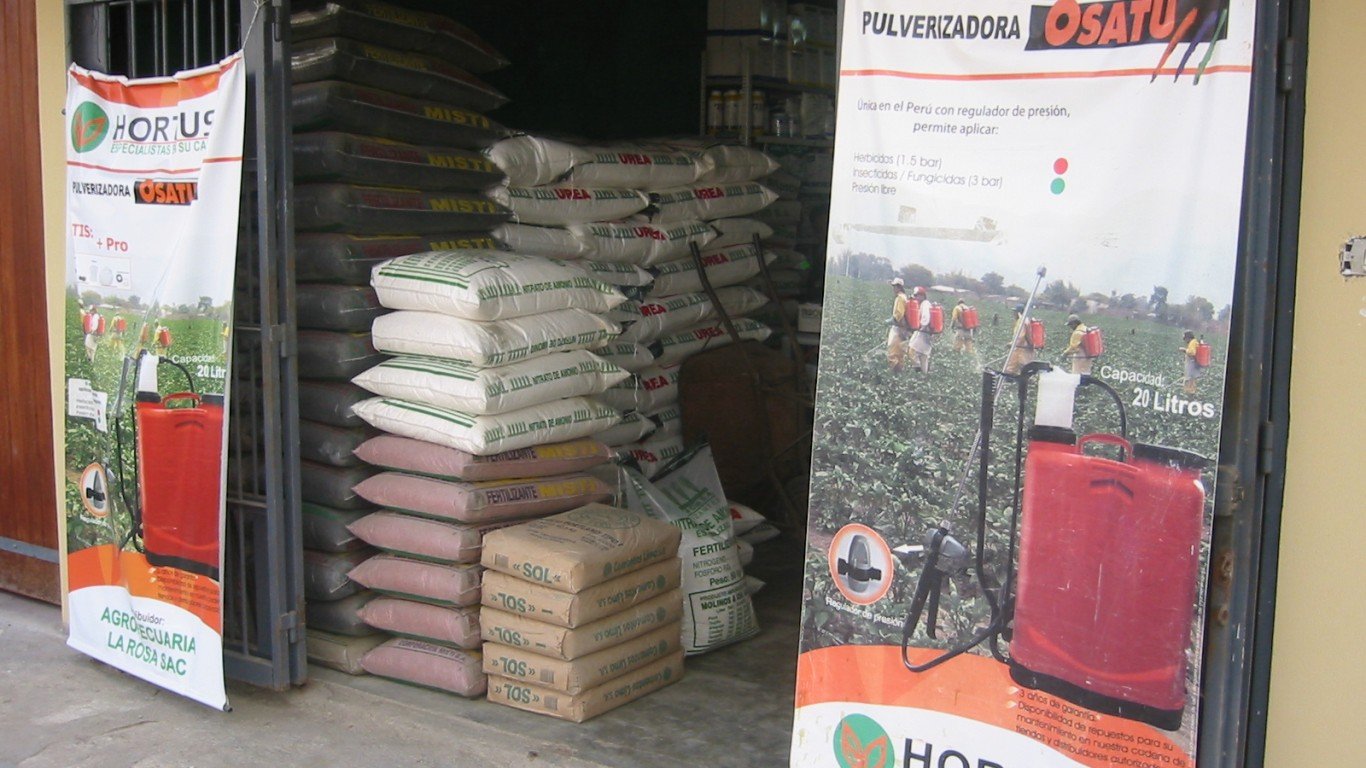
8. Urea (Fertilizers)
> Annual price change, May 2022: 113.3%
> Monthly price change, May 2022: -23.5% – the highest decline
> Price, May 2022 ($/metric ton): $707.5
> Price 2021 ($/metric ton): $483.2
> Price 2019 ($/metric ton): $245.3
After soaring to record highs, fertilizer prices seem to be rolling back down. This is especially true for urea, an important source of nitrogen used in the production of fertilizers. Prices recently began a downward correction in part because Russian-sourced urea has started to return to U.S. markets after a steep decline in the first weeks of the war with Ukraine.
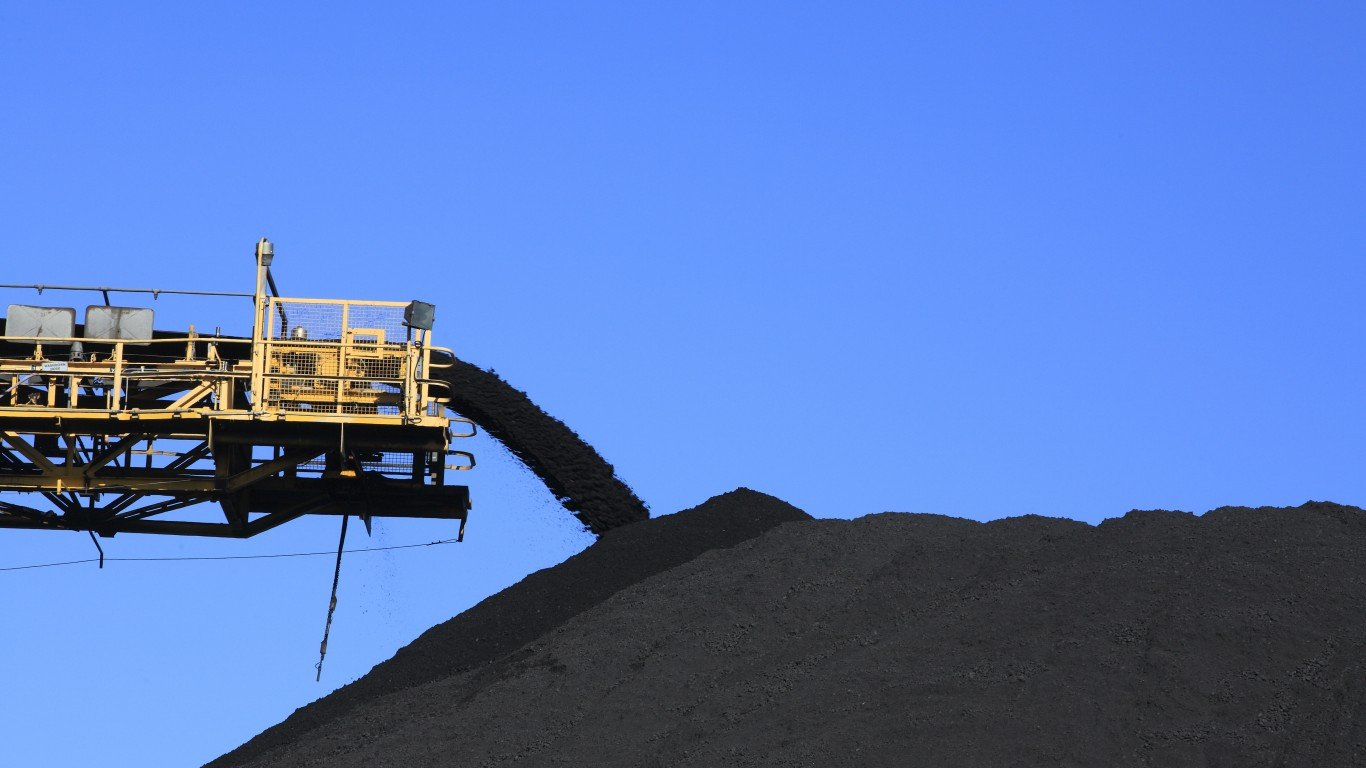
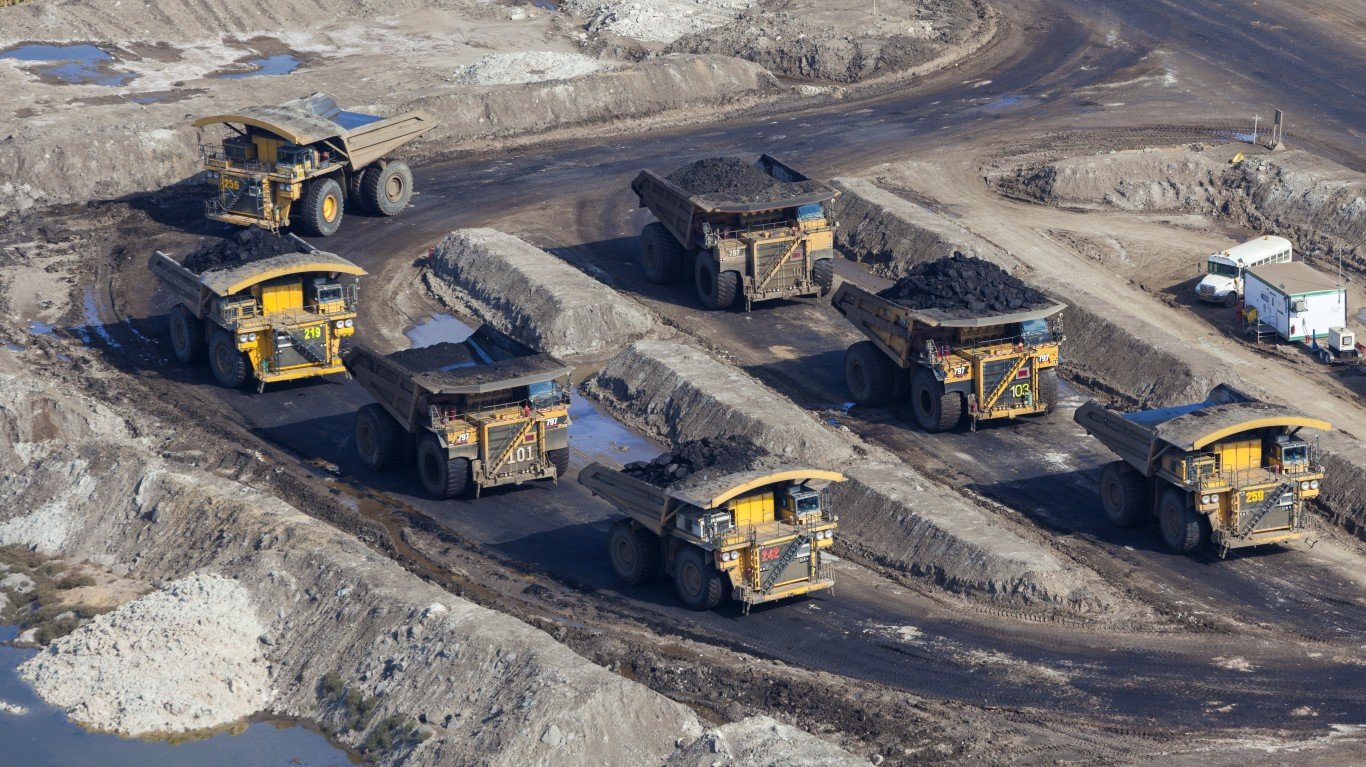
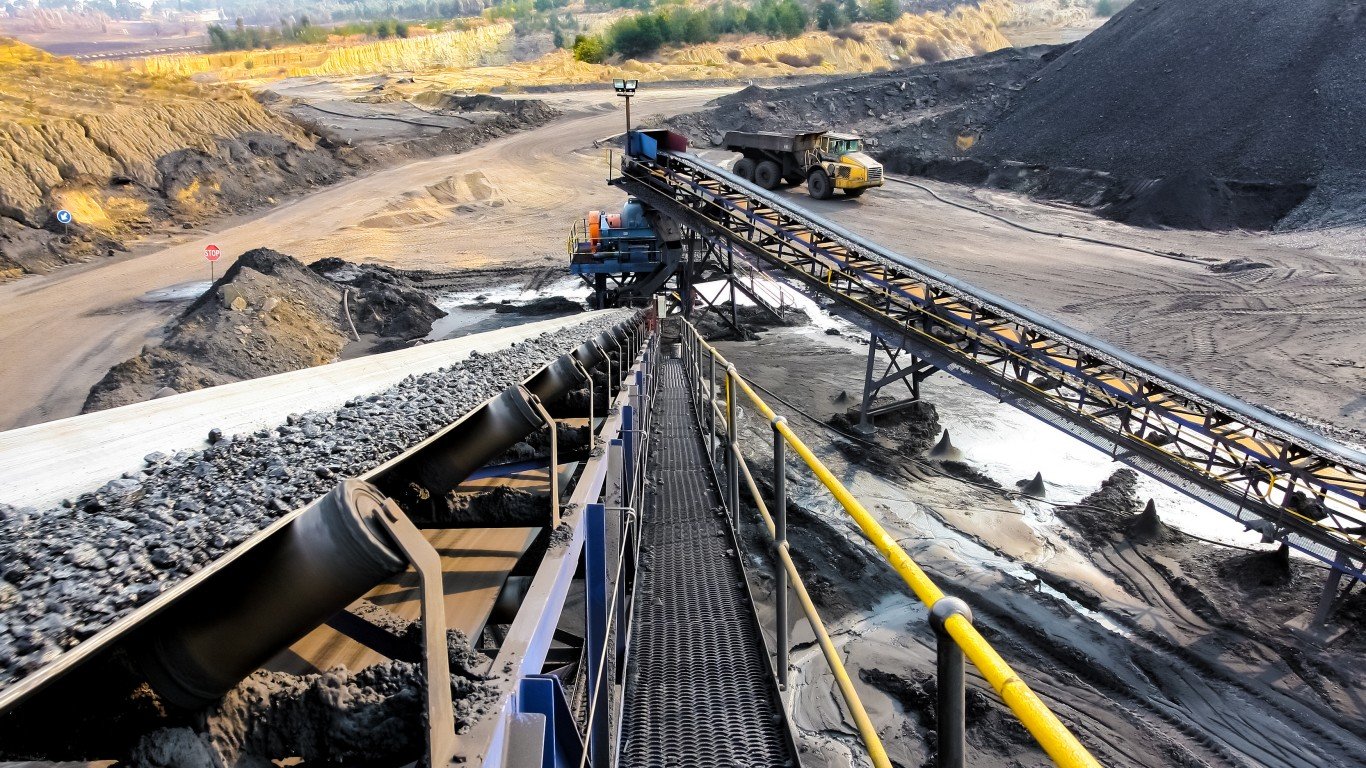
7. Coal, Australian (Energy)
> Annual price change, Jan 2022: 126.8%
> Monthly price change, Jan 2022: 16.1% – 2nd highest increase
> Price, Jan 2022 ($/metric ton): $197.0
> Price 2021 ($/metric ton): $138.1
> Price 2019 ($/metric ton): $77.9
Russia’s invasion of Ukraine disrupted global energy markets as Western countries scramble to source fossil fuels from elsewhere. This has sent the price of coal surging. Australia is a major coal exporter, ranking third behind the U.S. and Russia in the size of its coal reserves.
[in-text-ad-2]
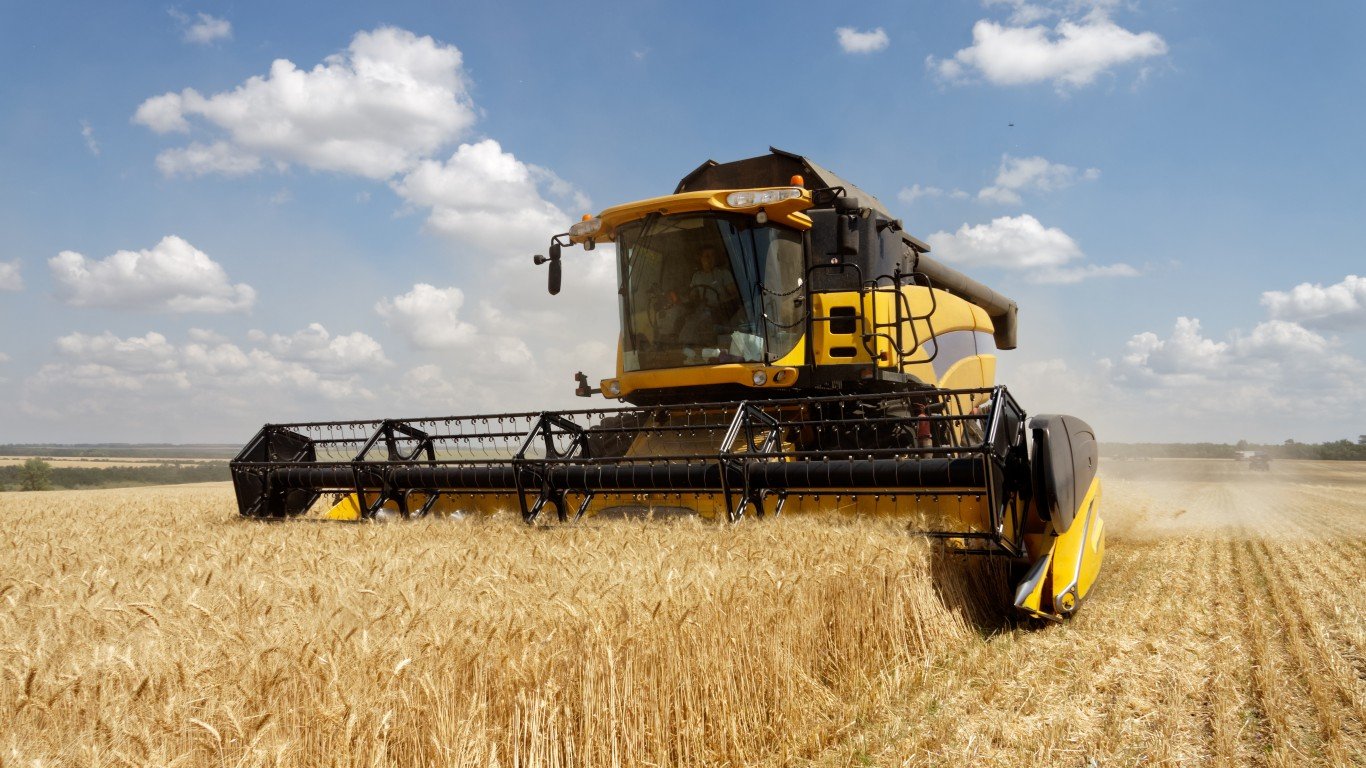
6. Wheat, US SRW (Food: Grains)
> Annual price change, May 2022: 140.1%
> Monthly price change, May 2022: -3.2% – 16th lowest decline
> Price, May 2022 ($/metric ton): $650.7
> Price 2021 ($/metric ton): $281.7
> Price 2019 ($/metric ton): $211.3
As with American hard red winter wheat (HRW), the price of American soft red winter wheat (SRW), used to make cakes, cookies, crackers, and similar confectionary products, has skyrocketed due to the disruption caused by Russia’s invasion of Ukraine. Both Russia and Ukraine are top wheat producers. The price of U.S. SRW decreased in May, in a signal the surge in grain prices appears to be slowing.
5. Phosphate rock (Fertilizers)
> Annual price change, May 2022: 148.8%
> Monthly price change, May 2022: 2.2% – 10th highest increase
> Price, May 2022 ($/metric ton): $255.0
> Price 2021 ($/metric ton): $123.2
> Price 2019 ($/metric ton): $88.0
Phosphate rock is the primary source of phosphorus used in the production of crop fertilizers and livestock feed, and its price has skyrocketed along with the products derived from it. Natural gas is also used to make nitrogen-based fertilizers, and the shock to global energy markets caused by Russia’s invasion of Ukraine has made the situation worse.
[in-text-ad]
4. Potassium chloride (Fertilizers)
> Annual price change, May 2022: 177.8%
> Monthly price change, May 2022: 0.0% – No change
> Price, May 2022 ($/metric ton): $562.5
> Price 2021 ($/metric ton): $210.2
> Price 2019 ($/metric ton): $255.5
Fertilizer prices have soared since Russia’s invasion of Ukraine. Fertilizer export bans by Russia and China exacerbated price pressure on fertilizers and the ingredients used to produce them. Potassium chloride is derived from potash and is used as a crop fertilizer. Russia and China are among the top producers of the fertilizer.
[recirclink id=1107629]
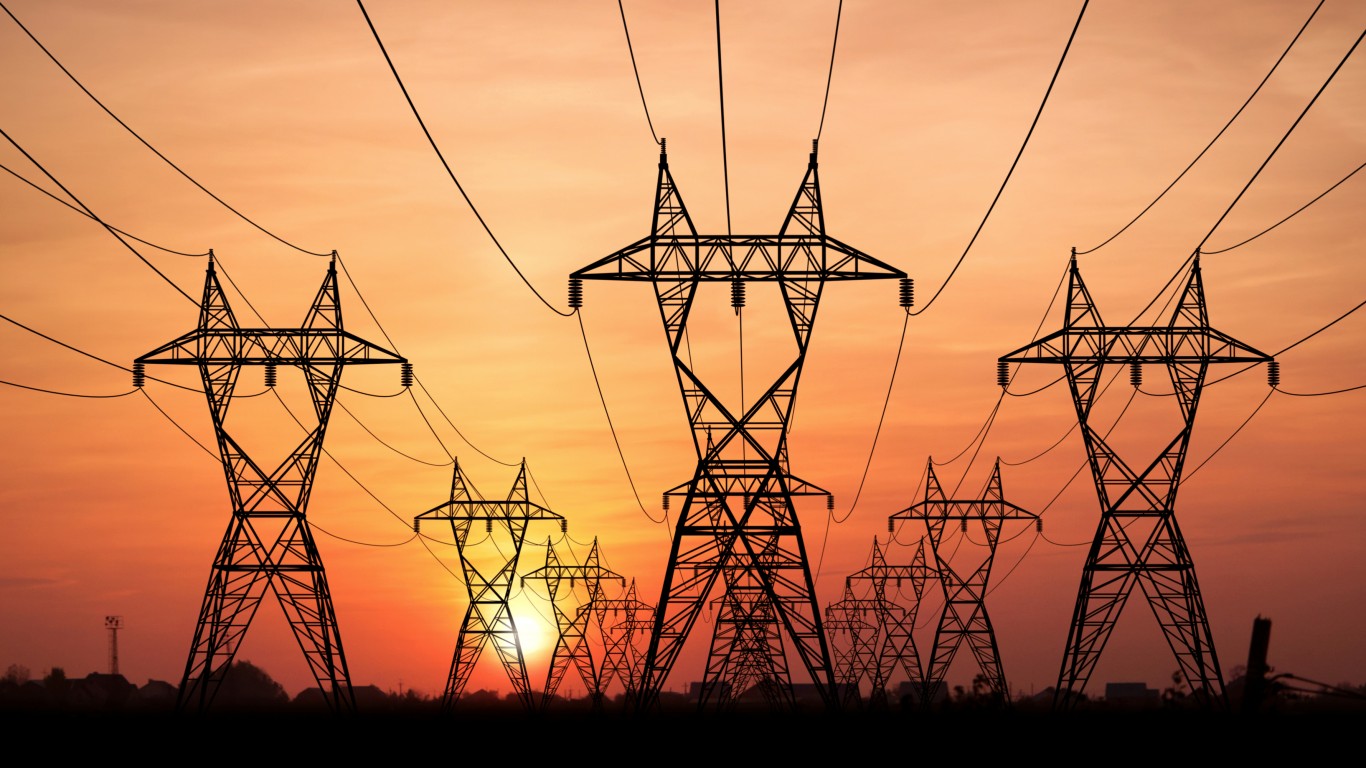
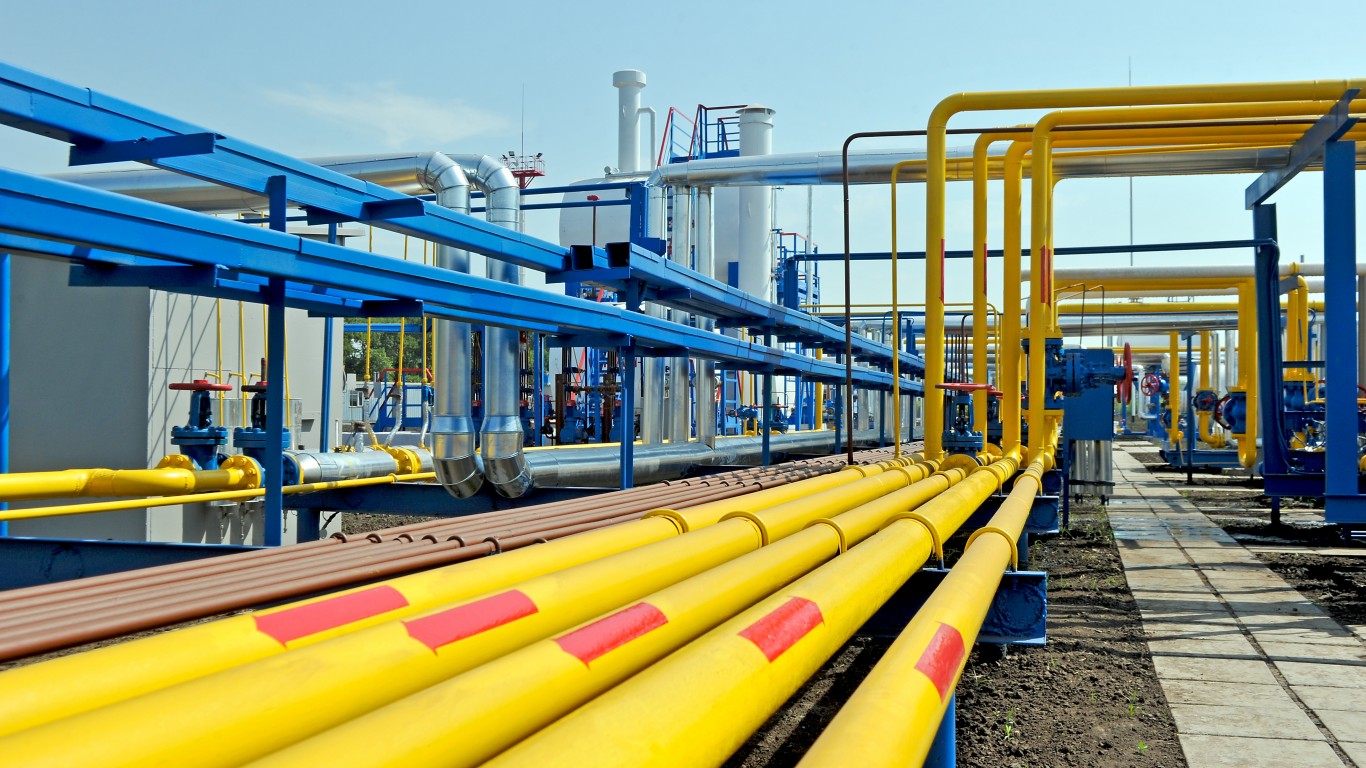
3. Natural gas, US (Energy)
> Annual price change, May 2022: 181.7%
> Monthly price change, May 2022: 24.6% – the highest increase
> Price, May 2022 ($/million British thermal units): $8.1
> Price 2021 ($/million British thermal units): $3.9
> Price 2019 ($/million British thermal units): $2.6
Heat waves across much of the U.S. have put upward pressure on natural gas prices that were already rising globally in the wake of Russia’s invasion of Ukraine and Europe’s efforts to source the fuel elsewhere. The rise in global natural gas demand has also depleted gas in storage.
2. Coal, South African (Energy)
> Annual price change, May 2022: 181.9%
> Monthly price change, May 2022: -7.3% – 17th highest decline
> Price, May 2022 ($/metric ton): $280.0
> Price 2021 ($/metric ton): $119.8
> Price 2019 ($/metric ton): $71.9
Coal prices have surged as countries attempt to adjust their supplies and demands for fossil fuels after the disruption to global energy markets caused by Russia’s invasion of Ukraine. The price of thermal coal — the coal used to power turbines that produce electricity — hit a 50-year high in early May at $400 per ton. South Africa is the world’s seventh-largest coal producer.
[in-text-ad-2]
1. Natural gas, Europe (Energy)
> Annual price change, May 2022: 235.0%
> Monthly price change, May 2022: -7.3% – 16th highest decline
> Price, May 2022 ($/million British thermal units): $29.8
> Price 2021 ($/million British thermal units): $16.1
> Price 2019 ($/million British thermal units): $4.8
European natural gas prices have surged more than any other commodity as the region struggles to adjust to sanctions on Russia and the resulting natural gas supply cuts. Russia has long been Europe’s primary provider of the fuel.
Contact [email protected] for any questions or corrections.