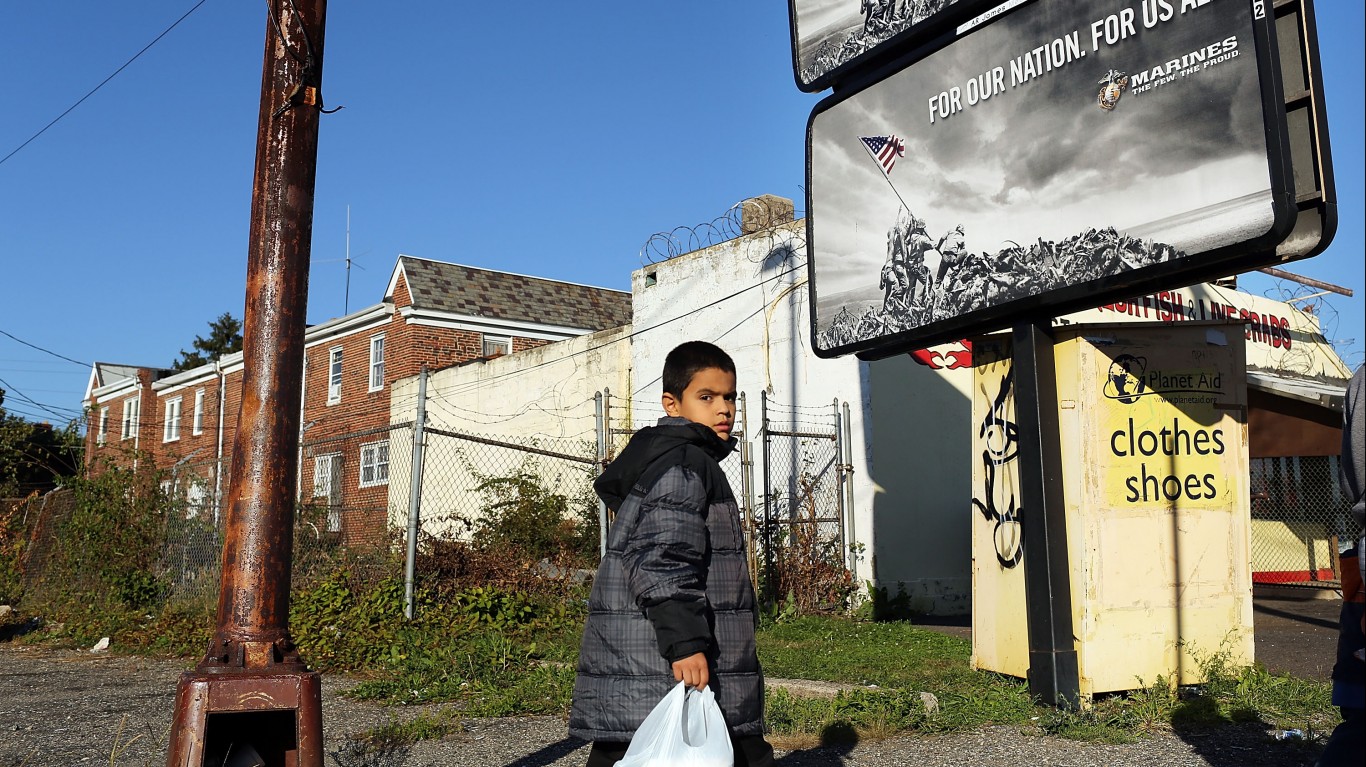
More than 40 million Americans live below the poverty line, and of those facing such financial hardship, children are disproportionately affected. Nearly 12.6 million children under age 18 live in households with poverty level income.
Not only are children at higher risk of poverty, they are also especially vulnerable to poverty’s harmful effects, both in the immediate and long-term. Childhood poverty can negatively impact brain development and has been linked with a greater likelihood of chronic illness, shorter life expectancy, and poor emotional and behavioral health. Those who spend some or all of their childhood in poverty are also less likely to succeed in school or be financially secure later in life.
Nationwide, an estimated 17.5% of children under age 18 live below the poverty line. And though the United States has one of the worst child poverty rates among wealthy, developed countries, in parts of the U.S., child poverty is considerably less common than it is nationwide.
Using data from the U.S. Census Bureau, 24/7 Wall St. identified the county and county equivalent with the lowest child poverty rate in every state.
Among the places on this list, the child poverty rate ranges from zero to 15.6% and is below the statewide child poverty rate in every case. Here is a look at the income a family needs to cover normal living expenses in every state.
Not only is child poverty less common in these places than in much of the country, but families also tend to be relatively well off. In most of the counties on this list, the median income among households with children exceeds the amount the typical household in the state earns, and in half of these counties this median exceeds $100,000. Here is a look at the richest town in every state.
Households with two parents are more likely to be financially secure than those headed by a single parent, and single-mother households are especially vulnerable to financial insecurity. In nearly every county on this list, the share of households with children headed by a single mother is below the comparable statewide share.
Click here to see the county with the lowest child poverty rate in every state
Click here to read our detailed methodology

Alabama: Shelby County
> Child poverty rate: 7.8% (Alabama: 22.7%)
> Median family income, households with children: $100,950 (Alabama: $64,790)
> Share of households with children receiving SNAP benefits: 7.0% (Alabama: 22.4%)
> Households headed by single mothers: 7.8% (Alabama: 13.3%)
> No. of counties considered in ranking: 67
[in-text-ad]

Alaska: Petersburg Borough
> Child poverty rate: 7.4% (Alaska: 13.8%)
> Median family income, households with children: $82,266 (Alaska: $88,245)
> Share of households with children receiving SNAP benefits: 8.6% (Alaska: 15.9%)
> Households headed by single mothers: 5.9% (Alaska: 10.6%)
> No. of counties considered in ranking: 20
[recirclink id=1106510]

Arizona: Greenlee County
> Child poverty rate: 14.7% (Arizona: 20.0%)
> Median family income, households with children: $71,408 (Arizona: $69,758)
> Share of households with children receiving SNAP benefits: 11.7% (Arizona: 19.3%)
> Households headed by single mothers: 7.9% (Arizona: 11.9%)
> No. of counties considered in ranking: 15

Arkansas: Saline County
> Child poverty rate: 11.0% (Arkansas: 22.0%)
> Median family income, households with children: $84,824 (Arkansas: $59,204)
> Share of households with children receiving SNAP benefits: 9.6% (Arkansas: 18.7%)
> Households headed by single mothers: 10.7% (Arkansas: 13.2%)
> No. of counties considered in ranking: 75
[in-text-ad-2]

California: San Mateo County
> Child poverty rate: 6.4% (California: 16.8%)
> Median family income, households with children: $168,996 (California: $84,790)
> Share of households with children receiving SNAP benefits: 5.6% (California: 16.1%)
> Households headed by single mothers: 6.8% (California: 10.8%)
> No. of counties considered in ranking: 56

Colorado: Douglas County
> Child poverty rate: 2.4% (Colorado: 11.5%)
> Median family income, households with children: $144,758 (Colorado: $91,425)
> Share of households with children receiving SNAP benefits: 2.1% (Colorado: 11.6%)
> Households headed by single mothers: 5.1% (Colorado: 9.0%)
> No. of counties considered in ranking: 49
[in-text-ad]

Connecticut: Tolland County
> Child poverty rate: 4.7% (Connecticut: 13.0%)
> Median family income, households with children: $118,141 (Connecticut: $100,115)
> Share of households with children receiving SNAP benefits: 9.0% (Connecticut: 15.3%)
> Households headed by single mothers: 7.6% (Connecticut: 11.4%)
> No. of counties considered in ranking: 8
[recirclink id=1047662]

Delaware: New Castle County
> Child poverty rate: 14.5% (Delaware: 17.2%)
> Median family income, households with children: $91,423 (Delaware: $79,268)
> Share of households with children receiving SNAP benefits: 16.1% (Delaware: 19.7%)
> Households headed by single mothers: 12.1% (Delaware: 12.1%)
> No. of counties considered in ranking: 3

Florida: St. Johns County
> Child poverty rate: 8.2% (Florida: 18.7%)
> Median family income, households with children: $113,321 (Florida: $65,053)
> Share of households with children receiving SNAP benefits: 9.1% (Florida: 22.7%)
> Households headed by single mothers: 7.3% (Florida: 11.4%)
> No. of counties considered in ranking: 65
[in-text-ad-2]

Georgia: Fayette County
> Child poverty rate: 4.6% (Georgia: 20.1%)
> Median family income, households with children: $112,895 (Georgia: $70,326)
> Share of households with children receiving SNAP benefits: 7.7% (Georgia: 19.6%)
> Households headed by single mothers: 8.3% (Georgia: 14.3%)
> No. of counties considered in ranking: 156

Hawaii: Kauai County
> Child poverty rate: 9.0% (Hawaii: 11.7%)
> Median family income, households with children: $86,358 (Hawaii: $91,696)
> Share of households with children receiving SNAP benefits: 17.7% (Hawaii: 17.0%)
> Households headed by single mothers: 9.9% (Hawaii: 9.7%)
> No. of counties considered in ranking: 4
[in-text-ad]

Idaho: Ada County
> Child poverty rate: 9.4% (Idaho: 14.4%)
> Median family income, households with children: $87,102 (Idaho: $69,851)
> Share of households with children receiving SNAP benefits: 9.1% (Idaho: 15.3%)
> Households headed by single mothers: 7.8% (Idaho: 8.4%)
> No. of counties considered in ranking: 40
[recirclink id=1092222]

Illinois: Woodford County
> Child poverty rate: 4.8% (Illinois: 16.2%)
> Median family income, households with children: $95,593 (Illinois: $83,907)
> Share of households with children receiving SNAP benefits: 11.8% (Illinois: 19.4%)
> Households headed by single mothers: 6.9% (Illinois: 11.7%)
> No. of counties considered in ranking: 100

Indiana: LaGrange County
> Child poverty rate: 5.0% (Indiana: 17.6%)
> Median family income, households with children: $80,141 (Indiana: $70,859)
> Share of households with children receiving SNAP benefits: 8.5% (Indiana: 16.0%)
> Households headed by single mothers: 7.8% (Indiana: 12.0%)
> No. of counties considered in ranking: 91
[in-text-ad-2]

Iowa: Dallas County
> Child poverty rate: 4.7% (Iowa: 13.3%)
> Median family income, households with children: $130,871 (Iowa: $79,139)
> Share of households with children receiving SNAP benefits: 6.5% (Iowa: 16.7%)
> Households headed by single mothers: 6.4% (Iowa: 10.3%)
> No. of counties considered in ranking: 98

Kansas: Rooks County
> Child poverty rate: 2.8% (Kansas: 13.9%)
> Median family income, households with children: $62,530 (Kansas: $74,882)
> Share of households with children receiving SNAP benefits: 9.1% (Kansas: 11.6%)
> Households headed by single mothers: 6.5% (Kansas: 10.4%)
> No. of counties considered in ranking: 90
[in-text-ad]

Kentucky: Oldham County
> Child poverty rate: 5.7% (Kentucky: 22.2%)
> Median family income, households with children: $125,227 (Kentucky: $65,096)
> Share of households with children receiving SNAP benefits: 5.4% (Kentucky: 20.8%)
> Households headed by single mothers: 7.1% (Kentucky: 12.2%)
> No. of counties considered in ranking: 119
[recirclink id=1097516]

Louisiana: Livingston Parish
> Child poverty rate: 12.8% (Louisiana: 26.3%)
> Median family income, households with children: $89,686 (Louisiana: $61,722)
> Share of households with children receiving SNAP benefits: 19.0% (Louisiana: 24.9%)
> Households headed by single mothers: 13.1% (Louisiana: 16.0%)
> No. of counties considered in ranking: 63

Maine: York County
> Child poverty rate: 8.5% (Maine: 14.0%)
> Median family income, households with children: $88,354 (Maine: $76,852)
> Share of households with children receiving SNAP benefits: 16.2% (Maine: 18.4%)
> Households headed by single mothers: 8.8% (Maine: 9.1%)
> No. of counties considered in ranking: 16
[in-text-ad-2]
Maryland: Calvert County
> Child poverty rate: 4.3% (Maryland: 11.6%)
> Median family income, households with children: $133,215 (Maryland: $103,641)
> Share of households with children receiving SNAP benefits: 7.2% (Maryland: 15.5%)
> Households headed by single mothers: 7.0% (Maryland: 12.2%)
> No. of counties considered in ranking: 24

Massachusetts: Norfolk County
> Child poverty rate: 5.4% (Massachusetts: 12.2%)
> Median family income, households with children: $154,051 (Massachusetts: $109,908)
> Share of households with children receiving SNAP benefits: 7.3% (Massachusetts: 15.8%)
> Households headed by single mothers: 7.4% (Massachusetts: 11.1%)
> No. of counties considered in ranking: 12
[in-text-ad]
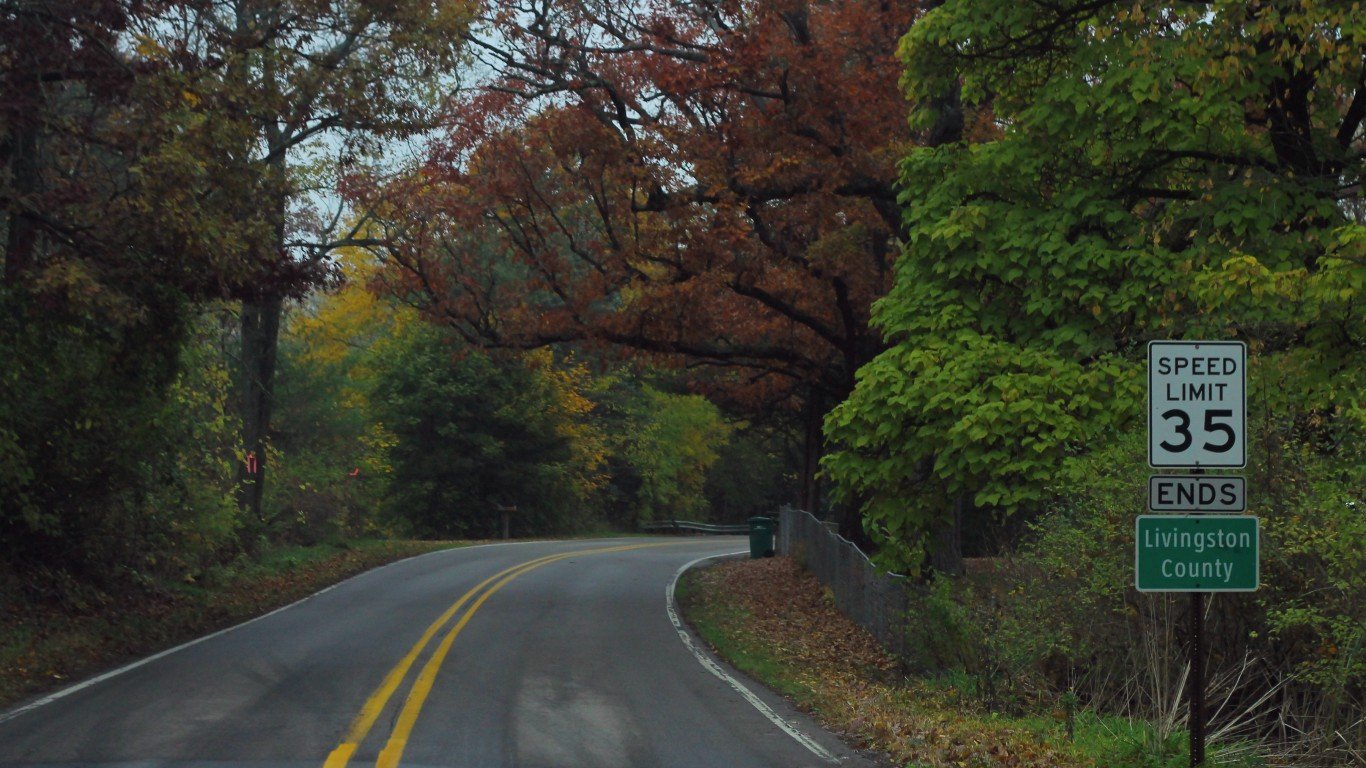
Michigan: Livingston County
> Child poverty rate: 6.1% (Michigan: 18.8%)
> Median family income, households with children: $111,746 (Michigan: $73,187)
> Share of households with children receiving SNAP benefits: 7.6% (Michigan: 19.7%)
> Households headed by single mothers: 5.4% (Michigan: 11.5%)
> No. of counties considered in ranking: 82
[recirclink id=1012509]

Minnesota: Carver County
> Child poverty rate: 2.5% (Minnesota: 11.6%)
> Median family income, households with children: $136,860 (Minnesota: $95,628)
> Share of households with children receiving SNAP benefits: 3.9% (Minnesota: 11.6%)
> Households headed by single mothers: 6.2% (Minnesota: 9.8%)
> No. of counties considered in ranking: 87
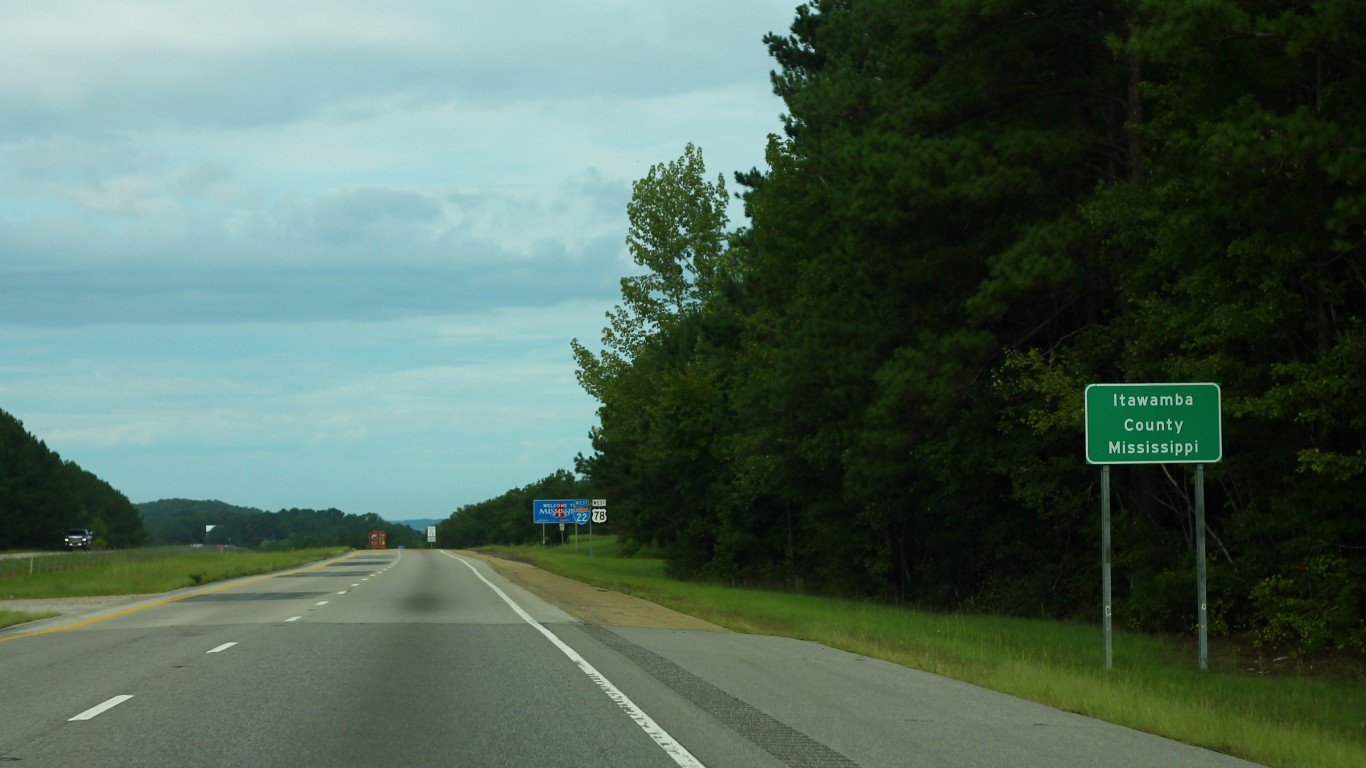
Mississippi: Itawamba County
> Child poverty rate: 8.8% (Mississippi: 27.6%)
> Median family income, households with children: $62,580 (Mississippi: $54,822)
> Share of households with children receiving SNAP benefits: 11.6% (Mississippi: 24.2%)
> Households headed by single mothers: 9.2% (Mississippi: 16.8%)
> No. of counties considered in ranking: 81
[in-text-ad-2]

Missouri: Platte County
> Child poverty rate: 5.9% (Missouri: 17.4%)
> Median family income, households with children: $105,477 (Missouri: $72,033)
> Share of households with children receiving SNAP benefits: 5.7% (Missouri: 17.2%)
> Households headed by single mothers: 9.2% (Missouri: 11.5%)
> No. of counties considered in ranking: 112

Montana: Jefferson County
> Child poverty rate: 4.7% (Montana: 15.2%)
> Median family income, households with children: $90,821 (Montana: $71,986)
> Share of households with children receiving SNAP benefits: 6.8% (Montana: 16.2%)
> Households headed by single mothers: 4.9% (Montana: 8.4%)
> No. of counties considered in ranking: 36
[in-text-ad]

Nebraska: Howard County
> Child poverty rate: 3.3% (Nebraska: 12.2%)
> Median family income, households with children: $74,569 (Nebraska: $77,982)
> Share of households with children receiving SNAP benefits: 13.5% (Nebraska: 13.9%)
> Households headed by single mothers: 8.4% (Nebraska: 10.4%)
> No. of counties considered in ranking: 70
[recirclink id=1106510]

Nevada: Douglas County
> Child poverty rate: 11.0% (Nevada: 17.6%)
> Median family income, households with children: $82,010 (Nevada: $67,738)
> Share of households with children receiving SNAP benefits: 12.0% (Nevada: 18.7%)
> Households headed by single mothers: 6.2% (Nevada: 12.8%)
> No. of counties considered in ranking: 12

New Hampshire: Rockingham County
> Child poverty rate: 5.5% (New Hampshire: 8.9%)
> Median family income, households with children: $123,394 (New Hampshire: $100,798)
> Share of households with children receiving SNAP benefits: 6.5% (New Hampshire: 11.3%)
> Households headed by single mothers: 7.1% (New Hampshire: 8.2%)
> No. of counties considered in ranking: 10
[in-text-ad-2]

New Jersey: Hunterdon County
> Child poverty rate: 3.0% (New Jersey: 13.3%)
> Median family income, households with children: $163,371 (New Jersey: $106,937)
> Share of households with children receiving SNAP benefits: 3.7% (New Jersey: 12.6%)
> Households headed by single mothers: 4.3% (New Jersey: 10.3%)
> No. of counties considered in ranking: 21

New Mexico: Sandoval County
> Child poverty rate: 15.6% (New Mexico: 25.6%)
> Median family income, households with children: $75,370 (New Mexico: $54,886)
> Share of households with children receiving SNAP benefits: 20.2% (New Mexico: 28.4%)
> Households headed by single mothers: 11.0% (New Mexico: 14.0%)
> No. of counties considered in ranking: 28
[in-text-ad]

New York: Putnam County
> Child poverty rate: 5.7% (New York: 18.7%)
> Median family income, households with children: $128,304 (New York: $83,272)
> Share of households with children receiving SNAP benefits: 3.6% (New York: 19.4%)
> Households headed by single mothers: 7.2% (New York: 12.4%)
> No. of counties considered in ranking: 62
[recirclink id=1047662]

North Carolina: Clay County
> Child poverty rate: 8.3% (North Carolina: 20.0%)
> Median family income, households with children: $47,176 (North Carolina: $68,688)
> Share of households with children receiving SNAP benefits: 16.4% (North Carolina: 20.0%)
> Households headed by single mothers: 4.0% (North Carolina: 12.5%)
> No. of counties considered in ranking: 99

North Dakota: Dickey County
> Child poverty rate: 3.3% (North Dakota: 11.1%)
> Median family income, households with children: $93,750 (North Dakota: $86,414)
> Share of households with children receiving SNAP benefits: 9.8% (North Dakota: 10.9%)
> Households headed by single mothers: 3.2% (North Dakota: 9.2%)
> No. of counties considered in ranking: 33
[in-text-ad-2]

Ohio: Geauga County
> Child poverty rate: 5.2% (Ohio: 19.1%)
> Median family income, households with children: $110,638 (Ohio: $72,130)
> Share of households with children receiving SNAP benefits: 6.8% (Ohio: 19.8%)
> Households headed by single mothers: 3.7% (Ohio: 12.8%)
> No. of counties considered in ranking: 88

Oklahoma: Canadian County
> Child poverty rate: 10.2% (Oklahoma: 20.7%)
> Median family income, households with children: $85,301 (Oklahoma: $62,535)
> Share of households with children receiving SNAP benefits: 11.4% (Oklahoma: 20.6%)
> Households headed by single mothers: 9.0% (Oklahoma: 12.5%)
> No. of counties considered in ranking: 77
[in-text-ad]

Oregon: Clackamas County
> Child poverty rate: 7.1% (Oregon: 15.0%)
> Median family income, households with children: $103,718 (Oregon: $78,939)
> Share of households with children receiving SNAP benefits: 12.1% (Oregon: 21.6%)
> Households headed by single mothers: 8.3% (Oregon: 9.9%)
> No. of counties considered in ranking: 32
[recirclink id=1092222]

Pennsylvania: Bucks County
> Child poverty rate: 6.7% (Pennsylvania: 16.7%)
> Median family income, households with children: $121,616 (Pennsylvania: $81,257)
> Share of households with children receiving SNAP benefits: 7.9% (Pennsylvania: 20.3%)
> Households headed by single mothers: 7.8% (Pennsylvania: 11.1%)
> No. of counties considered in ranking: 66

Rhode Island: Bristol County
> Child poverty rate: 4.5% (Rhode Island: 15.6%)
> Median family income, households with children: $123,237 (Rhode Island: $83,161)
> Share of households with children receiving SNAP benefits: 5.3% (Rhode Island: 21.0%)
> Households headed by single mothers: 7.6% (Rhode Island: 12.5%)
> No. of counties considered in ranking: 5
[in-text-ad-2]

South Carolina: York County
> Child poverty rate: 12.2% (South Carolina: 21.2%)
> Median family income, households with children: $89,601 (South Carolina: $64,942)
> Share of households with children receiving SNAP benefits: 12.9% (South Carolina: 20.0%)
> Households headed by single mothers: 11.9% (South Carolina: 13.4%)
> No. of counties considered in ranking: 46

South Dakota: Stanley County
> Child poverty rate: 0.0% reported (South Dakota: 16.1%)
> Median family income, households with children: $94,234 (South Dakota: $76,789)
> Share of households with children receiving SNAP benefits: 0.0% reported (South Dakota: 15.8%)
> Households headed by single mothers: 5.3% (South Dakota: 10.3%)
> No. of counties considered in ranking: 55
[in-text-ad]

Tennessee: Williamson County
> Child poverty rate: 4.4% (Tennessee: 20.8%)
> Median family income, households with children: $137,829 (Tennessee: $65,852)
> Share of households with children receiving SNAP benefits: 3.8% (Tennessee: 20.9%)
> Households headed by single mothers: 6.4% (Tennessee: 12.4%)
> No. of counties considered in ranking: 93
[recirclink id=1097516]

Texas: Rockwall County
> Child poverty rate: 4.9% (Texas: 20.0%)
> Median family income, households with children: $116,647 (Texas: $71,693)
> Share of households with children receiving SNAP benefits: 5.5% (Texas: 19.3%)
> Households headed by single mothers: 6.9% (Texas: 13.2%)
> No. of counties considered in ranking: 221

Utah: Summit County
> Child poverty rate: 4.0% (Utah: 9.9%)
> Median family income, households with children: $121,343 (Utah: $84,298)
> Share of households with children receiving SNAP benefits: 1.5% (Utah: 9.4%)
> Households headed by single mothers: 6.7% (Utah: 7.7%)
> No. of counties considered in ranking: 23
[in-text-ad-2]

Vermont: Grand Isle County
> Child poverty rate: 7.1% (Vermont: 12.3%)
> Median family income, households with children: $91,964 (Vermont: $81,902)
> Share of households with children receiving SNAP benefits: 15.3% (Vermont: 15.2%)
> Households headed by single mothers: 6.9% (Vermont: 9.5%)
> No. of counties considered in ranking: 14

Virginia: Goochland County
> Child poverty rate: 2.4% (Virginia: 13.1%)
> Median family income, households with children: $114,842 (Virginia: $93,828)
> Share of households with children receiving SNAP benefits: 11.3% (Virginia: 13.1%)
> Households headed by single mothers: 4.7% (Virginia: 10.8%)
> No. of counties considered in ranking: 124
[in-text-ad]

Washington: Pend Oreille County
> Child poverty rate: 7.8% (Washington: 12.6%)
> Median family income, households with children: $76,468 (Washington: $90,447)
> Share of households with children receiving SNAP benefits: 24.0% (Washington: 16.0%)
> Households headed by single mothers: 6.3% (Washington: 9.4%)
> No. of counties considered in ranking: 36
[recirclink id=1012509]

West Virginia: Pleasants County
> Child poverty rate: 6.6% (West Virginia: 23.1%)
> Median family income, households with children: $67,500 (West Virginia: $59,938)
> Share of households with children receiving SNAP benefits: 25.6% (West Virginia: 26.8%)
> Households headed by single mothers: 7.8% (West Virginia: 10.3%)
> No. of counties considered in ranking: 54

Wisconsin: Ozaukee County
> Child poverty rate: 4.5% (Wisconsin: 14.2%)
> Median family income, households with children: $117,944 (Wisconsin: $81,197)
> Share of households with children receiving SNAP benefits: 3.5% (Wisconsin: 16.6%)
> Households headed by single mothers: 6.2% (Wisconsin: 10.2%)
> No. of counties considered in ranking: 72
[in-text-ad-2]

Wyoming: Lincoln County
> Child poverty rate: 7.4% (Wyoming: 12.3%)
> Median family income, households with children: $89,938 (Wyoming: $80,825)
> Share of households with children receiving SNAP benefits: 4.4% (Wyoming: 9.2%)
> Households headed by single mothers: 4.3% (Wyoming: 8.7%)
> No. of counties considered in ranking: 20
Methodology
To determine the county or county equivalent in every state where the most children live in poverty, 24/7 Wall St. reviewed five-year estimates of child poverty rates from the U.S. Census Bureau’s 2020 American Community Survey.
Counties were excluded if the child poverty rate was not available in the 2020 ACS, if the number of children for whom poverty status was determined was lower than 500, or if the sampling error associated with a county’s data was deemed too high.
The sampling error was defined as too high if the coefficient of variation — a statistical assessment of how reliable an estimate is — for a county’s child poverty rate was above 15% and greater than two standard deviations above the mean CV for all counties’ child poverty rates. We similarly excluded counties that had a sampling error too high for their population, using the same definition.
Countries were ranked based on the share of children living in poverty. To break ties, we used the number of children living in poverty.
Additional information on median income for families with children, the share of households with children receiving benefits from the Supplemental Nutrition Assistance Program, and the share of households headed by single mothers are also five-year estimates from the 2020 ACS. Because the Census Bureau didn’t release one-year estimates for 2020 due to data collection issues caused by the COVID-19 pandemic, all ACS data are five-year estimates.
Contact [email protected] for any questions or corrections.