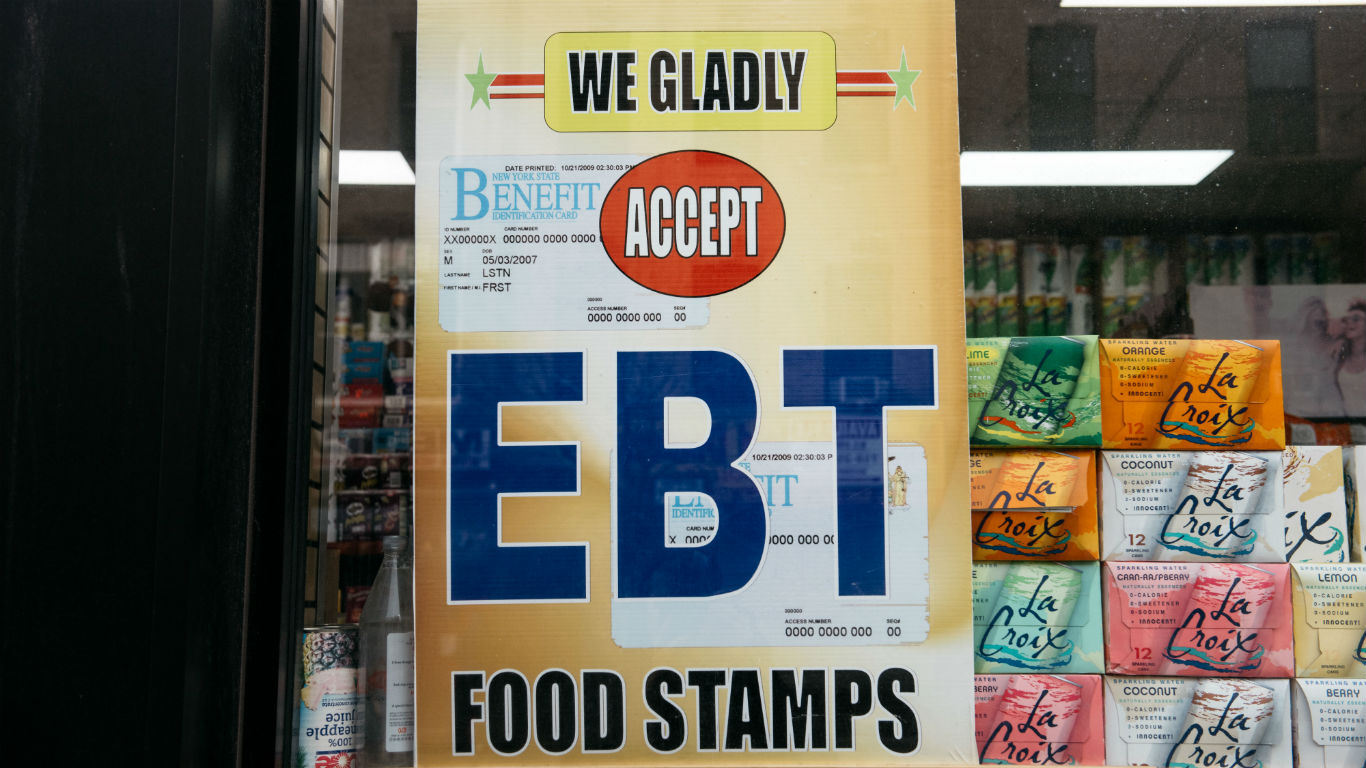
The number of Americans relying on government assistance for basic needs has been on the rise. According to the latest Census data, 12.4% of American households, nearly 16 million in all, received Supplemental Nutrition Assistance Program benefits in 2021. This marks a substantial increase of 2.7 million households — or 1.7 percentage points — from 10.7% of households, or 13.2 million total, in 2019, the most recent comparable period. Given the effects the COVID-19 shutdown had on the economy, this increase in SNAP recipients, formerly known as food stamps, was to be expected.
To find the 50 metropolitan areas with the highest SNAP recipiency rates, 24/7 Wall St. reviewed one-year estimates of the share of households that received SNAP benefits in the past 12 months from the U.S. Census Bureau’s 2021 American Community Survey, released this September. Among the 50 metro areas on this list, the share of households receiving SNAP benefits ranges from 18.3% of households to more than 30%.
While several criteria, including assets and household composition, determine eligibility for SNAP benefits, the main determinant is income. As a result, metros with lower incomes and higher poverty rates tend to have more households receiving benefits. (Not cities, but these are America’s poorest towns.)
The 50 metros on this list are found in 19 states, with California and Louisiana tying for the most representation, with six metropolitan areas each. Georgia is third, with five. As poverty in the United States is especially concentrated in the South, half the 50 metropolitan areas on this list are in the South. (Find out if any of these cities are also among America’s cities with the widest income gaps.)
Because income is the primary determinant for SNAP recipiency, and because unemployment highly affects income, areas with high unemployment tend to have higher SNAP recipiency. Of the 50 metropolitan areas on the list, 39 have 2021 annual unemployment rates at or above the 2021 national rate of 6.3%. This includes the two metro areas with the highest unemployment rates in the country last year, both in California — El Centro and Merced. Both also have unemployment rates greater than 14% and SNAP recipiency rates well in excess of 20%
Click here to see 50 cities with huge populations living on food stamps.
Click here to see our detailed methodology.

50. Bakersfield, CA
> Households receiving SNAP benefits: 18.5%
> Poverty rate: 18.6% — 42nd highest of 367 metros
> Median household income: $58,217 — 119th lowest of 367 metros
> Unemployment rate: 9.9% — 15th highest of 367 metros
> Total population: 917,673 — 62nd highest of 367 metros
[in-text-ad]

49. Kennewick-Richland, WA
> Households receiving SNAP benefits: 18.6%
> Poverty rate: 11.2% — 107th lowest of 367 metros
> Median household income: $78,367 — 52nd highest of 367 metros
> Unemployment rate: 4.2% — 73rd lowest of 367 metros
> Total population: 308,293 — 165th highest of 367 metros
[recirclink id=1168052]

48. Miami-Fort Lauderdale-Pompano Beach, FL
> Households receiving SNAP benefits: 18.6%
> Poverty rate: 13.3% — 172nd highest of 367 metros
> Median household income: $63,814 — 162nd highest of 367 metros
> Unemployment rate: 6.3% — 125th highest of 367 metros
> Total population: 6,091,747 — 9th highest of 367 metros
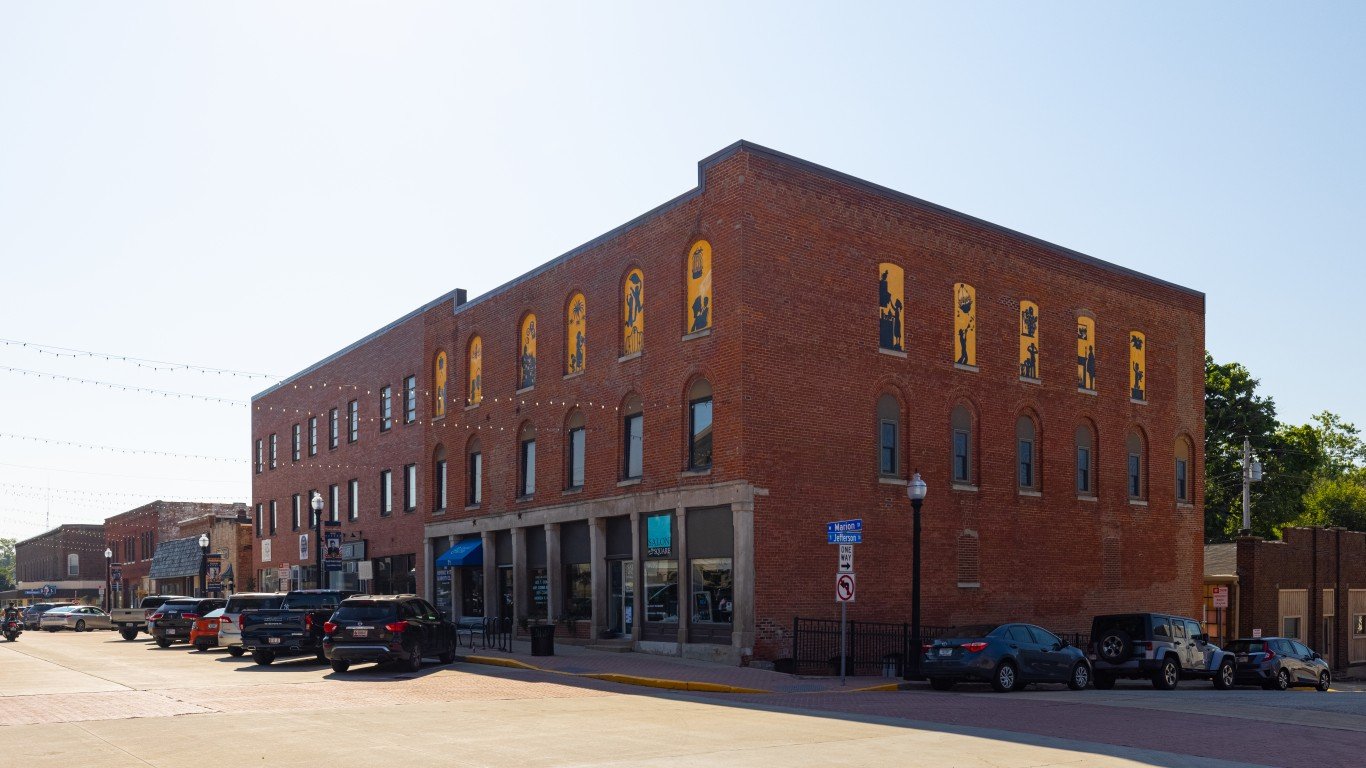
47. Danville, IL
> Households receiving SNAP benefits: 18.7%
> Poverty rate: 20.9% — 17th highest of 367 metros
> Median household income: $49,091 — 28th lowest of 367 metros
> Unemployment rate: 6.6% — 106th highest of 367 metros
> Total population: 73,095 — 2nd lowest of 367 metros
[in-text-ad-2]

46. Fayetteville, NC
> Households receiving SNAP benefits: 18.7%
> Poverty rate: 14.8% — 118th highest of 367 metros
> Median household income: $55,027 — 76th lowest of 367 metros
> Unemployment rate: 7.0% — 85th highest of 367 metros
> Total population: 524,588 — 108th highest of 367 metros

45. Greenville, NC
> Households receiving SNAP benefits: 18.7%
> Poverty rate: 22.5% — 9th highest of 367 metros
> Median household income: $44,450 — 5th lowest of 367 metros
> Unemployment rate: 9.2% — 21st highest of 367 metros
> Total population: 172,169 — 117th lowest of 367 metros
[in-text-ad]

44. Baton Rouge, LA
> Households receiving SNAP benefits: 19.0%
> Poverty rate: 17.0% — 68th highest of 367 metros
> Median household income: $58,276 — 122nd lowest of 367 metros
> Unemployment rate: 7.8% — 47th highest of 367 metros
> Total population: 871,905 — 66th highest of 367 metros
[recirclink id=1167045]

43. Shreveport-Bossier City, LA
> Households receiving SNAP benefits: 19.1%
> Poverty rate: 21.4% — 15th highest of 367 metros
> Median household income: $48,164 — 22nd lowest of 367 metros
> Unemployment rate: 8.9% — 25th highest of 367 metros
> Total population: 389,155 — 140th highest of 367 metros

42. Charleston, WV
> Households receiving SNAP benefits: 19.2%
> Poverty rate: 17.0% — 69th highest of 367 metros
> Median household income: $53,549 — 62nd lowest of 367 metros
> Unemployment rate: 6.2% — 132nd highest of 367 metros
> Total population: 252,942 — 177th lowest of 367 metros
[in-text-ad-2]

41. Pueblo, CO
> Households receiving SNAP benefits: 19.4%
> Poverty rate: 16.3% — 88th highest of 367 metros
> Median household income: $56,689 — 94th lowest of 367 metros
> Unemployment rate: 6.5% — 110th highest of 367 metros
> Total population: 169,622 — 114th lowest of 367 metros

40. Mobile, AL
> Households receiving SNAP benefits: 19.5%
> Poverty rate: 17.9% — 53rd highest of 367 metros
> Median household income: $49,691 — 31st lowest of 367 metros
> Unemployment rate: 7.0% — 84th highest of 367 metros
> Total population: 430,714 — 126th highest of 367 metros
[in-text-ad]

39. Eugene-Springfield, OR
> Households receiving SNAP benefits: 19.5%
> Poverty rate: 14.3% — 131st highest of 367 metros
> Median household income: $61,712 — 175th lowest of 367 metros
> Unemployment rate: 7.2% — 76th highest of 367 metros
> Total population: 383,189 — 146th highest of 367 metros
[recirclink id=1133674]
38. Valdosta, GA
> Households receiving SNAP benefits: 19.6%
> Poverty rate: 27.6% — 2nd highest of 367 metros
> Median household income: $42,233 — 2nd lowest of 367 metros
> Unemployment rate: 7.1% — 80th highest of 367 metros
> Total population: 147,916 — 83rd lowest of 367 metros

37. Erie, PA
> Households receiving SNAP benefits: 19.6%
> Poverty rate: 16.5% — 82nd highest of 367 metros
> Median household income: $56,851 — 98th lowest of 367 metros
> Unemployment rate: 7.6% — 60th highest of 367 metros
> Total population: 269,011 — 183rd highest of 367 metros
[in-text-ad-2]

36. Saginaw, MI
> Households receiving SNAP benefits: 19.6%
> Poverty rate: 21.8% — 13th highest of 367 metros
> Median household income: $50,606 — 39th lowest of 367 metros
> Unemployment rate: 8.1% — 39th highest of 367 metros
> Total population: 189,591 — 137th lowest of 367 metros

35. Longview, WA
> Households receiving SNAP benefits: 19.6%
> Poverty rate: 12.3% — 148th lowest of 367 metros
> Median household income: $71,194 — 93rd highest of 367 metros
> Unemployment rate: 5.2% — 151st lowest of 367 metros
> Total population: 111,524 — 31st lowest of 367 metros
[in-text-ad]
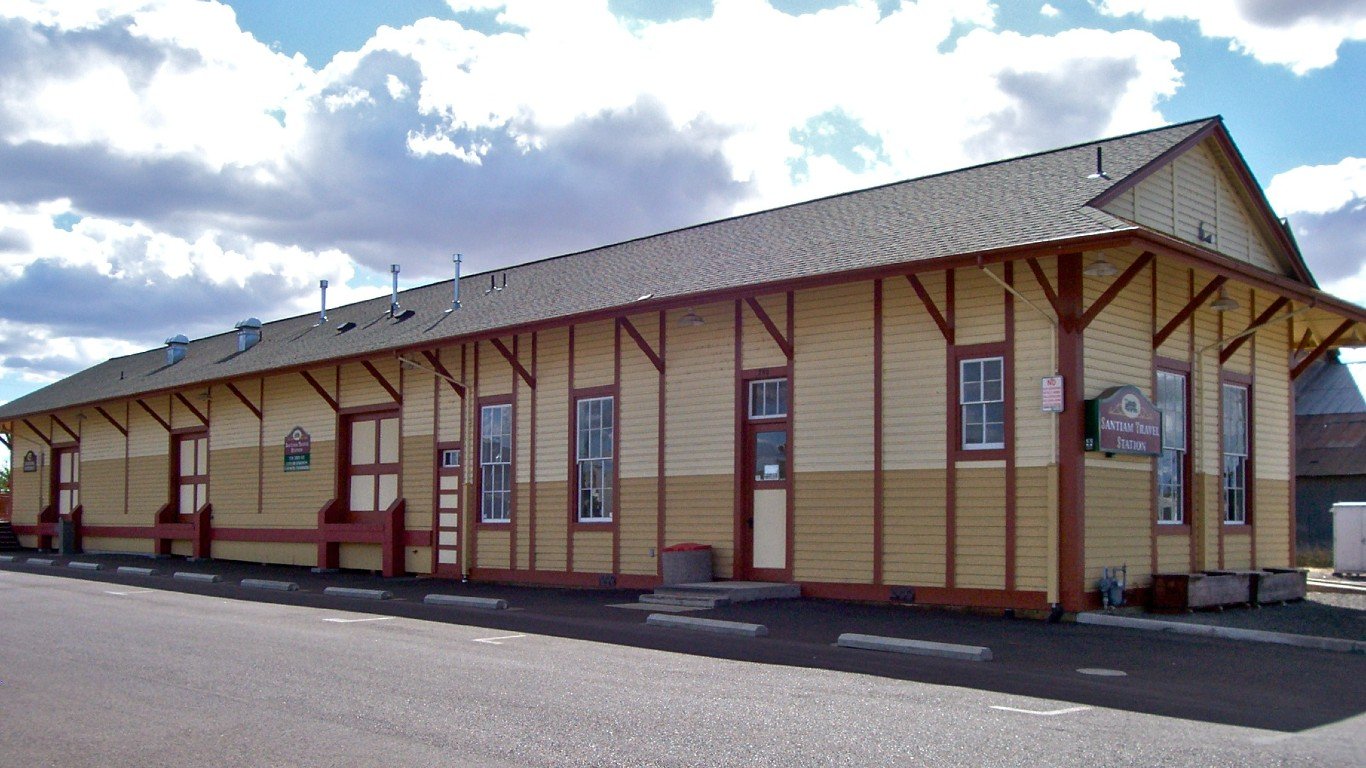
34. Albany-Lebanon, OR
> Households receiving SNAP benefits: 19.6%
> Poverty rate: 11.6% — 120th lowest of 367 metros
> Median household income: $65,196 — 144th highest of 367 metros
> Unemployment rate: 6.9% — 87th highest of 367 metros
> Total population: 129,839 — 58th lowest of 367 metros
[recirclink id=1139581]
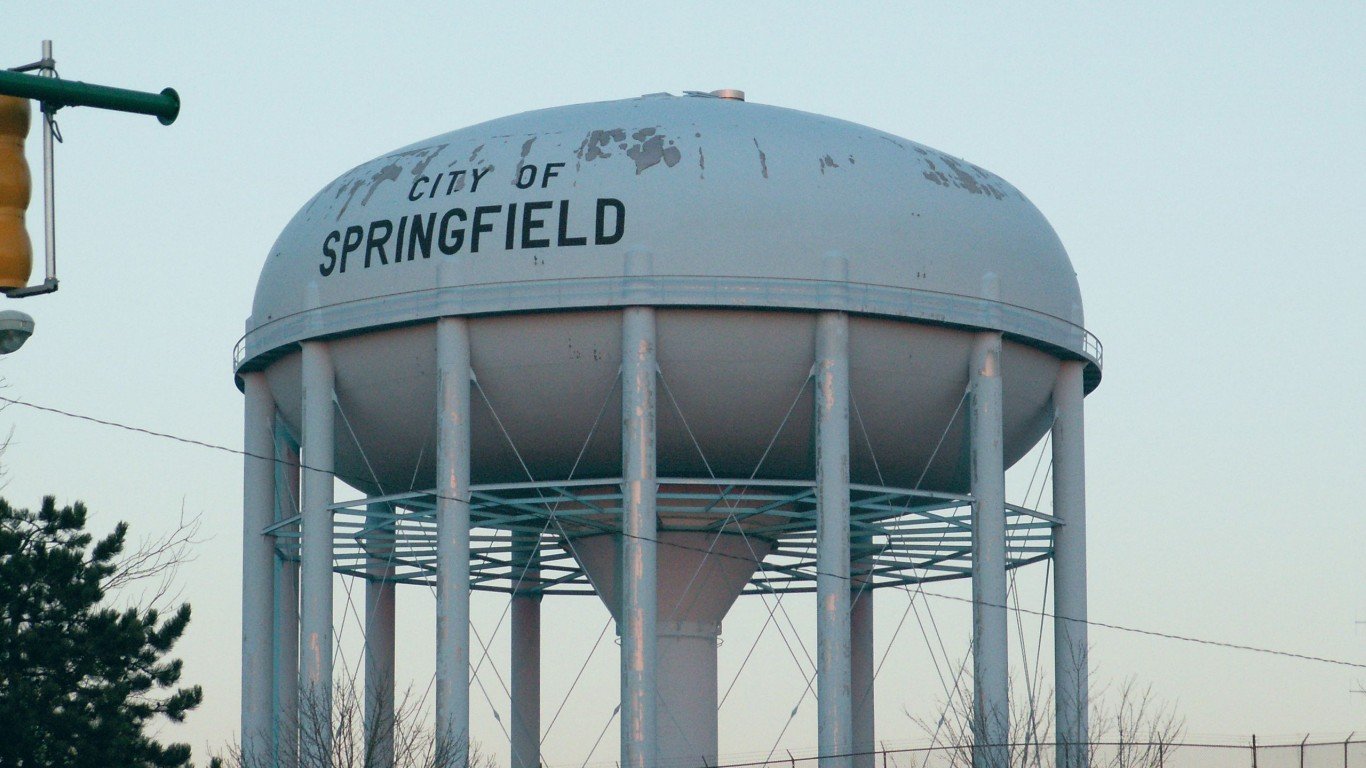
33. Springfield, OH
> Households receiving SNAP benefits: 19.8%
> Poverty rate: 16.3% — 89th highest of 367 metros
> Median household income: $59,431 — 139th lowest of 367 metros
> Unemployment rate: 6.1% — 144th highest of 367 metros
> Total population: 135,633 — 66th lowest of 367 metros
32. Madera, CA
> Households receiving SNAP benefits: 19.9%
> Poverty rate: 21.8% — 14th highest of 367 metros
> Median household income: $63,454 — 168th highest of 367 metros
> Unemployment rate: 13.8% — 3rd highest of 367 metros
> Total population: 159,410 — 102nd lowest of 367 metros
[in-text-ad-2]

31. Sumter, SC
> Households receiving SNAP benefits: 20.0%
> Poverty rate: 20.3% — 21st highest of 367 metros
> Median household income: $43,210 — 3rd lowest of 367 metros
> Unemployment rate: 8.6% — 33rd highest of 367 metros
> Total population: 135,782 — 67th lowest of 367 metros

30. Monroe, LA
> Households receiving SNAP benefits: 20.0%
> Poverty rate: 27.2% — 3rd highest of 367 metros
> Median household income: $45,001 — 7th lowest of 367 metros
> Unemployment rate: 10.0% — 14th highest of 367 metros
> Total population: 204,884 — 145th lowest of 367 metros
[in-text-ad]

29. Rockford, IL
> Households receiving SNAP benefits: 20.1%
> Poverty rate: 14.3% — 134th highest of 367 metros
> Median household income: $56,746 — 95th lowest of 367 metros
> Unemployment rate: 10.6% — 8th highest of 367 metros
> Total population: 336,278 — 155th highest of 367 metros
[recirclink id=1099722]

28. Lima, OH
> Households receiving SNAP benefits: 20.1%
> Poverty rate: 15.5% — 102nd highest of 367 metros
> Median household income: $51,497 — 46th lowest of 367 metros
> Unemployment rate: 8.2% — 37th highest of 367 metros
> Total population: 101,670 — 20th lowest of 367 metros

27. Springfield, MA
> Households receiving SNAP benefits: 20.1%
> Poverty rate: 15.4% — 106th highest of 367 metros
> Median household income: $65,520 — 139th highest of 367 metros
> Unemployment rate: 7.7% — 52nd highest of 367 metros
> Total population: 695,305 — 87th highest of 367 metros
[in-text-ad-2]

26. Decatur, IL
> Households receiving SNAP benefits: 20.4%
> Poverty rate: 17.6% — 58th highest of 367 metros
> Median household income: $46,807 — 12th lowest of 367 metros
> Unemployment rate: 11.1% — 5th highest of 367 metros
> Total population: 102,432 — 21st lowest of 367 metros

25. Salem, OR
> Households receiving SNAP benefits: 20.6%
> Poverty rate: 12.7% — 173rd lowest of 367 metros
> Median household income: $65,665 — 136th highest of 367 metros
> Unemployment rate: 5.4% — 177th lowest of 367 metros
> Total population: 436,283 — 125th highest of 367 metros
[in-text-ad]

24. Hinesville, GA
> Households receiving SNAP benefits: 20.7%
> Poverty rate: 19.3% — 36th highest of 367 metros
> Median household income: $49,733 — 33rd lowest of 367 metros
> Unemployment rate: 5.5% — 184th highest of 367 metros
> Total population: 79,371 — 4th lowest of 367 metros
[recirclink id=1168052]

23. Alexandria, LA
> Households receiving SNAP benefits: 20.7%
> Poverty rate: 19.9% — 25th highest of 367 metros
> Median household income: $47,032 — 14th lowest of 367 metros
> Unemployment rate: 7.0% — 83rd highest of 367 metros
> Total population: 150,890 — 86th lowest of 367 metros

22. Fresno, CA
> Households receiving SNAP benefits: 20.7%
> Poverty rate: 19.5% — 30th highest of 367 metros
> Median household income: $63,656 — 167th highest of 367 metros
> Unemployment rate: 9.1% — 22nd highest of 367 metros
> Total population: 1,013,581 — 55th highest of 367 metros
[in-text-ad-2]

21. Macon-Bibb County, GA
> Households receiving SNAP benefits: 20.8%
> Poverty rate: 20.8% — 18th highest of 367 metros
> Median household income: $53,397 — 61st lowest of 367 metros
> Unemployment rate: 7.5% — 61st highest of 367 metros
> Total population: 232,775 — 169th lowest of 367 metros

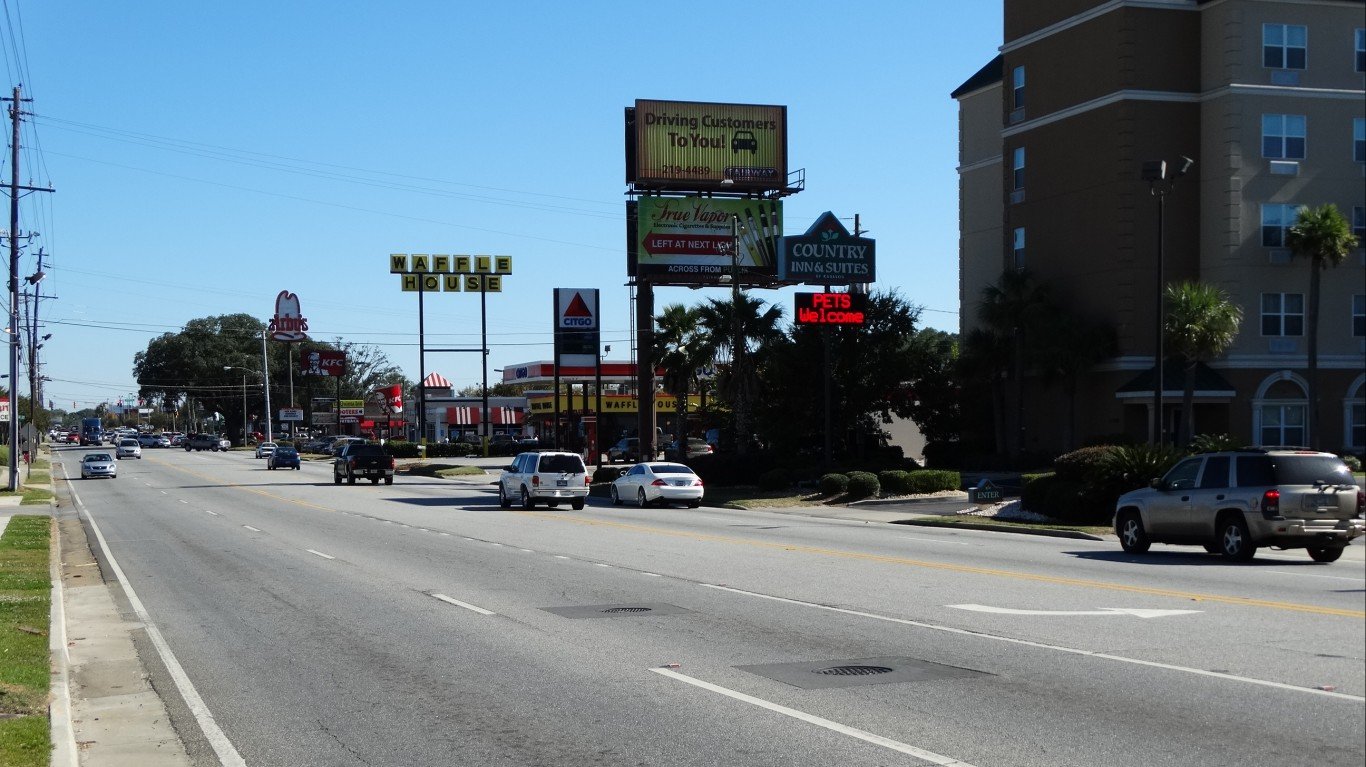
20. Florence, SC
> Households receiving SNAP benefits: 20.9%
> Poverty rate: 19.3% — 37th highest of 367 metros
> Median household income: $49,724 — 32nd lowest of 367 metros
> Unemployment rate: 5.1% — 146th lowest of 367 metros
> Total population: 199,259 — 142nd lowest of 367 metros
[in-text-ad]

19. El Paso, TX
> Households receiving SNAP benefits: 21.0%
> Poverty rate: 20.1% — 23rd highest of 367 metros
> Median household income: $51,002 — 41st lowest of 367 metros
> Unemployment rate: 7.9% — 43rd highest of 367 metros
> Total population: 871,727 — 67th highest of 367 metros
[recirclink id=1167045]

18. Albany, GA
> Households receiving SNAP benefits: 21.0%
> Poverty rate: 18.7% — 41st highest of 367 metros
> Median household income: $48,659 — 24th lowest of 367 metros
> Unemployment rate: 7.6% — 55th highest of 367 metros
> Total population: 146,961 — 82nd lowest of 367 metros

17. Columbus, GA-AL
> Households receiving SNAP benefits: 22.0%
> Poverty rate: 19.5% — 32nd highest of 367 metros
> Median household income: $52,802 — 58th lowest of 367 metros
> Unemployment rate: 6.3% — 123rd highest of 367 metros
> Total population: 326,491 — 161st highest of 367 metros
[in-text-ad-2]

16. Beckley, WV
> Households receiving SNAP benefits: 22.1%
> Poverty rate: 22.7% — 8th highest of 367 metros
> Median household income: $38,737 — the lowest of 367 metros
> Unemployment rate: 7.0% — 86th highest of 367 metros
> Total population: 113,698 — 35th lowest of 367 metros

15. Merced, CA
> Households receiving SNAP benefits: 22.2%
> Poverty rate: 23.5% — 6th highest of 367 metros
> Median household income: $53,992 — 66th lowest of 367 metros
> Unemployment rate: 14.7% — the highest of 367 metros
> Total population: 286,461 — 174th highest of 367 metros
[in-text-ad]

14. Yuma, AZ
> Households receiving SNAP benefits: 22.3%
> Poverty rate: 16.9% — 70th highest of 367 metros
> Median household income: $57,304 — 106th lowest of 367 metros
> Unemployment rate: 8.6% — 34th highest of 367 metros
> Total population: 206,990 — 150th lowest of 367 metros
[recirclink id=1133674]

13. Rocky Mount, NC
> Households receiving SNAP benefits: 22.3%
> Poverty rate: 15.1% — 110th highest of 367 metros
> Median household income: $51,769 — 48th lowest of 367 metros
> Unemployment rate: 5.7% — 171st highest of 367 metros
> Total population: 143,535 — 78th lowest of 367 metros

12. Hammond, LA
> Households receiving SNAP benefits: 22.5%
> Poverty rate: 15.4% — 105th highest of 367 metros
> Median household income: $52,872 — 59th lowest of 367 metros
> Unemployment rate: 5.0% — 134th lowest of 367 metros
> Total population: 135,217 — 65th lowest of 367 metros
[in-text-ad-2]

11. Lake Charles, LA
> Households receiving SNAP benefits: 22.9%
> Poverty rate: 18.7% — 40th highest of 367 metros
> Median household income: $58,736 — 128th lowest of 367 metros
> Unemployment rate: 4.0% — 68th lowest of 367 metros
> Total population: 208,680 — 154th lowest of 367 metros

10. Yakima, WA
> Households receiving SNAP benefits: 23.9%
> Poverty rate: 14.0% — 144th highest of 367 metros
> Median household income: $61,012 — 165th lowest of 367 metros
> Unemployment rate: 9.5% — 17th highest of 367 metros
> Total population: 256,035 — 178th lowest of 367 metros
[in-text-ad]

9. Visalia, CA
> Households receiving SNAP benefits: 24.4%
> Poverty rate: 18.6% — 43rd highest of 367 metros
> Median household income: $58,209 — 117th lowest of 367 metros
> Unemployment rate: 10.1% — 13th highest of 367 metros
> Total population: 477,054 — 119th highest of 367 metros
[recirclink id=1139581]

8. Las Cruces, NM
> Households receiving SNAP benefits: 24.6%
> Poverty rate: 19.4% — 35th highest of 367 metros
> Median household income: $45,178 — 8th lowest of 367 metros
> Unemployment rate: 7.2% — 77th highest of 367 metros
> Total population: 221,508 — 159th lowest of 367 metros

7. Grants Pass, OR
> Households receiving SNAP benefits: 24.7%
> Poverty rate: 16.7% — 78th highest of 367 metros
> Median household income: $48,785 — 26th lowest of 367 metros
> Unemployment rate: 9.7% — 16th highest of 367 metros
> Total population: 88,346 — 12th lowest of 367 metros
[in-text-ad-2]
6. Goldsboro, NC
> Households receiving SNAP benefits: 25.5%
> Poverty rate: 19.9% — 24th highest of 367 metros
> Median household income: $47,595 — 16th lowest of 367 metros
> Unemployment rate: 4.6% — 99th lowest of 367 metros
> Total population: 116,835 — 41st lowest of 367 metros
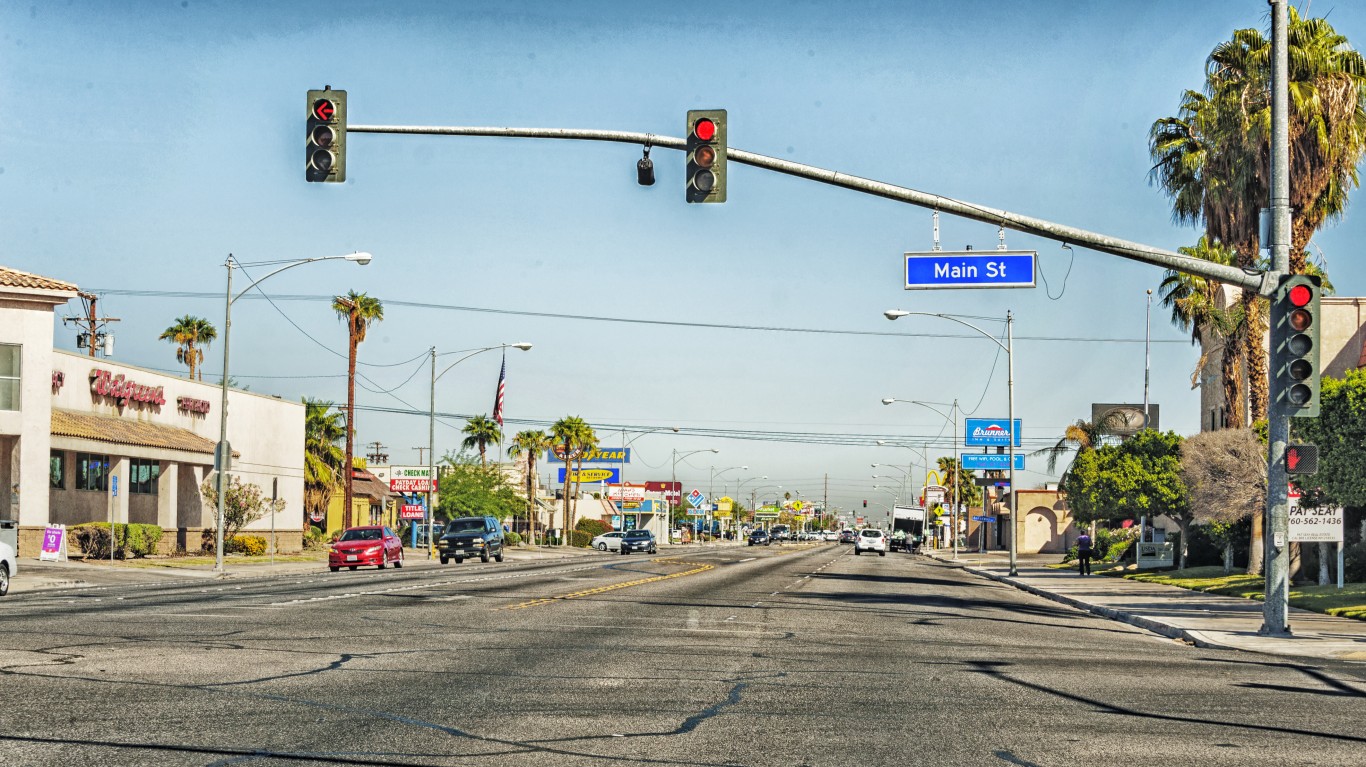
5. El Centro, CA
> Households receiving SNAP benefits: 25.9%
> Poverty rate: 16.4% — 86th highest of 367 metros
> Median household income: $51,809 — 49th lowest of 367 metros
> Unemployment rate: 14.5% — 2nd highest of 367 metros
> Total population: 179,851 — 127th lowest of 367 metros
[in-text-ad]
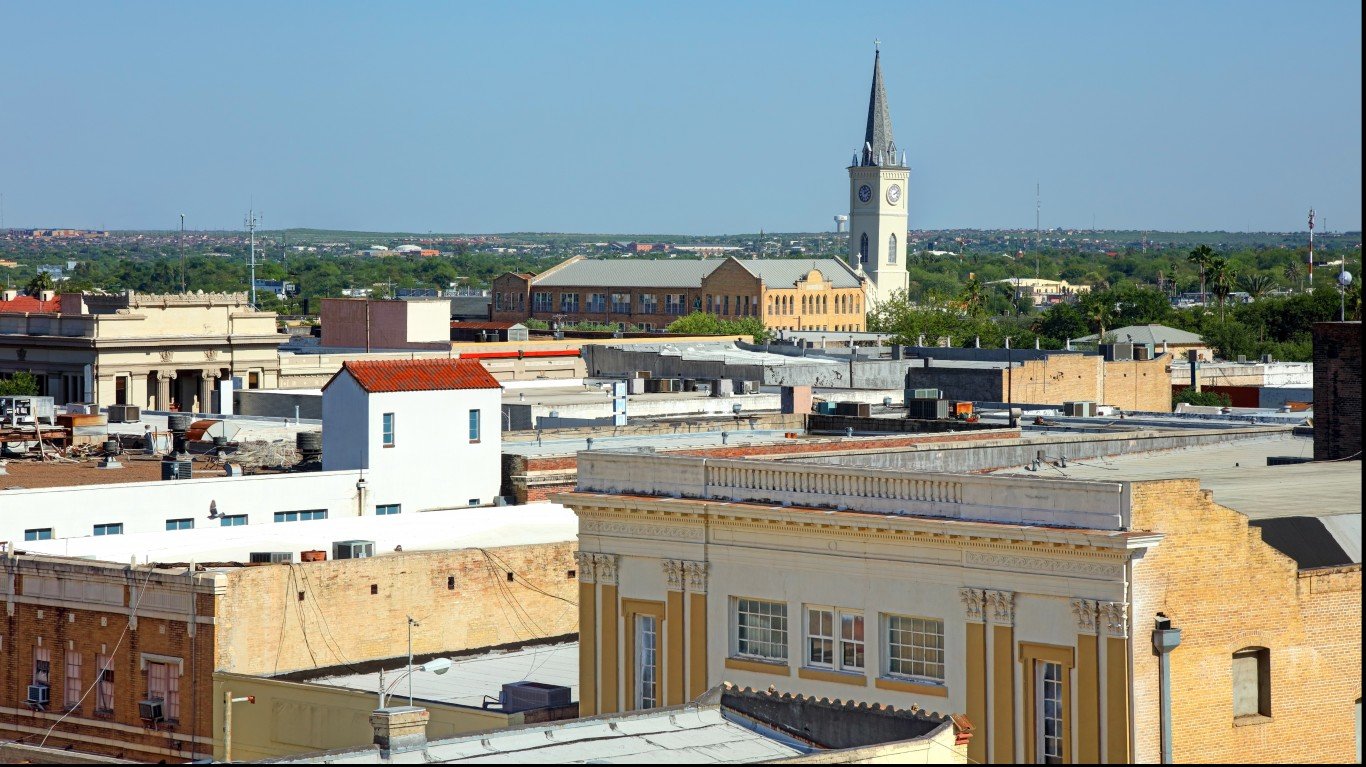
4. Laredo, TX
> Households receiving SNAP benefits: 26.0%
> Poverty rate: 22.4% — 10th highest of 367 metros
> Median household income: $51,867 — 50th lowest of 367 metros
> Unemployment rate: 6.4% — 120th highest of 367 metros
> Total population: 267,945 — 183rd lowest of 367 metros
[recirclink id=1099722]
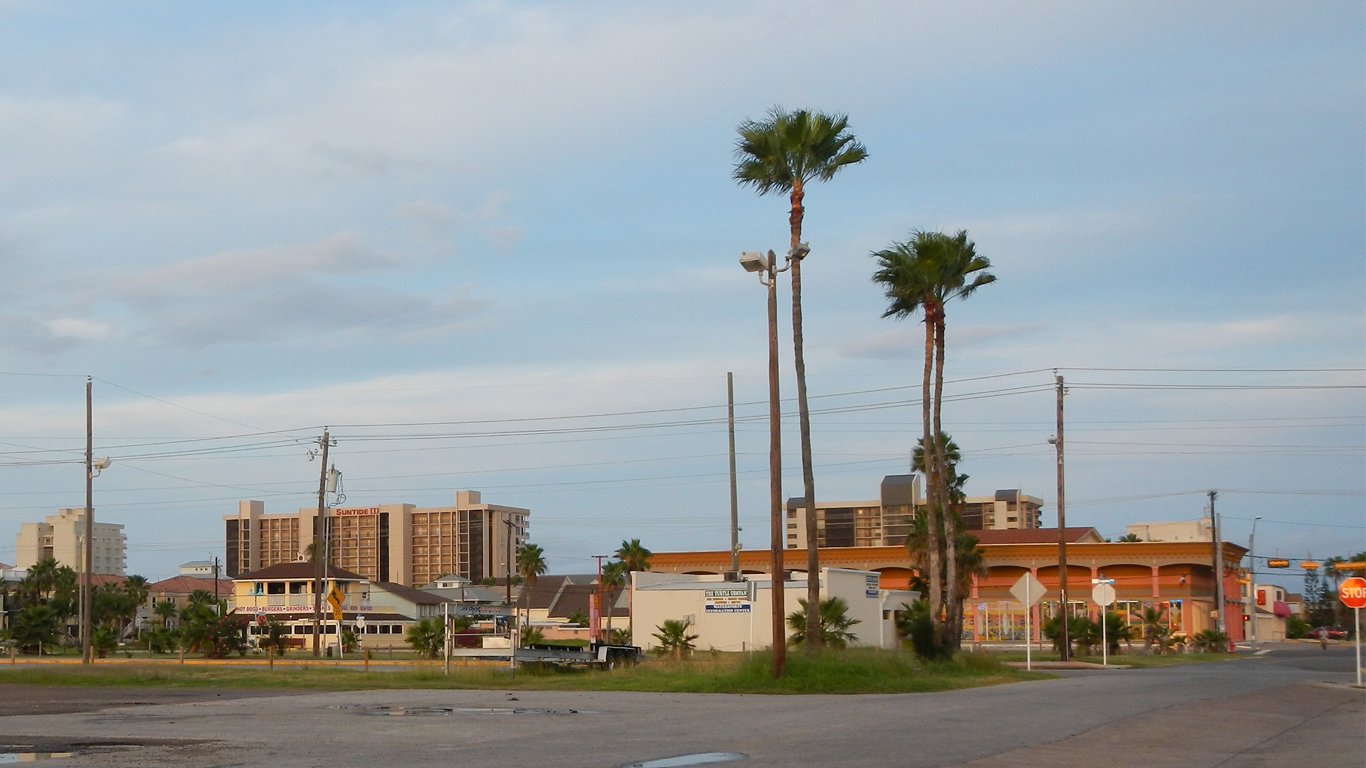
3. Brownsville-Harlingen, TX
> Households receiving SNAP benefits: 26.6%
> Poverty rate: 24.7% — 5th highest of 367 metros
> Median household income: $48,115 — 21st lowest of 367 metros
> Unemployment rate: 8.1% — 38th highest of 367 metros
> Total population: 423,029 — 131st highest of 367 metros

2. Farmington, NM
> Households receiving SNAP benefits: 28.4%
> Poverty rate: 26.7% — 4th highest of 367 metros
> Median household income: $47,819 — 19th lowest of 367 metros
> Unemployment rate: 10.5% — 9th highest of 367 metros
> Total population: 120,993 — 47th lowest of 367 metros
[in-text-ad-2]

1. McAllen-Edinburg-Mission, TX
> Households receiving SNAP benefits: 30.9%
> Poverty rate: 29.3% — the highest of 367 metros
> Median household income: $44,818 — 6th lowest of 367 metros
> Unemployment rate: 9.0% — 23rd highest of 367 metros
> Total population: 880,356 — 65th highest of 367 metros
Methodology
To determine the metros with the highest SNAP recipiency rates, 24/7 Wall St. reviewed one-year estimates of the share of households that received SNAP benefits in the past 12 months from the U.S. Census Bureau’s 2021 American Community Survey. The 50 Metros on this list had the highest SNAP recipiency rates out of the 386 for which data is available through the census. To break ties, we used the number of households that received SNAP benefits in the past 12 months. Additional information on poverty rate, unemployment rate, and median household income are also one-year estimates from the 2021 ACS.
Contact [email protected] for any questions or corrections.