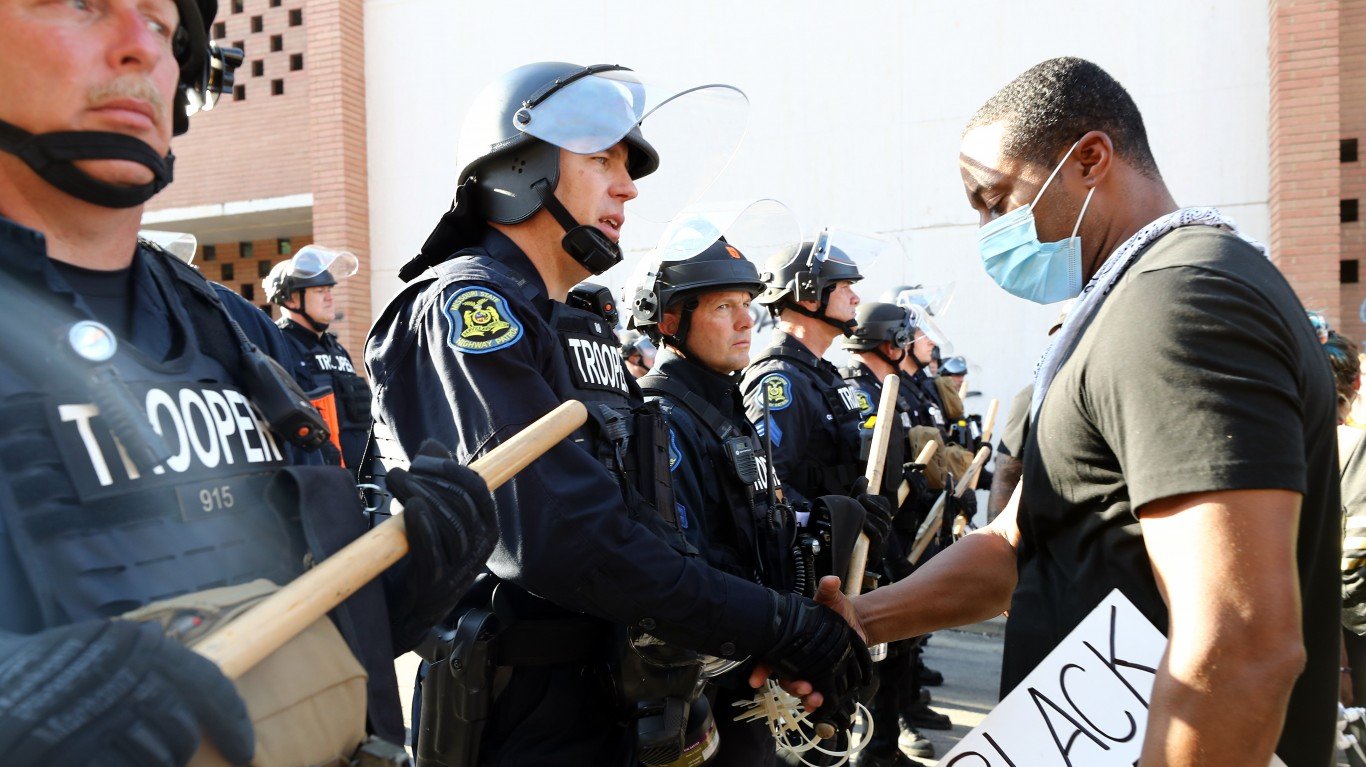
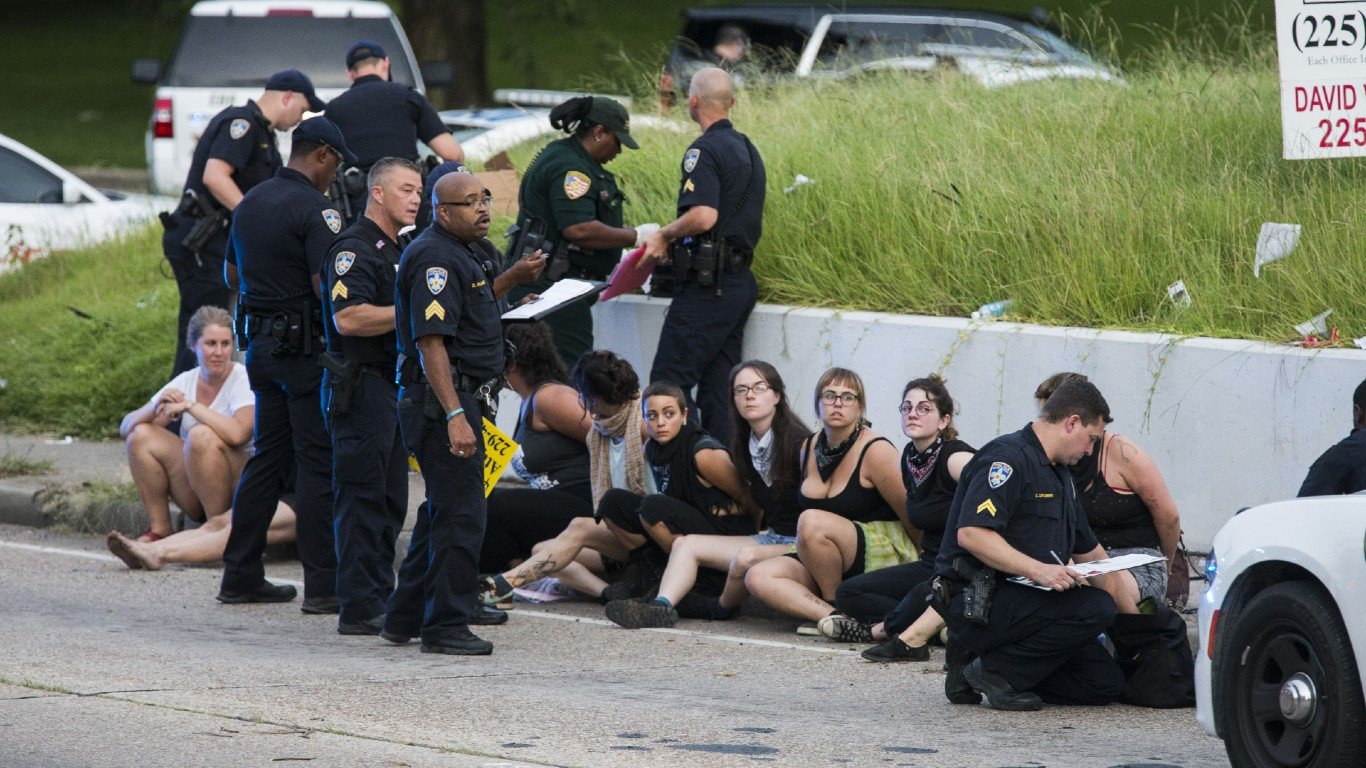
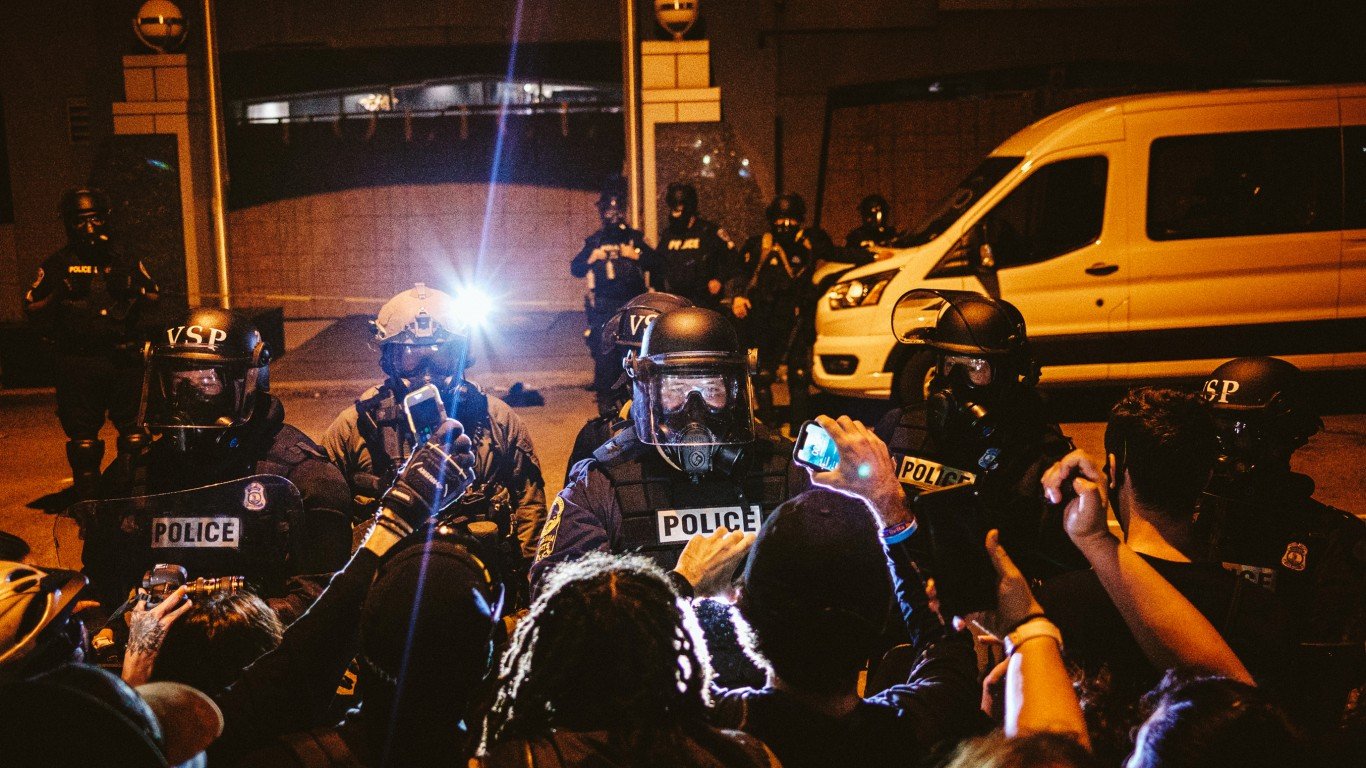
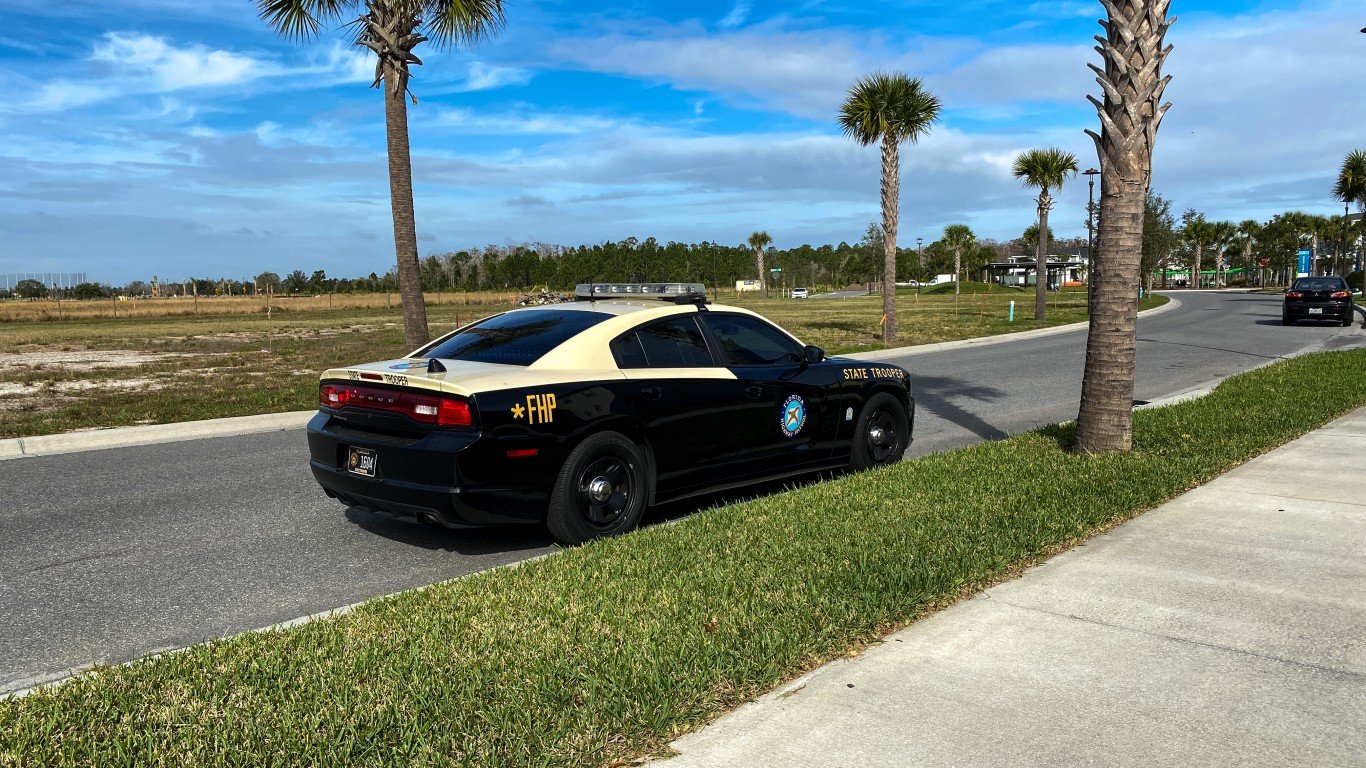
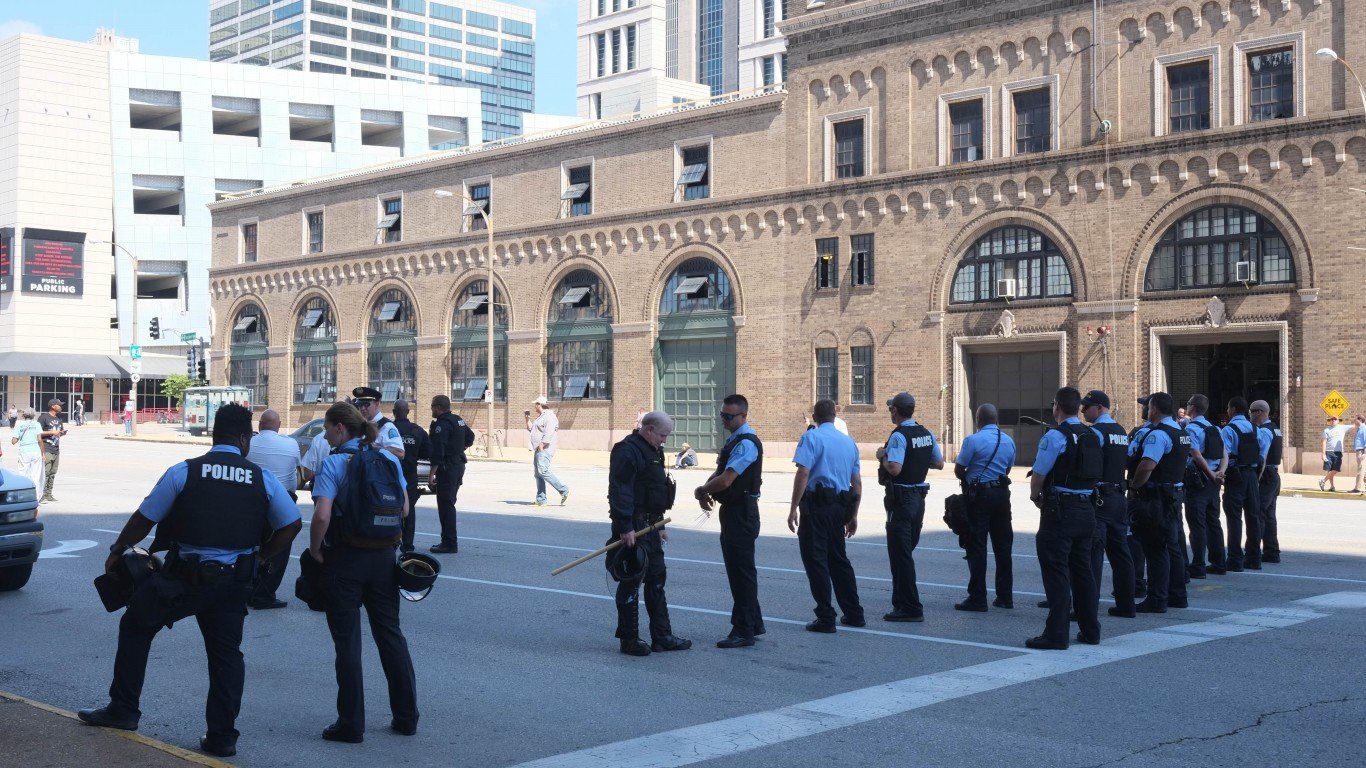
Police departments across the country have faced rapidly shifting public sentiment in recent years. The 2020 murder of George Floyd by a police officer spawned large-scale protests and calls to defund the police in communities across the United States at a time when violent crime rates – particularly homicide – were on the rise.
Up against these and other social and political pressures, law enforcement agencies nationwide are also dealing with recruitment challenges and rising rates of attrition. One national survey of about 200 U.S. police departments found that retirements surged by 45% and resignations climbed by 18% from April 2020 to April 2021.
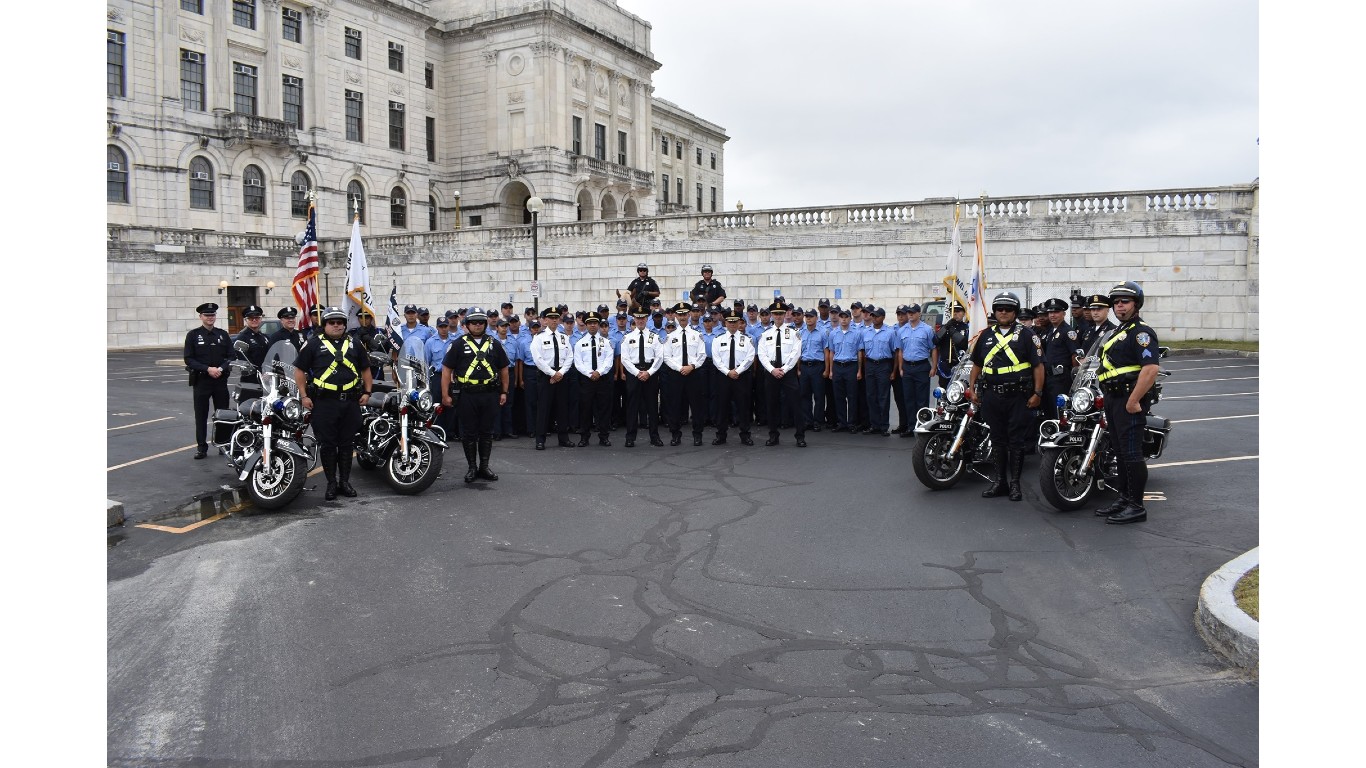
While some communities are struggling with police staffing shortages, many U.S. cities have managed to avoid those problems and still employ a relatively large police force.
Using data from the FBI, 24/7 Wall St. identified America’s most heavily policed cities. Cities are ranked by the total number of police officers – excluding civilian police employees – for every 1,000 people in their department’s jurisdiction. Only places with at least 50,000 residents were considered.
Across all U.S. cities, there are 2.2 police officers for every 1,000 people on average. Among the cities on this list, the number of police ranges from about 2.5 per 1,000 to 5.3 per 1,000. The cities on this list are located almost exclusively in the South and the Northeast. (Here is a look at the states with the most police officers.)
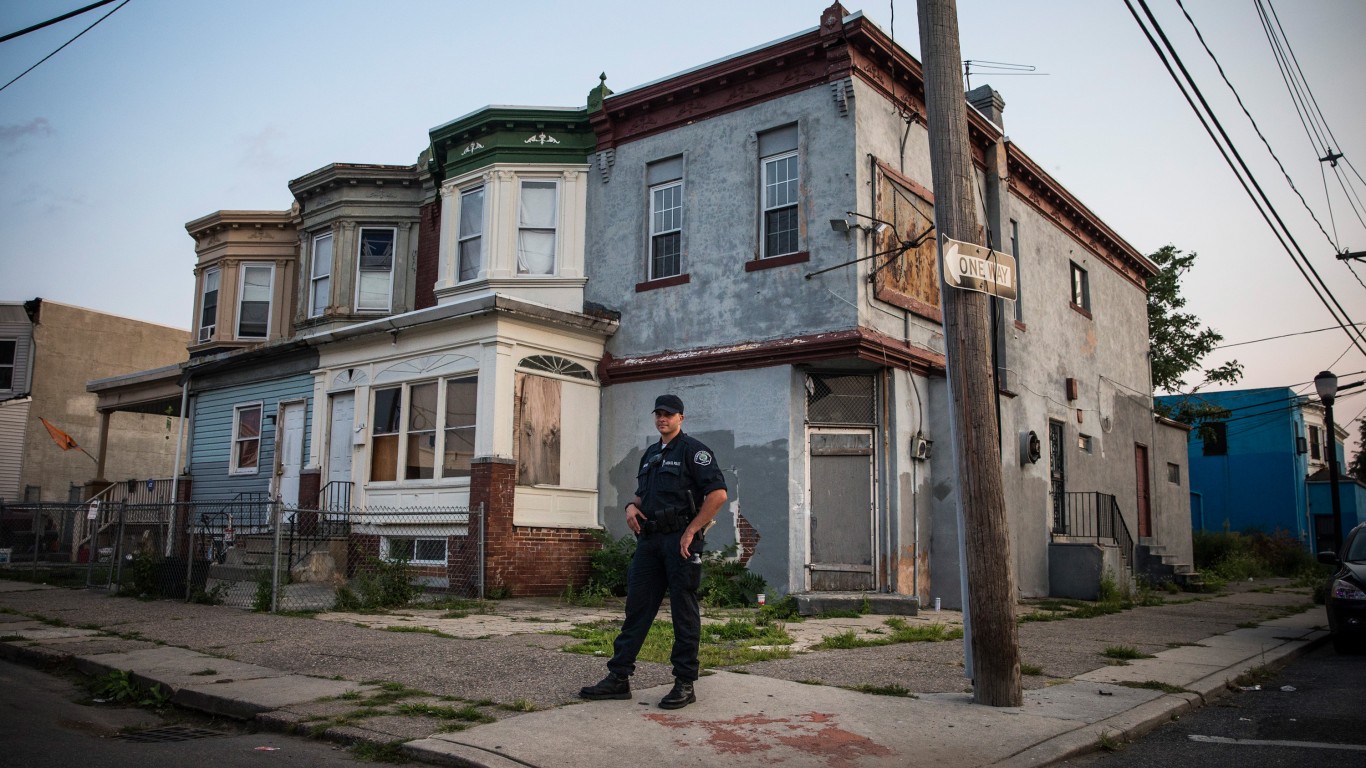
The high concentration of police officers in these places does not necessarily mean they are safe places. On the contrary, the vast majority of cities on this list have a higher violent crime rate than the U.S. average of 399 crimes for every 100,000 people, and in 23 of these cities, the violent crime rate is more than double the national rate. The relatively large police forces in these cities are likely a reflection of need in the face of high crime. (Here is a look at the most dangerous states to be a police officer.)
In two cities on this list – Bayonne, New Jersey and Yonkers, New York – the violent crime rate is well below average. These places are relatively prosperous, each with median household incomes exceeding the national median of $64,994 by about $5,000. Because police departments typically receive the bulk of their funding at the local level, the strong tax base may help explain the higher-than-average police employment.
Click here to see America’s most heavily policed cities.
Click here to see our detailed methodology.

50. North Little Rock, AR
> Police force in 2021: 2.55 per 1,000 people (170 officers total)
> Est. population under police dept. jurisdiction: 66,677
> Annual violent crime rate: 1,003 per 100,000 people (665 total violent crimes)
> Median household income: $43,831
[in-text-ad]
49. Kansas City, MO
> Police force in 2021: 2.57 per 1,000 people (1,286 officers total)
> Est. population under police dept. jurisdiction: 500,965
> Annual violent crime rate: 1,586 per 100,000 people (7,919 total violent crimes)
> Median household income: $56,179
[recirclink id=1161947]

48. Waterbury, CT
> Police force in 2021: 2.59 per 1,000 people (276 officers total)
> Est. population under police dept. jurisdiction: 106,480
> Annual violent crime rate: 373 per 100,000 people (400 total violent crimes)
> Median household income: $46,329

47. Bayonne, NJ
> Police force in 2021: 2.61 per 1,000 people (178 officers total)
> Est. population under police dept. jurisdiction: 68,121
> Annual violent crime rate: 182 per 100,000 people (118 total violent crimes)
> Median household income: $69,511
[in-text-ad-2]

46. Tuscaloosa, AL
> Police force in 2021: 2.62 per 1,000 people (273 officers total)
> Est. population under police dept. jurisdiction: 104,151
> Annual violent crime rate: N/A
> Median household income: $44,507
45. Baton Rouge, LA
> Police force in 2021: 2.64 per 1,000 people (575 officers total)
> Est. population under police dept. jurisdiction: 218,060
> Annual violent crime rate: 952 per 100,000 people (2,087 total violent crimes)
> Median household income: $44,177
[in-text-ad]
44. Miami, FL
> Police force in 2021: 2.66 per 1,000 people (1,275 officers total)
> Est. population under police dept. jurisdiction: 479,262
> Annual violent crime rate: 556 per 100,000 people (2,645 total violent crimes)
> Median household income: $44,268
[recirclink id=1162756]
43. Syracuse, NY
> Police force in 2021: 2.67 per 1,000 people (376 officers total)
> Est. population under police dept. jurisdiction: 140,847
> Annual violent crime rate: 839 per 100,000 people (1,192 total violent crimes)
> Median household income: $38,893
42. Richmond, VA
> Police force in 2021: 2.69 per 1,000 people (632 officers total)
> Est. population under police dept. jurisdiction: 234,928
> Annual violent crime rate: 349 per 100,000 people (814 total violent crimes)
> Median household income: $51,421
[in-text-ad-2]
41. Little Rock, AR
> Police force in 2021: 2.69 per 1,000 people (534 officers total)
> Est. population under police dept. jurisdiction: 198,260
> Annual violent crime rate: 1,850 per 100,000 people (3,657 total violent crimes)
> Median household income: $53,620

40. Paterson, NJ
> Police force in 2021: 2.71 per 1,000 people (408 officers total)
> Est. population under police dept. jurisdiction: 150,757
> Annual violent crime rate: 989 per 100,000 people (1,433 total violent crimes)
> Median household income: $45,141
[in-text-ad]

39. Pensacola, FL
> Police force in 2021: 2.72 per 1,000 people (145 officers total)
> Est. population under police dept. jurisdiction: 53,255
> Annual violent crime rate: 616 per 100,000 people (327 total violent crimes)
> Median household income: $56,199
[recirclink id=1158939]

38. Fort Lauderdale, FL
> Police force in 2021: 2.73 per 1,000 people (502 officers total)
> Est. population under police dept. jurisdiction: 183,810
> Annual violent crime rate: 628 per 100,000 people (1,158 total violent crimes)
> Median household income: $64,313

37. Irvington, NJ
> Police force in 2021: 2.76 per 1,000 people (156 officers total)
> Est. population under police dept. jurisdiction: 56,559
> Annual violent crime rate: 424 per 100,000 people (230 total violent crimes)
> Median household income: N/A
[in-text-ad-2]
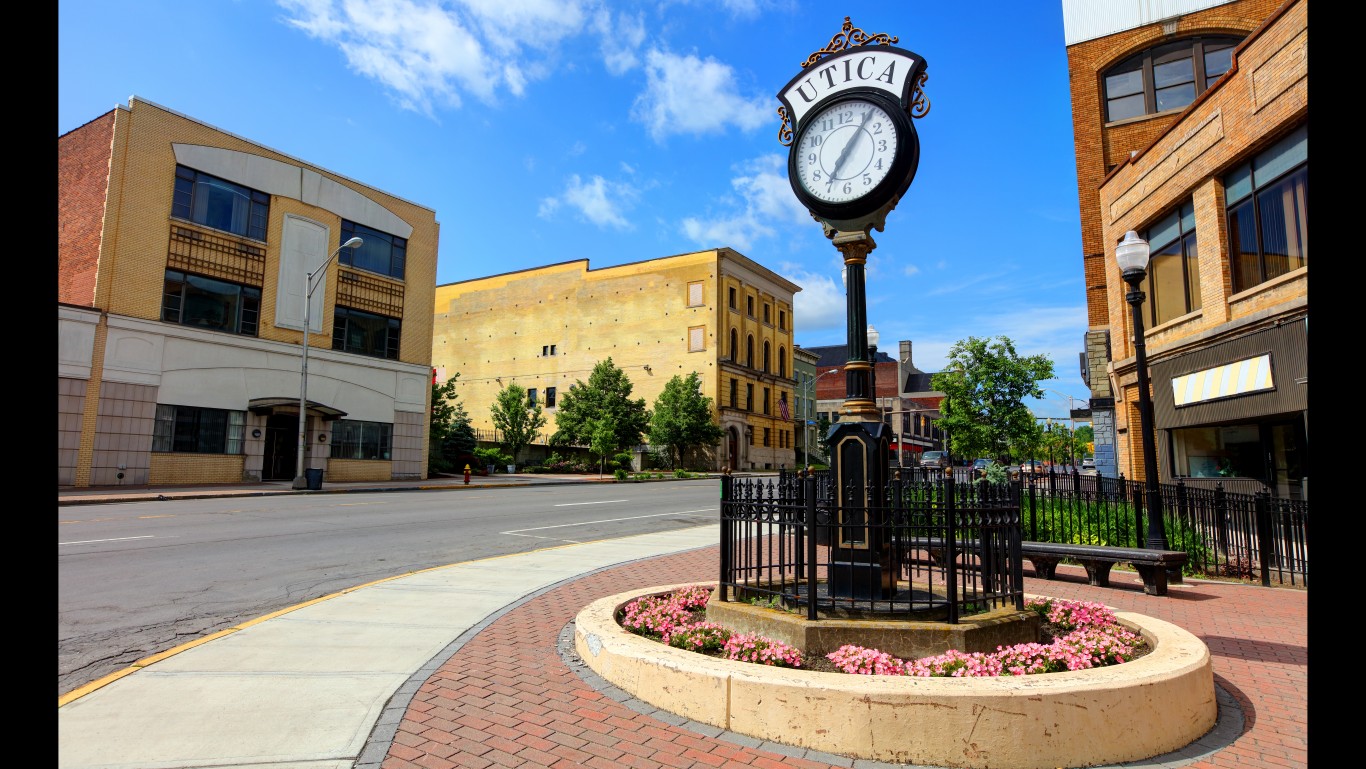
36. Utica, NY
> Police force in 2021: 2.76 per 1,000 people (163 officers total)
> Est. population under police dept. jurisdiction: 58,965
> Annual violent crime rate: 501 per 100,000 people (298 total violent crimes)
> Median household income: $42,624

35. Greenville, SC
> Police force in 2021: 2.78 per 1,000 people (205 officers total)
> Est. population under police dept. jurisdiction: 73,653
> Annual violent crime rate: 697 per 100,000 people (502 total violent crimes)
> Median household income: $58,259
[in-text-ad]
34. Orlando, FL
> Police force in 2021: 2.79 per 1,000 people (822 officers total)
> Est. population under police dept. jurisdiction: 295,040
> Annual violent crime rate: 860 per 100,000 people (2,524 total violent crimes)
> Median household income: $55,183
[recirclink id=1159605]
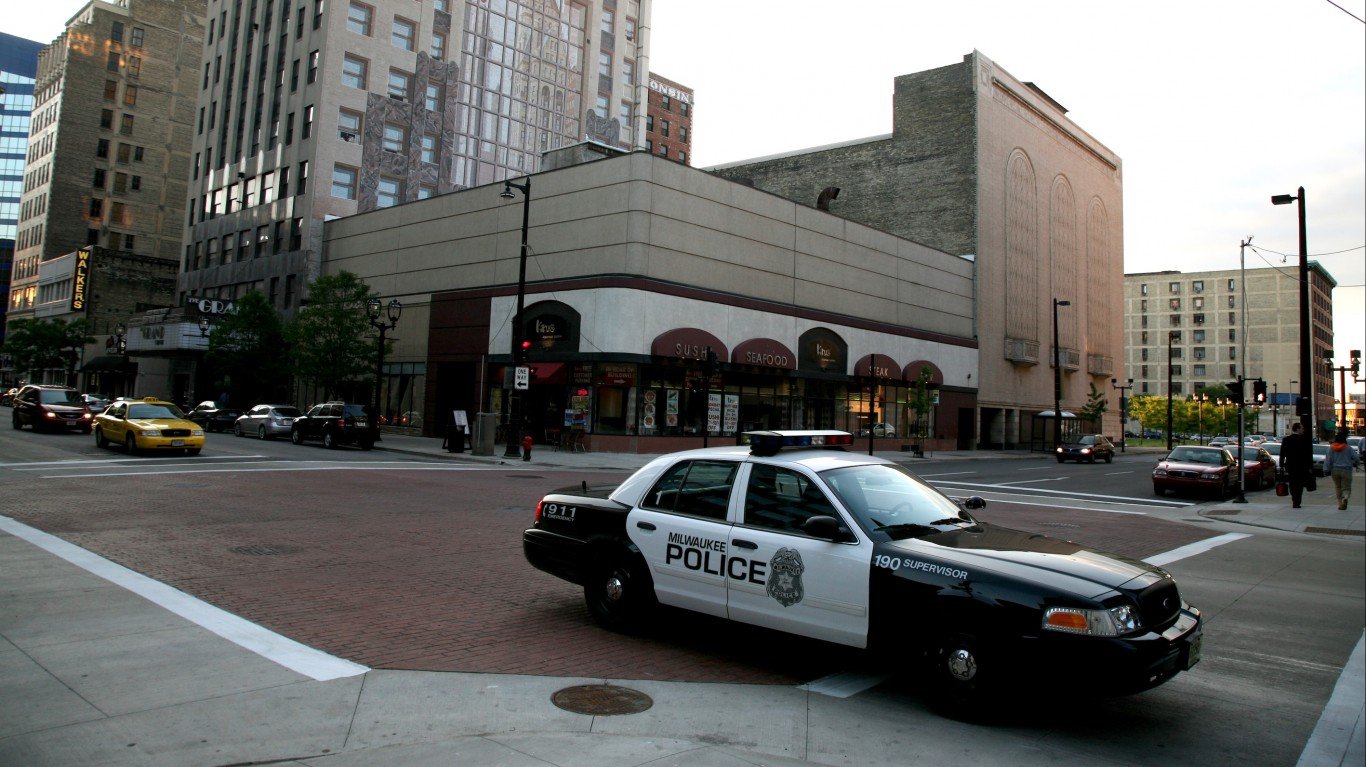
33. Milwaukee, WI
> Police force in 2021: 2.79 per 1,000 people (1,654 officers total)
> Est. population under police dept. jurisdiction: 593,337
> Annual violent crime rate: 1,597 per 100,000 people (9,407 total violent crimes)
> Median household income: $43,125
32. Galveston, TX
> Police force in 2021: 2.80 per 1,000 people (141 officers total)
> Est. population under police dept. jurisdiction: 50,321
> Annual violent crime rate: 644 per 100,000 people (327 total violent crimes)
> Median household income: $51,280
[in-text-ad-2]

31. Buffalo, NY
> Police force in 2021: 2.84 per 1,000 people (722 officers total)
> Est. population under police dept. jurisdiction: 253,809
> Annual violent crime rate: 1,018 per 100,000 people (2,592 total violent crimes)
> Median household income: $39,677

30. Pittsburgh, PA
> Police force in 2021: 2.86 per 1,000 people (907 officers total)
> Est. population under police dept. jurisdiction: 316,632
> Annual violent crime rate: N/A
> Median household income: $50,536
[in-text-ad]
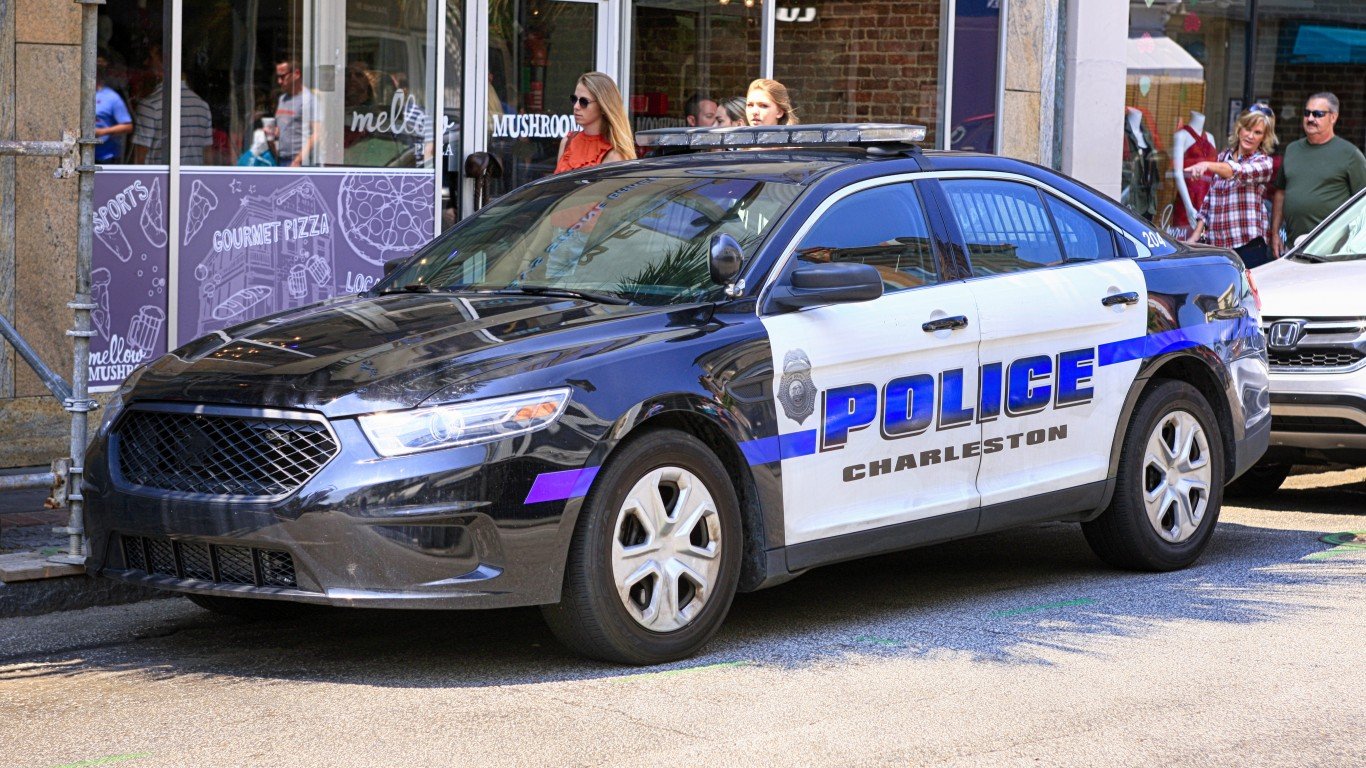
29. Charleston, SC
> Police force in 2021: 2.91 per 1,000 people (413 officers total)
> Est. population under police dept. jurisdiction: 141,768
> Annual violent crime rate: 466 per 100,000 people (650 total violent crimes)
> Median household income: $72,071
[recirclink id=1159280]

28. Albany, NY
> Police force in 2021: 2.97 per 1,000 people (283 officers total)
> Est. population under police dept. jurisdiction: 95,201
> Annual violent crime rate: 902 per 100,000 people (869 total violent crimes)
> Median household income: $48,512

27. Sarasota, FL
> Police force in 2021: 2.99 per 1,000 people (178 officers total)
> Est. population under police dept. jurisdiction: 59,569
> Annual violent crime rate: 592 per 100,000 people (349 total violent crimes)
> Median household income: $56,093
[in-text-ad-2]

26. Ocala, FL
> Police force in 2021: 2.99 per 1,000 people (186 officers total)
> Est. population under police dept. jurisdiction: 62,206
> Annual violent crime rate: 674 per 100,000 people (413 total violent crimes)
> Median household income: $42,361

25. Springfield, MA
> Police force in 2021: 3.02 per 1,000 people (465 officers total)
> Est. population under police dept. jurisdiction: 154,098
> Annual violent crime rate: 967 per 100,000 people (1,480 total violent crimes)
> Median household income: $41,571
[in-text-ad]
24. Jackson, TN
> Police force in 2021: 3.04 per 1,000 people (205 officers total)
> Est. population under police dept. jurisdiction: 67,462
> Annual violent crime rate: 1,046 per 100,000 people (703 total violent crimes)
> Median household income: $42,549
[recirclink id=1161947]

23. East Orange, NJ
> Police force in 2021: 3.04 per 1,000 people (205 officers total)
> Est. population under police dept. jurisdiction: 67,392
> Annual violent crime rate: 457 per 100,000 people (294 total violent crimes)
> Median household income: $50,990

22. Daytona Beach, FL
> Police force in 2021: 3.05 per 1,000 people (217 officers total)
> Est. population under police dept. jurisdiction: 71,059
> Annual violent crime rate: 1,035 per 100,000 people (725 total violent crimes)
> Median household income: $38,686
[in-text-ad-2]

21. Yonkers, NY
> Police force in 2021: 3.06 per 1,000 people (613 officers total)
> Est. population under police dept. jurisdiction: 200,397
> Annual violent crime rate: 325 per 100,000 people (653 total violent crimes)
> Median household income: $69,825

20. Trenton, NJ
> Police force in 2021: 3.07 per 1,000 people (265 officers total)
> Est. population under police dept. jurisdiction: 86,246
> Annual violent crime rate: 1,169 per 100,000 people (969 total violent crimes)
> Median household income: $37,002
[in-text-ad]

19. Boston, MA
> Police force in 2021: 3.10 per 1,000 people (2,184 officers total)
> Est. population under police dept. jurisdiction: 704,758
> Annual violent crime rate: 624 per 100,000 people (4,354 total violent crimes)
> Median household income: $76,298
[recirclink id=1162756]
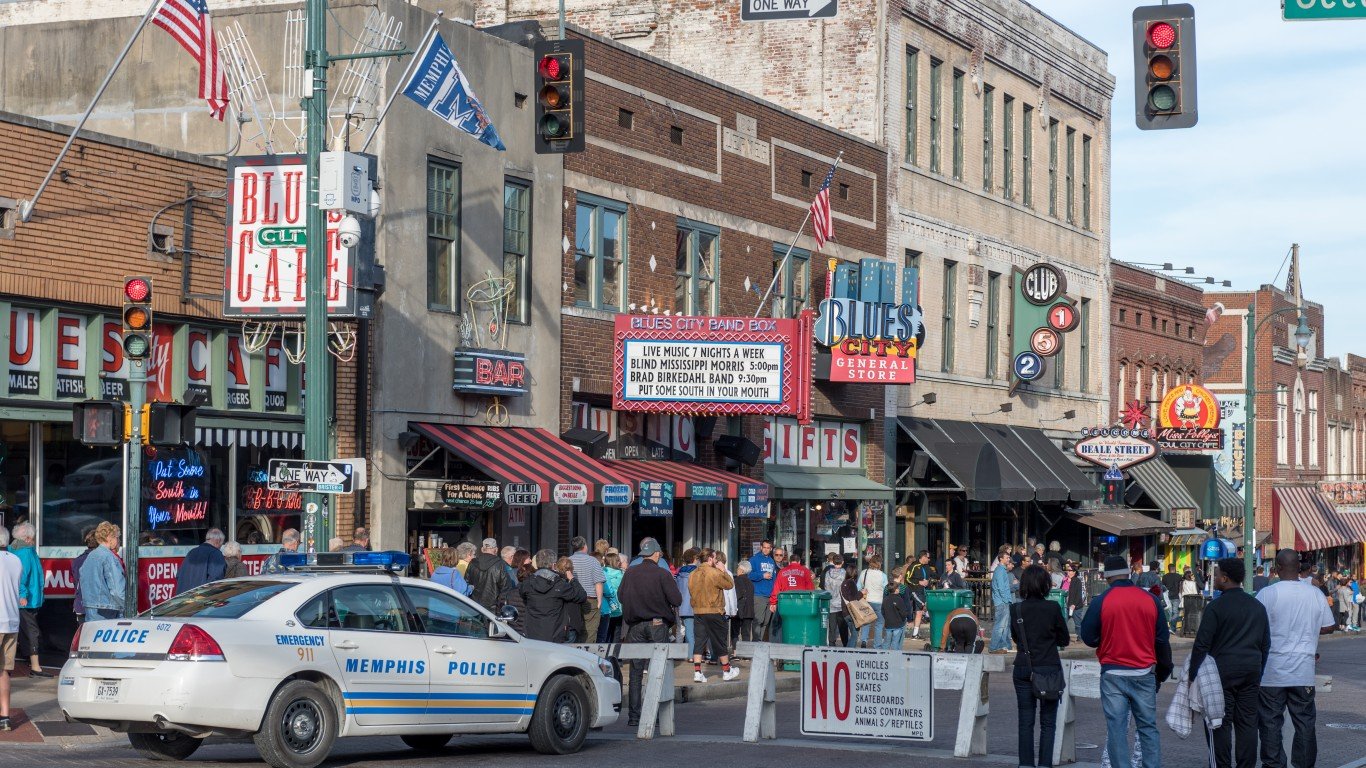
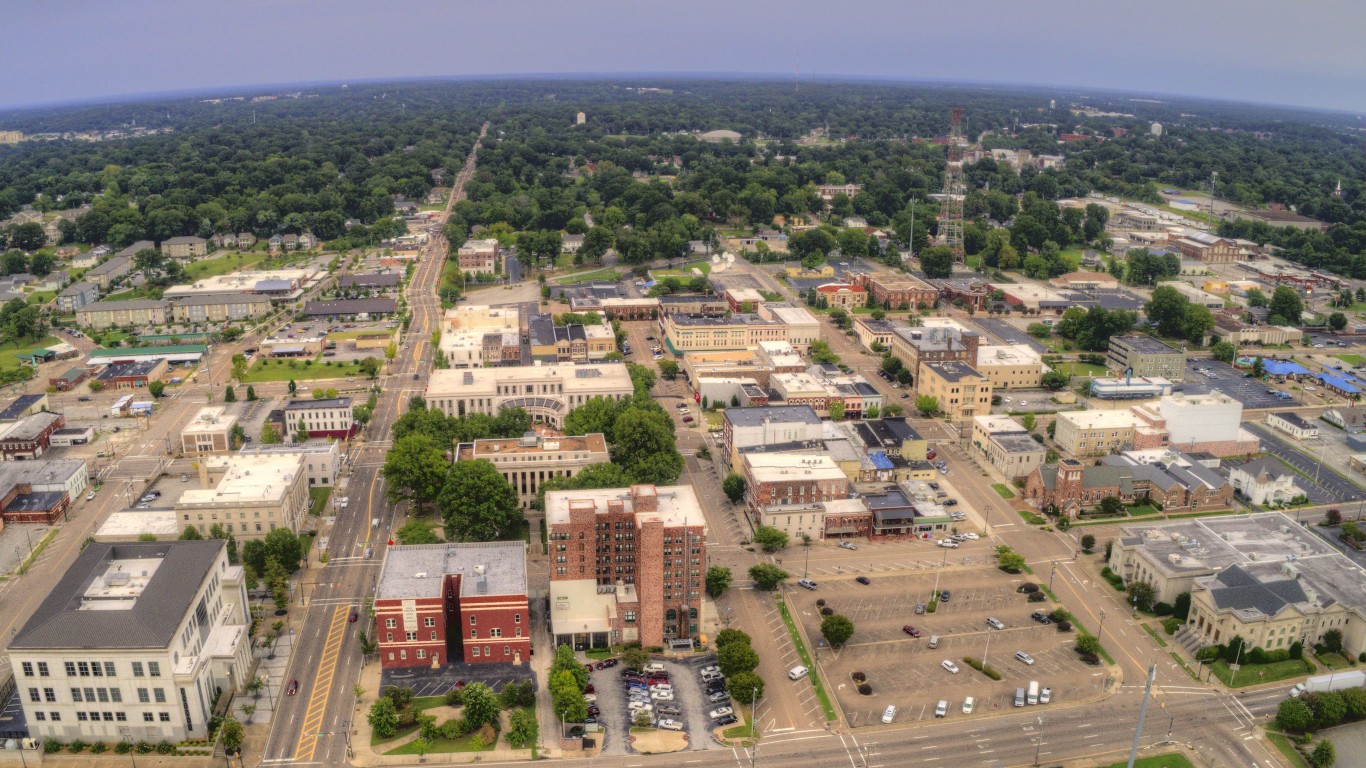
18. Memphis, TN
> Police force in 2021: 3.12 per 1,000 people (2,027 officers total)
> Est. population under police dept. jurisdiction: 649,444
> Annual violent crime rate: 2,352 per 100,000 people (15,310 total violent crimes)
> Median household income: $41,864

17. Atlanta, GA
> Police force in 2021: 3.15 per 1,000 people (1,641 officers total)
> Est. population under police dept. jurisdiction: 521,274
> Annual violent crime rate: N/A
> Median household income: $64,179
[in-text-ad-2]

16. White Plains, NY
> Police force in 2021: 3.20 per 1,000 people (187 officers total)
> Est. population under police dept. jurisdiction: 58,426
> Annual violent crime rate: N/A
> Median household income: $96,715

15. Kalamazoo, MI
> Police force in 2021: 3.22 per 1,000 people (245 officers total)
> Est. population under police dept. jurisdiction: 76,179
> Annual violent crime rate: 1,432 per 100,000 people (1,094 total violent crimes)
> Median household income: $43,222
[in-text-ad]

14. Hartford, CT
> Police force in 2021: 3.26 per 1,000 people (395 officers total)
> Est. population under police dept. jurisdiction: 121,160
> Annual violent crime rate: 992 per 100,000 people (1,208 total violent crimes)
> Median household income: $36,154
[recirclink id=1158939]
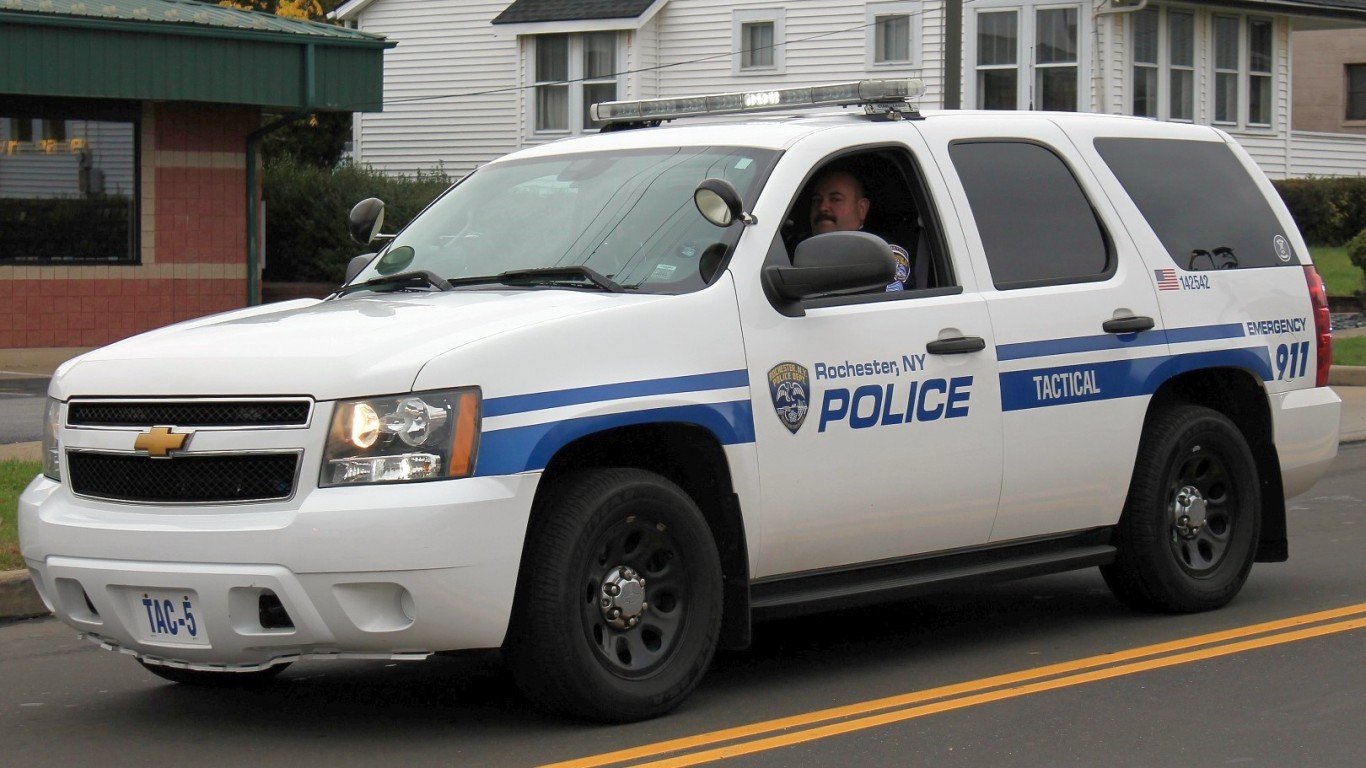
13. Rochester, NY
> Police force in 2021: 3.26 per 1,000 people (668 officers total)
> Est. population under police dept. jurisdiction: 204,735
> Annual violent crime rate: 819 per 100,000 people (1,680 total violent crimes)
> Median household income: $37,395
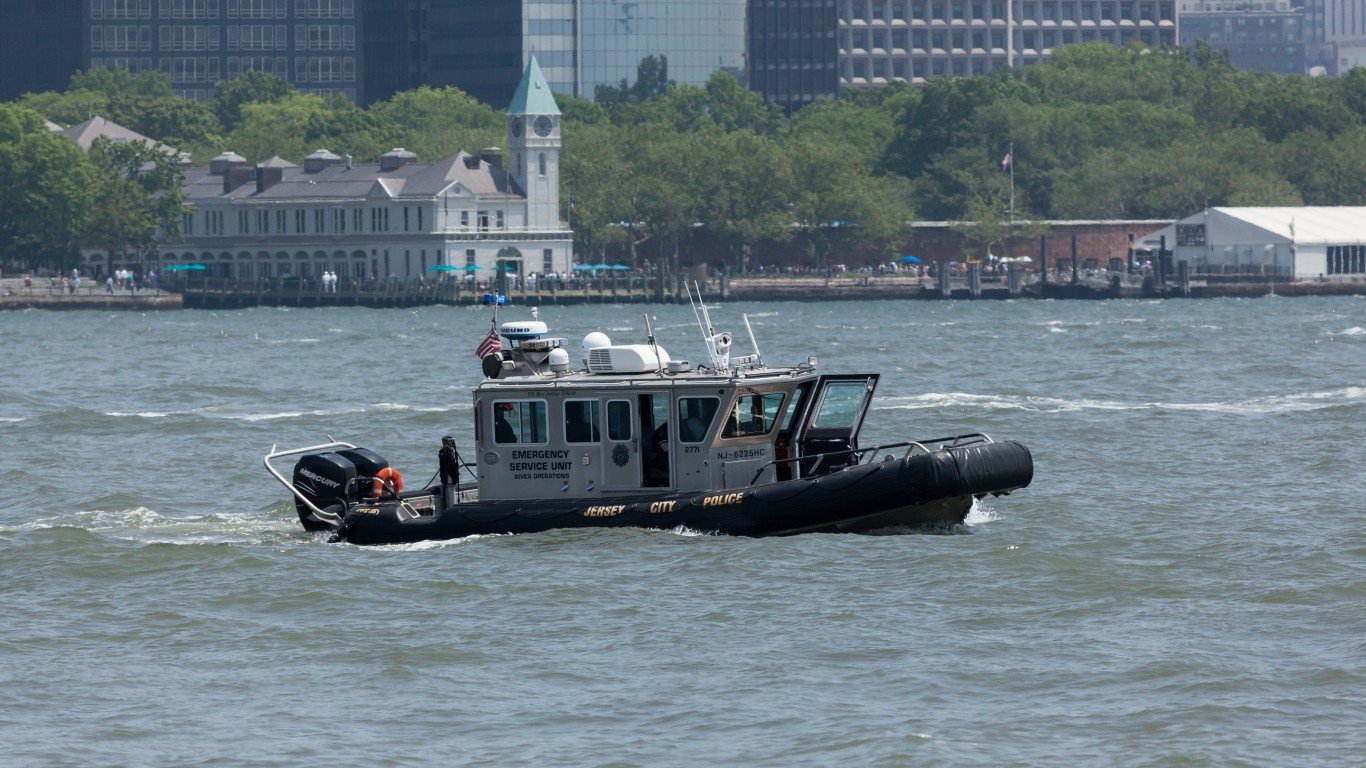
12. Jersey City, NJ
> Police force in 2021: 3.39 per 1,000 people (934 officers total)
> Est. population under police dept. jurisdiction: 275,213
> Annual violent crime rate: 443 per 100,000 people (1,167 total violent crimes)
> Median household income: $76,444
[in-text-ad-2]
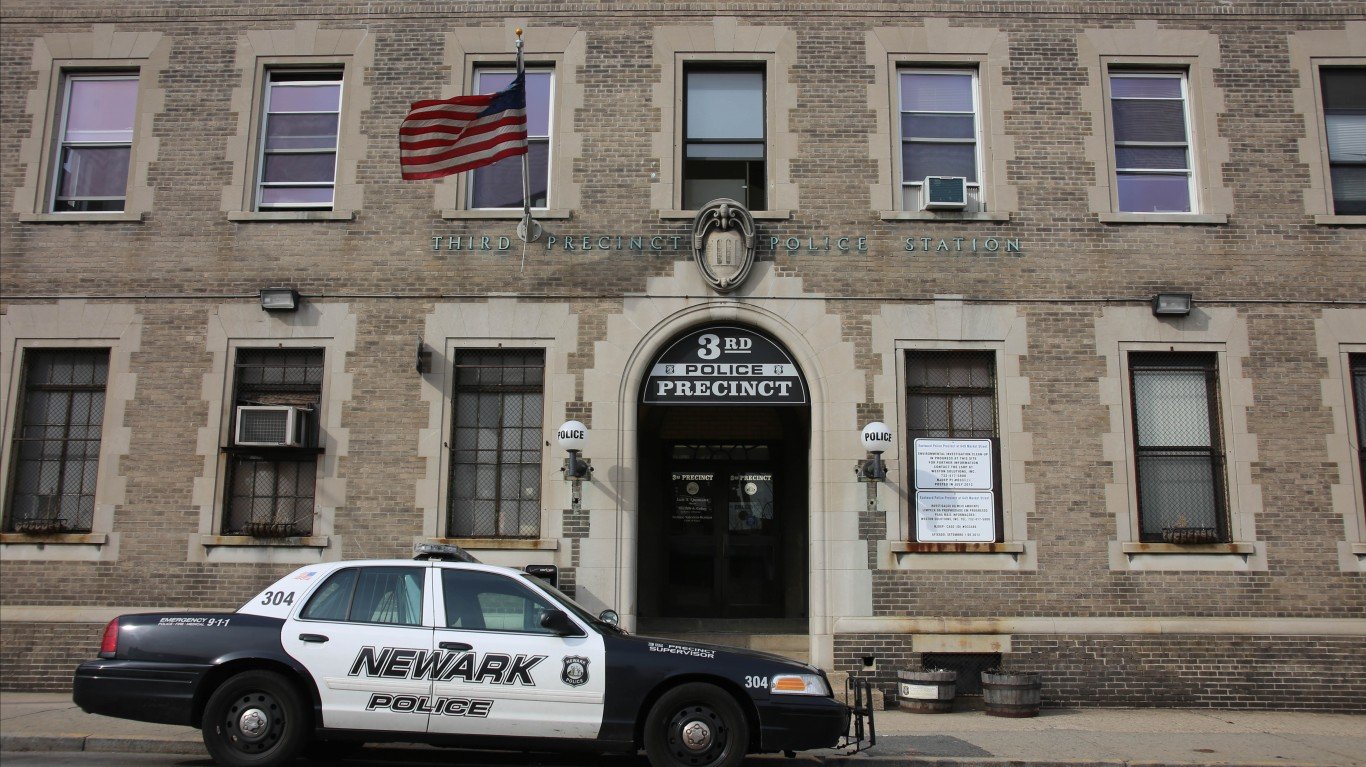
11. Newark, NJ
> Police force in 2021: 3.50 per 1,000 people (1,032 officers total)
> Est. population under police dept. jurisdiction: 295,039
> Annual violent crime rate: 529 per 100,000 people (1,492 total violent crimes)
> Median household income: $37,476

10. Birmingham, AL
> Police force in 2021: 3.66 per 1,000 people (756 officers total)
> Est. population under police dept. jurisdiction: 206,476
> Annual violent crime rate: N/A
> Median household income: $38,832
[in-text-ad]

9. Detroit, MI
> Police force in 2021: 3.67 per 1,000 people (2,475 officers total)
> Est. population under police dept. jurisdiction: 673,708
> Annual violent crime rate: 2,179 per 100,000 people (14,370 total violent crimes)
> Median household income: $32,498
[recirclink id=1159605]
8. St. Louis, MO
> Police force in 2021: 3.79 per 1,000 people (1,119 officers total)
> Est. population under police dept. jurisdiction: 295,536
> Annual violent crime rate: 2,016 per 100,000 people (6,017 total violent crimes)
> Median household income: $45,782

7. Cleveland, OH
> Police force in 2021: 3.89 per 1,000 people (1,475 officers total)
> Est. population under police dept. jurisdiction: 379,313
> Annual violent crime rate: 1,657 per 100,000 people (6,281 total violent crimes)
> Median household income: $31,838
[in-text-ad-2]

6. Baltimore, MD
> Police force in 2021: 4.00 per 1,000 people (2,360 officers total)
> Est. population under police dept. jurisdiction: 590,536
> Annual violent crime rate: N/A
> Median household income: $52,164

5. New York, NY
> Police force in 2021: 4.14 per 1,000 people (35,047 officers total)
> Est. population under police dept. jurisdiction: 8,475,387
> Annual violent crime rate: 578 per 100,000 people (47,959 total violent crimes)
> Median household income: $67,046
[in-text-ad]

4. Wilmington, DE
> Police force in 2021: 4.29 per 1,000 people (302 officers total)
> Est. population under police dept. jurisdiction: 70,331
> Annual violent crime rate: 1,591 per 100,000 people (1,115 total violent crimes)
> Median household income: $45,139
[recirclink id=1159280]
3. Miami Beach, FL
> Police force in 2021: 4.72 per 1,000 people (414 officers total)
> Est. population under police dept. jurisdiction: 87,729
> Annual violent crime rate: 750 per 100,000 people (668 total violent crimes)
> Median household income: $57,211
2. Camden, NJ
> Police force in 2021: 4.81 per 1,000 people (368 officers total)
> Est. population under police dept. jurisdiction: 76,544
> Annual violent crime rate: N/A
> Median household income: $28,623
[in-text-ad-2]

1. Washington, DC
> Police force in 2021: 5.34 per 1,000 people (3,575 officers total)
> Est. population under police dept. jurisdiction: 670,050
> Annual violent crime rate: 958 per 100,000 people (6,828 total violent crimes)
> Median household income: $90,842
Methodology
To identify the most heavily policed cities in the United States, 24/7 Wall St. reviewed 2021 police officer employment figures from the FBI. Cities are ranked by the total number of police officers – excluding civilian police employees – for every 1,000 people in their department’s jurisdiction. Only places that participated in the FBI survey and had populations of at least 50,000 were considered.
We also considered violent crime rates from the FBI’s Uniform Crime Report for 2020, the most recent year of available data. Because violent crime rates are for 2020, they were calculated by the FBI using a different denominator than the population figure used to calculate per capita police officer employment.
Additional information on median household income is from the U.S. Census Bureau’s 2020 American Community Survey, and figures are five-year average estimates.
Contact [email protected] for any questions or corrections.