Hurricane Ian made landfall in South Florida, not far from the city of Fort Myers. at 2:24 PM EDT. The storm had intensified rapidly, with recorded sustained winds of 155 mph, just 2 mph under becoming a Category 5 event. Meteorologists say that in addition to heavy winds and rain, Ian’s storm surge poses a serious risk for loss of life, with some estimates saying the water could rise as much as 18 feet above sea level. At the time of this story, some 800,000 Floridians were reportedly without power.
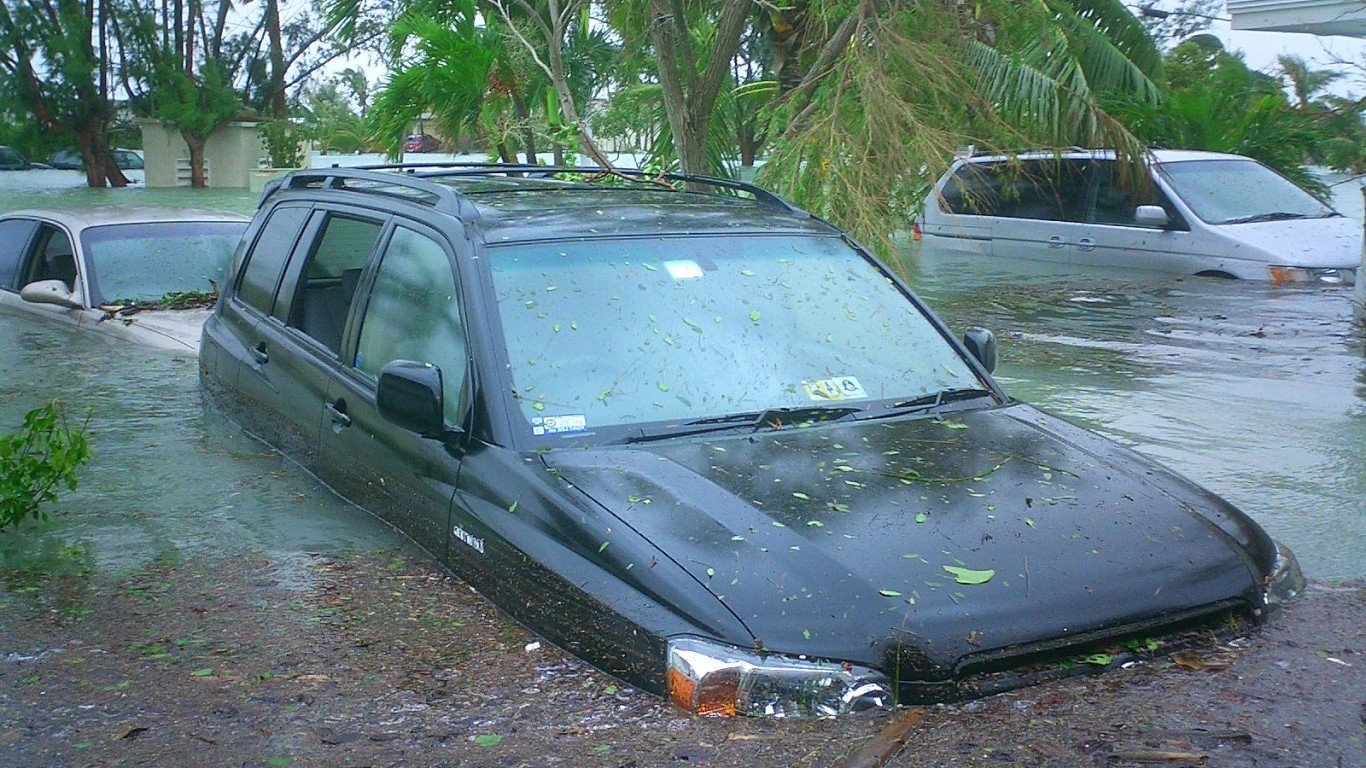
A hurricane is a large, swirling tropical storm, with wind speeds than can exceed 150 miles an hour. Either from personal experience or from the visceral imagery provided by national news outlets, most Americans are familiar with the results of these savage tempests: boats overturned and smashed together, cars and trucks picked up and dropped upside down miles away, city streets filled with shattered glass or turned into torrential rivers, rural villages razed into piles of sticks, and so on.
Sometimes, the devastation is so vast that we nearly forget what the places looked like before they were struck by major hurricanes. That is why 24/7 Wall St. has collected before-and-after images depicting the horrific effects of some of the worst hurricanes to strike the United States in recent history. We reviewed information from the National Hurricane Center on 18 major hurricanes since 2000 that caused at least $3 billion in damages.
Regard the peaceful scenes of life in normal weather, then the aftermaths of these violent superstorms, and remember how punishing the natural world can be.
Click here for before and after pictures of the worst hurricanes in American history
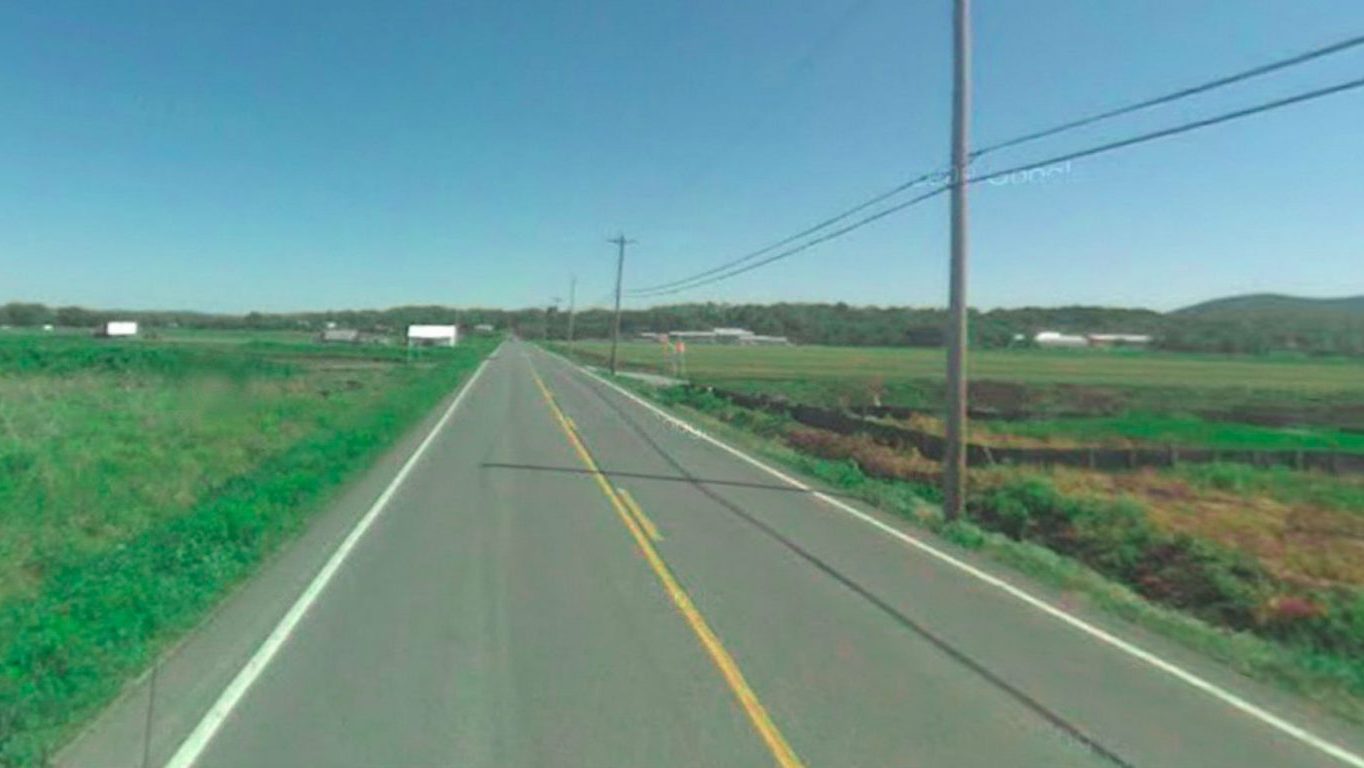
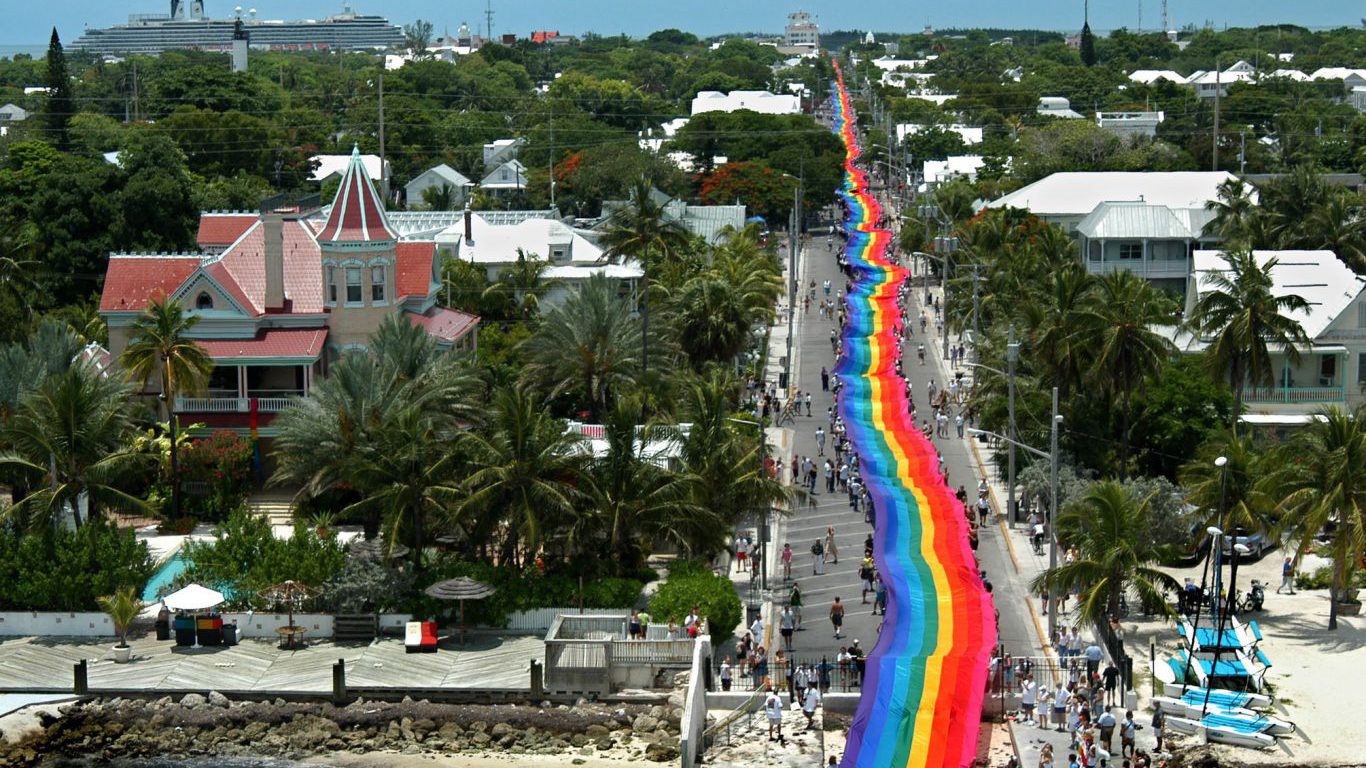
Before
After
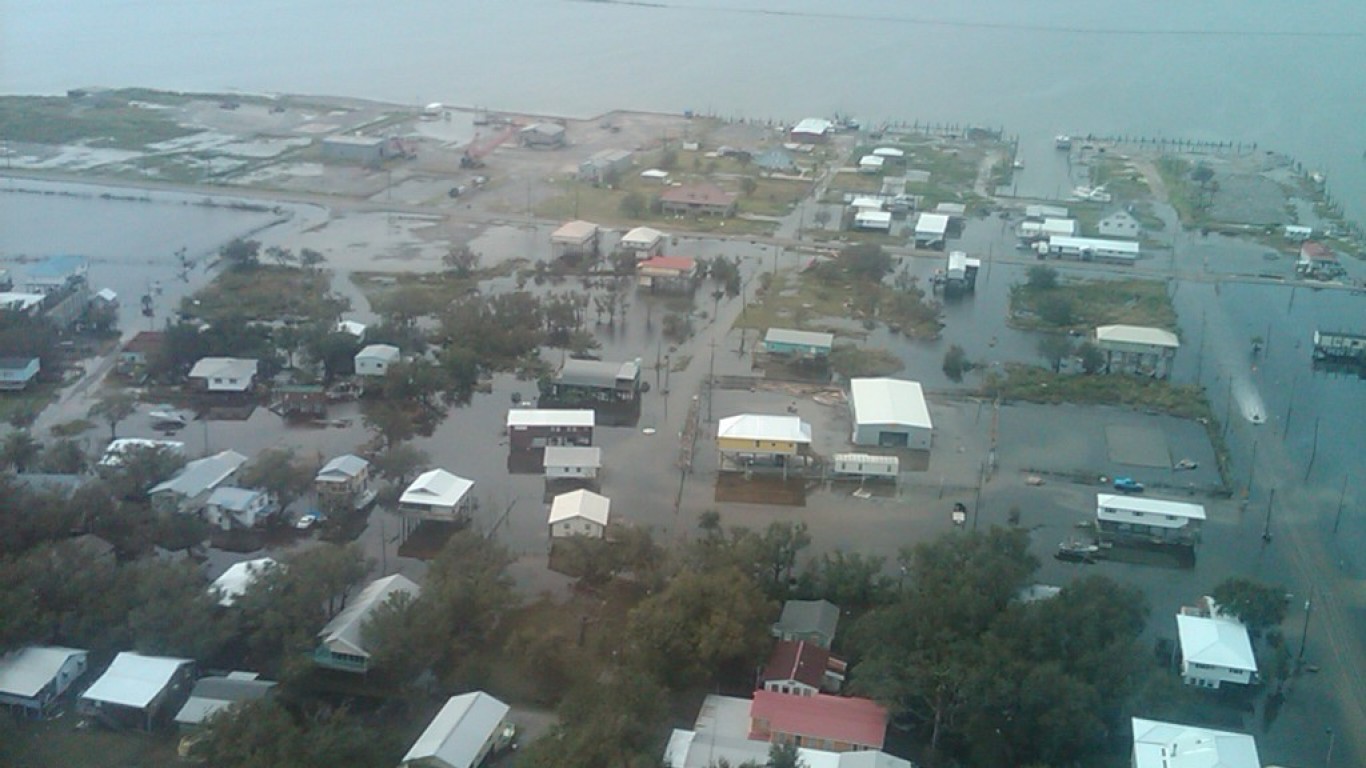
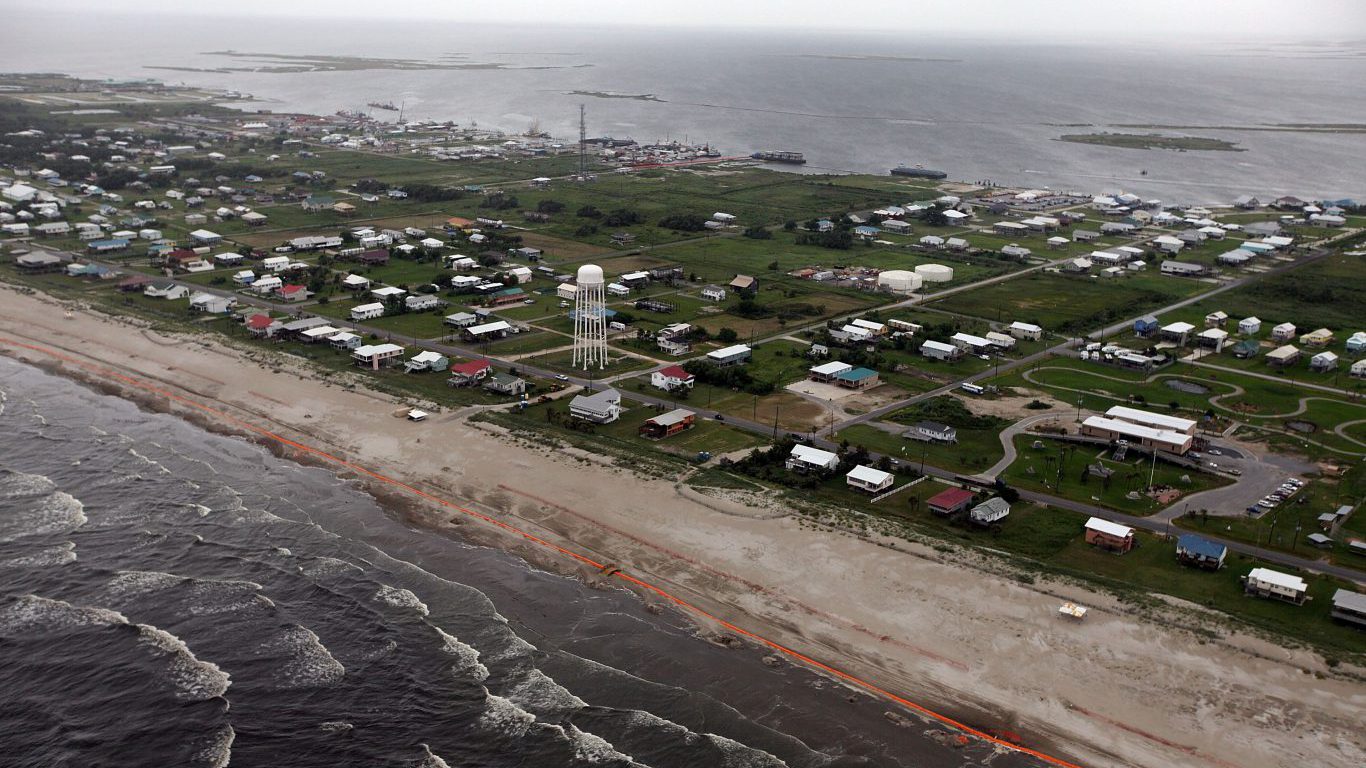
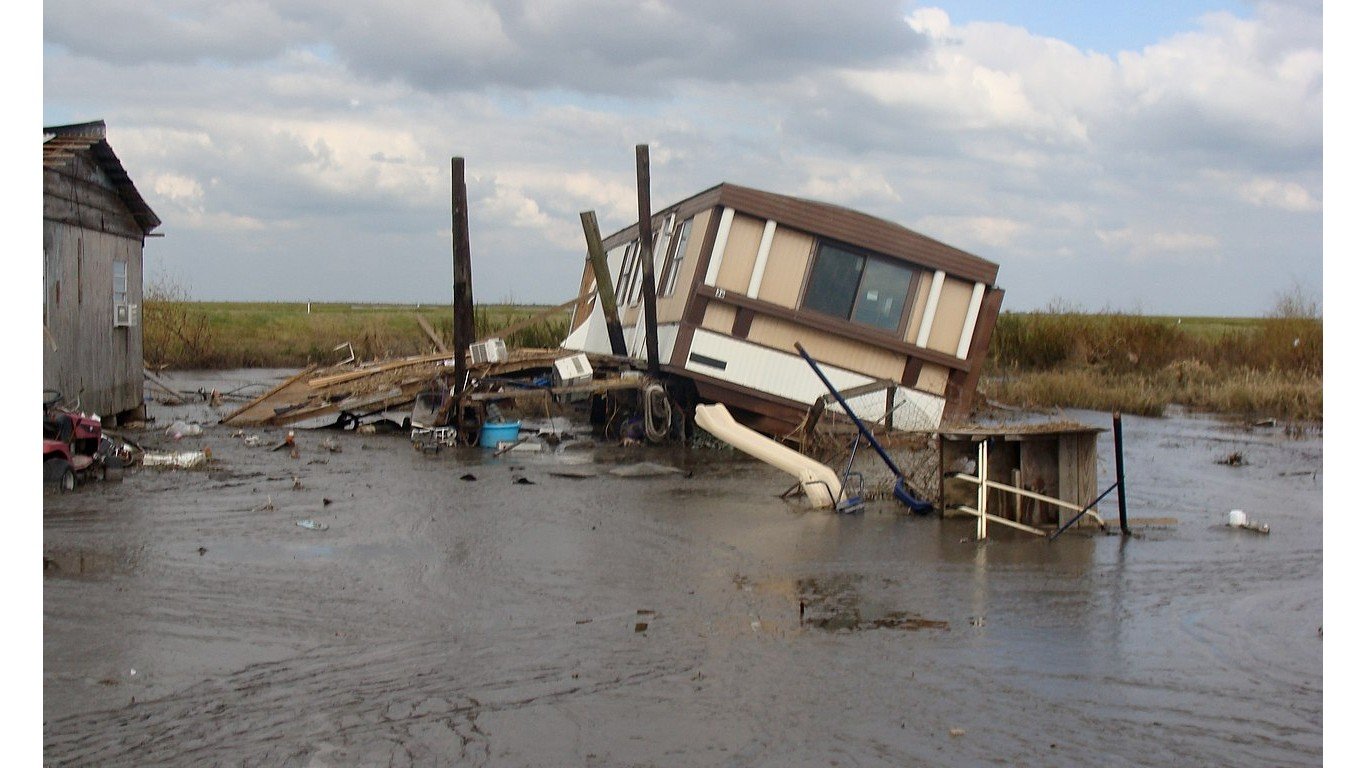
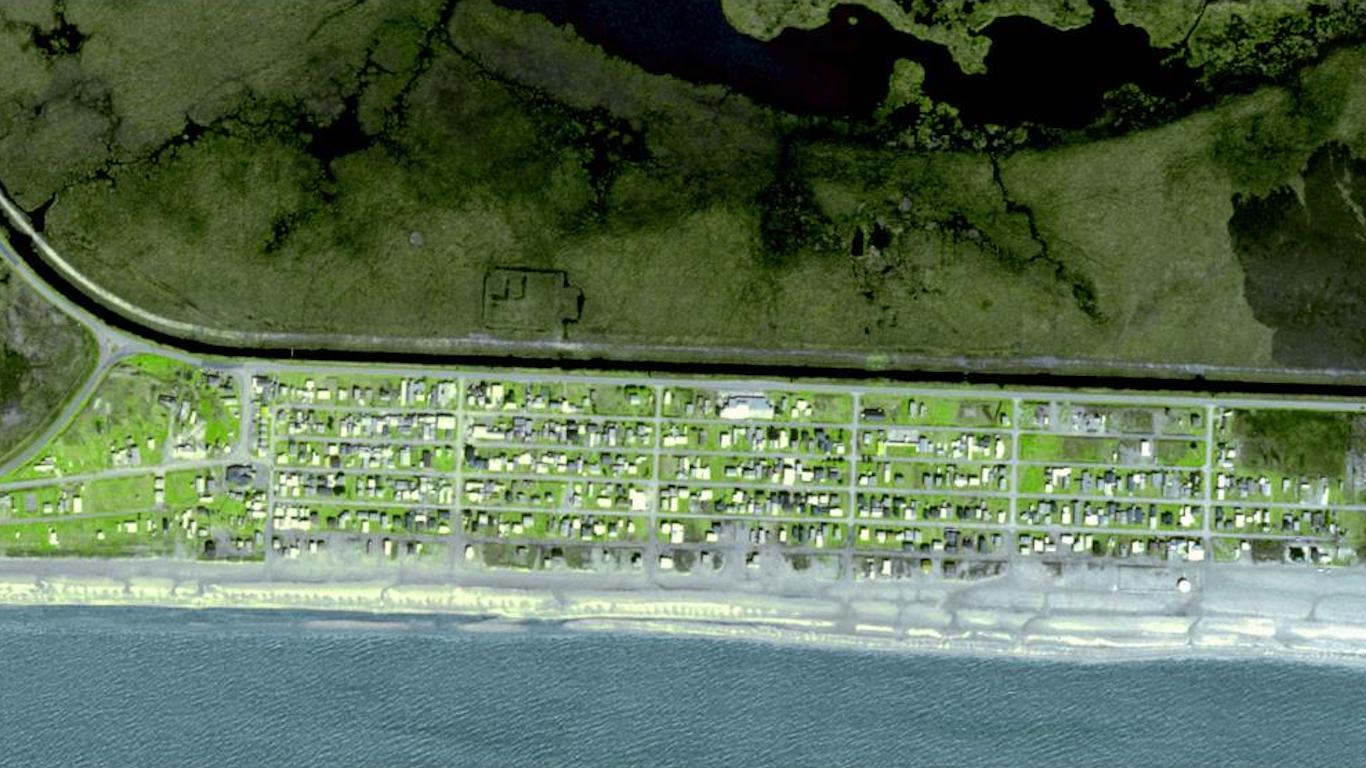
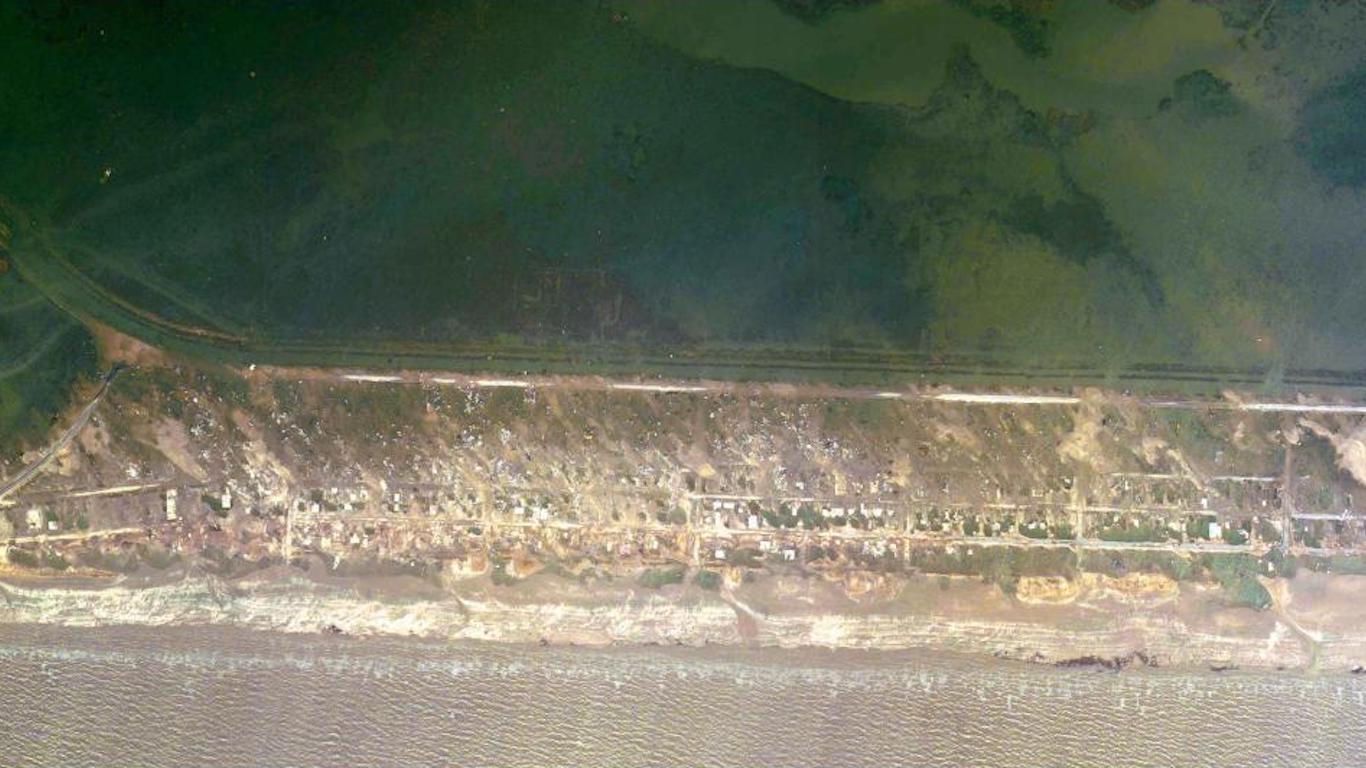
15. Isaac
> Damage: $3.02 billion
> Area pictured: Grand Isle, Louisiana
> Max wind speed at landfall: 70 mph
> Date of landfall: August 2012
[in-text-ad]
Before
After
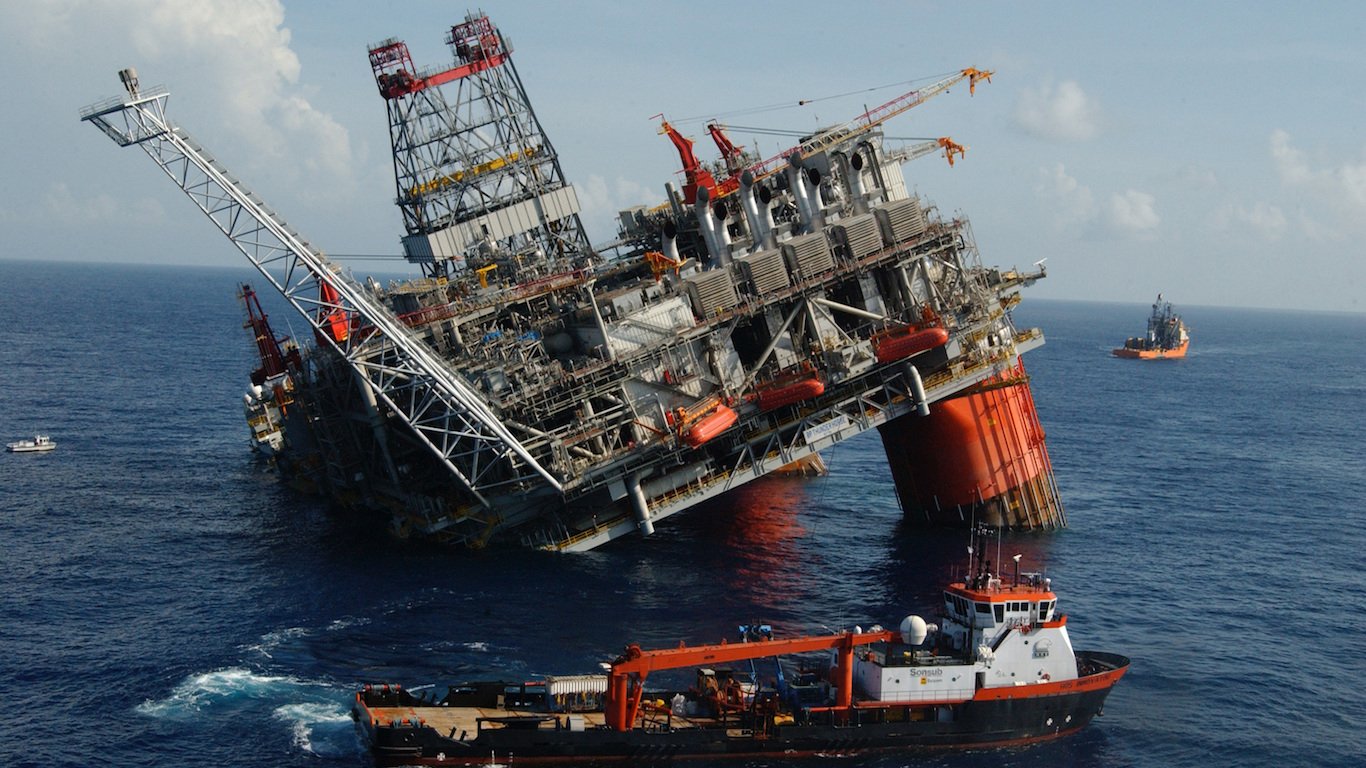
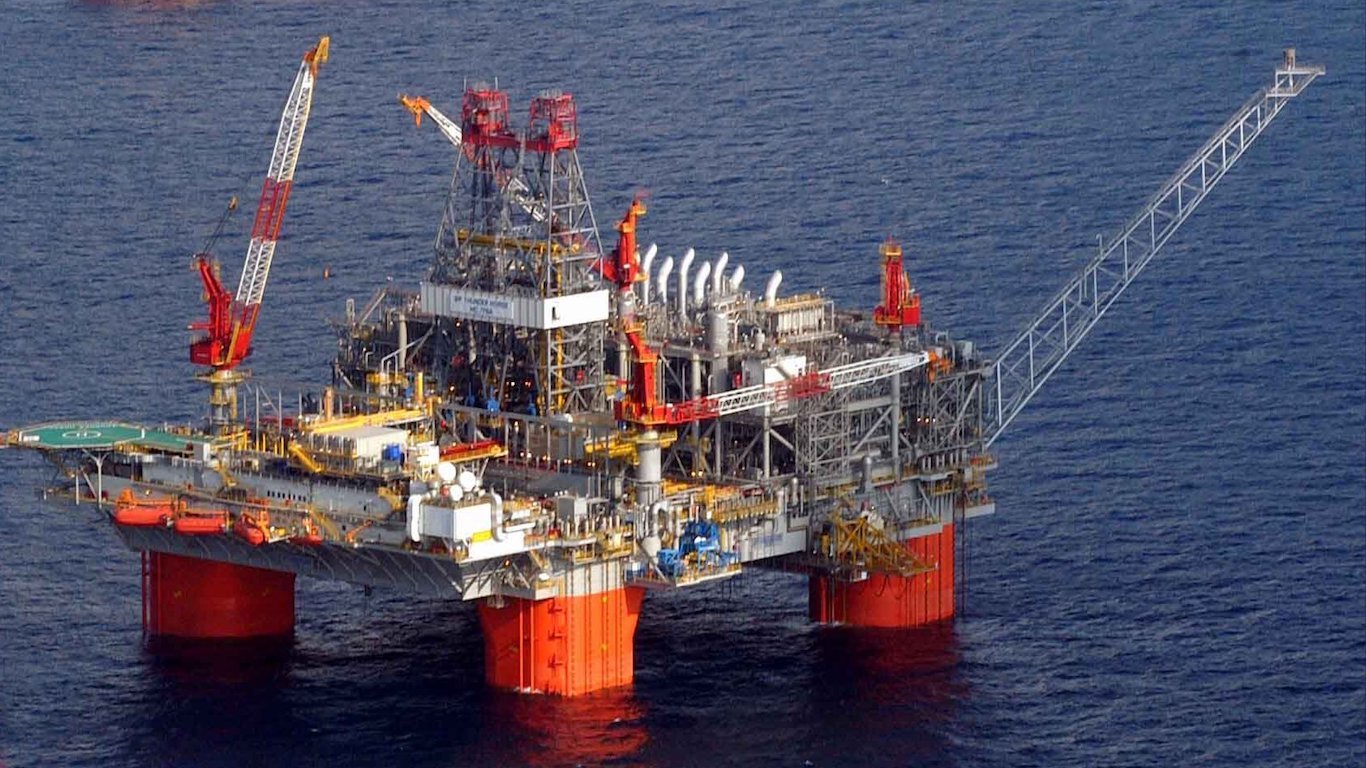
14. Dennis
> Damage: $3.20 billion
> Area pictured: Gulf of Mexico off the coast of Louisiana
> Max wind speed at landfall: 120 mph
> Date of landfall: July 2005
[recirclink id=975409]
Before
After
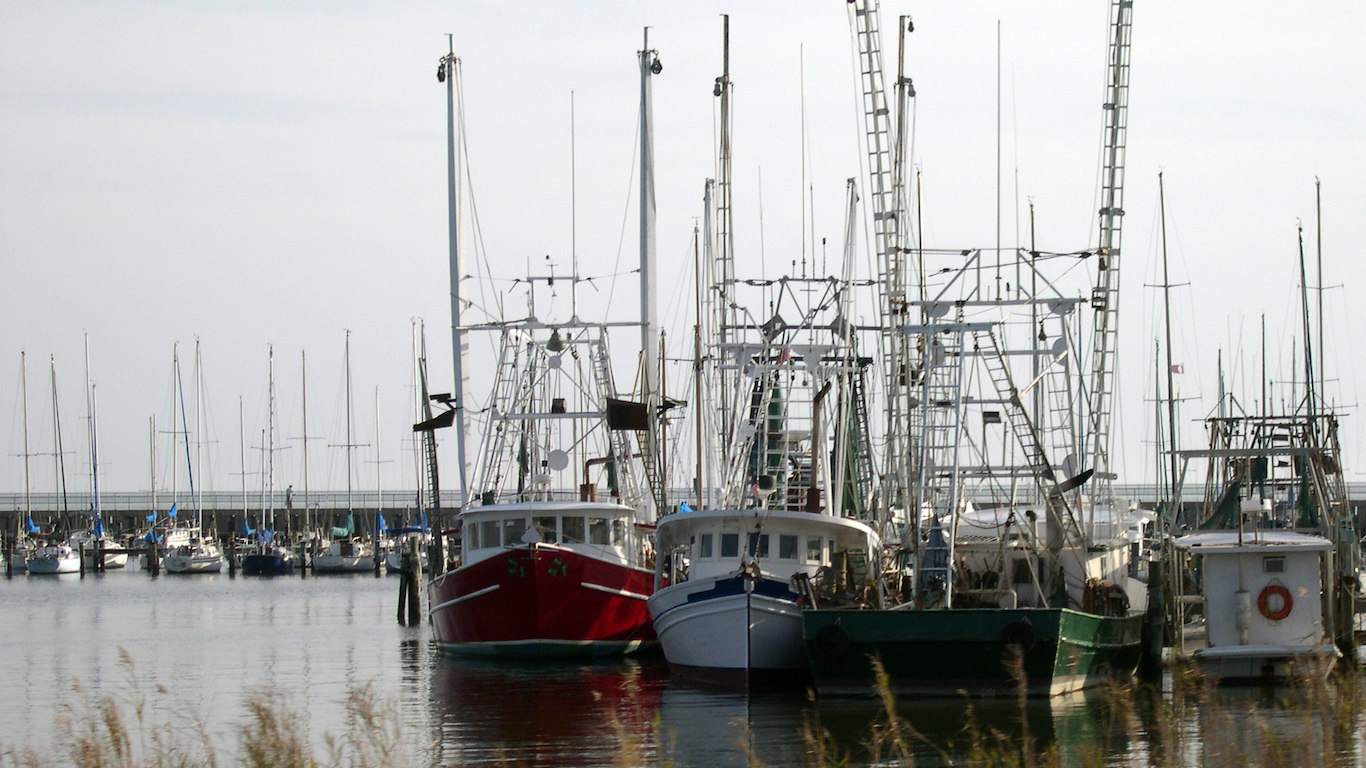
13. Gustav
> Damage: $6.96 billion
> Area pictured: Mississippi
> Max wind speed at landfall: 135 mph
> Date of landfall: August 2008
Before
After
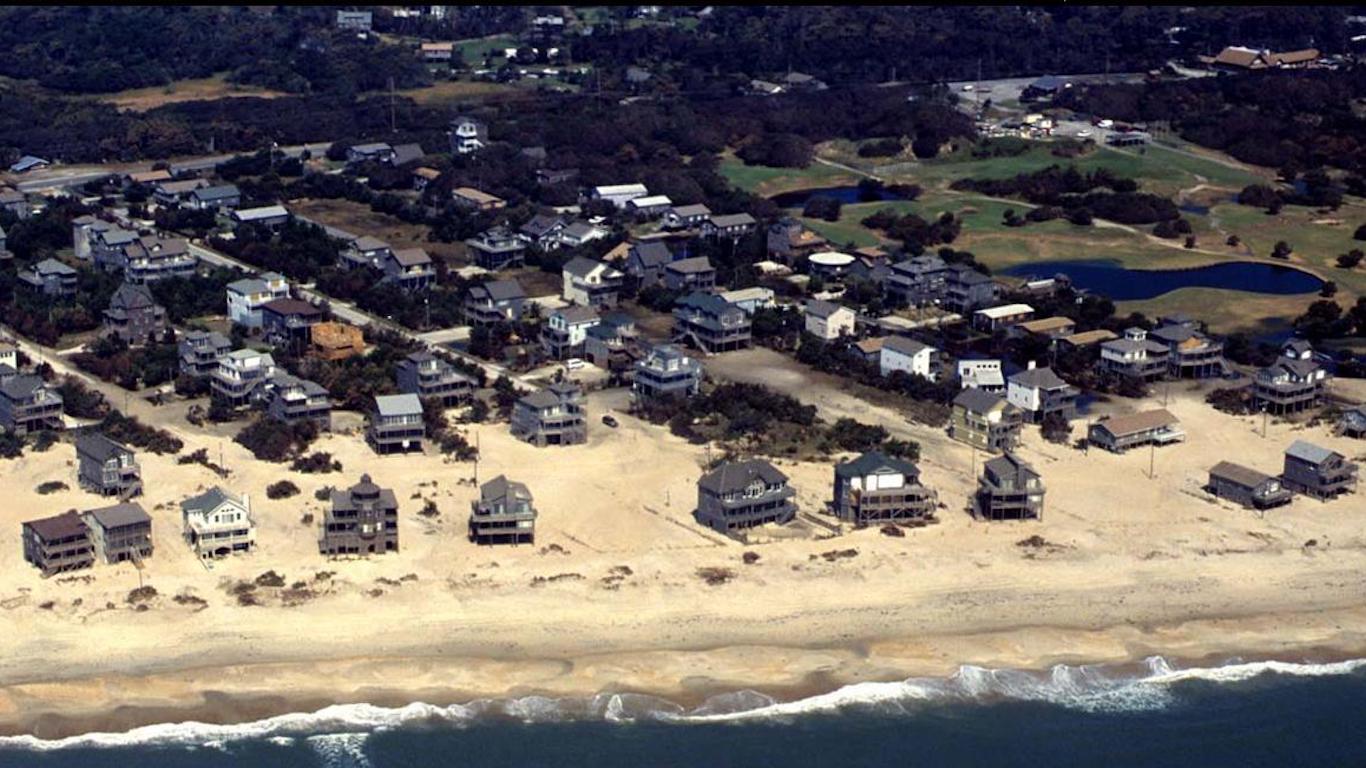
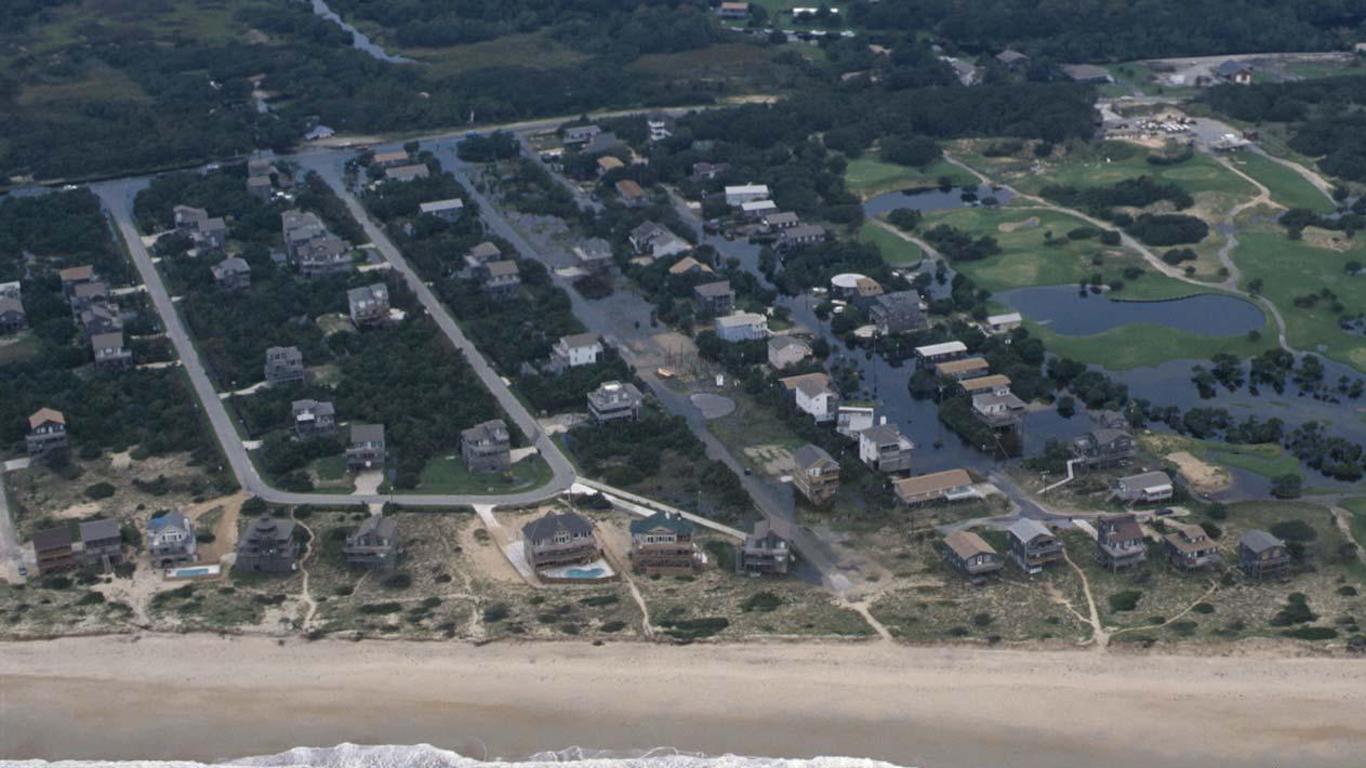
12. Isabel
> Damage: $7.37 billion
> Area pictured: Hatters Island, North Carolina
> Max wind speed at landfall: 90 mph
> Date of landfall: September 2003
[in-text-ad-2]
Before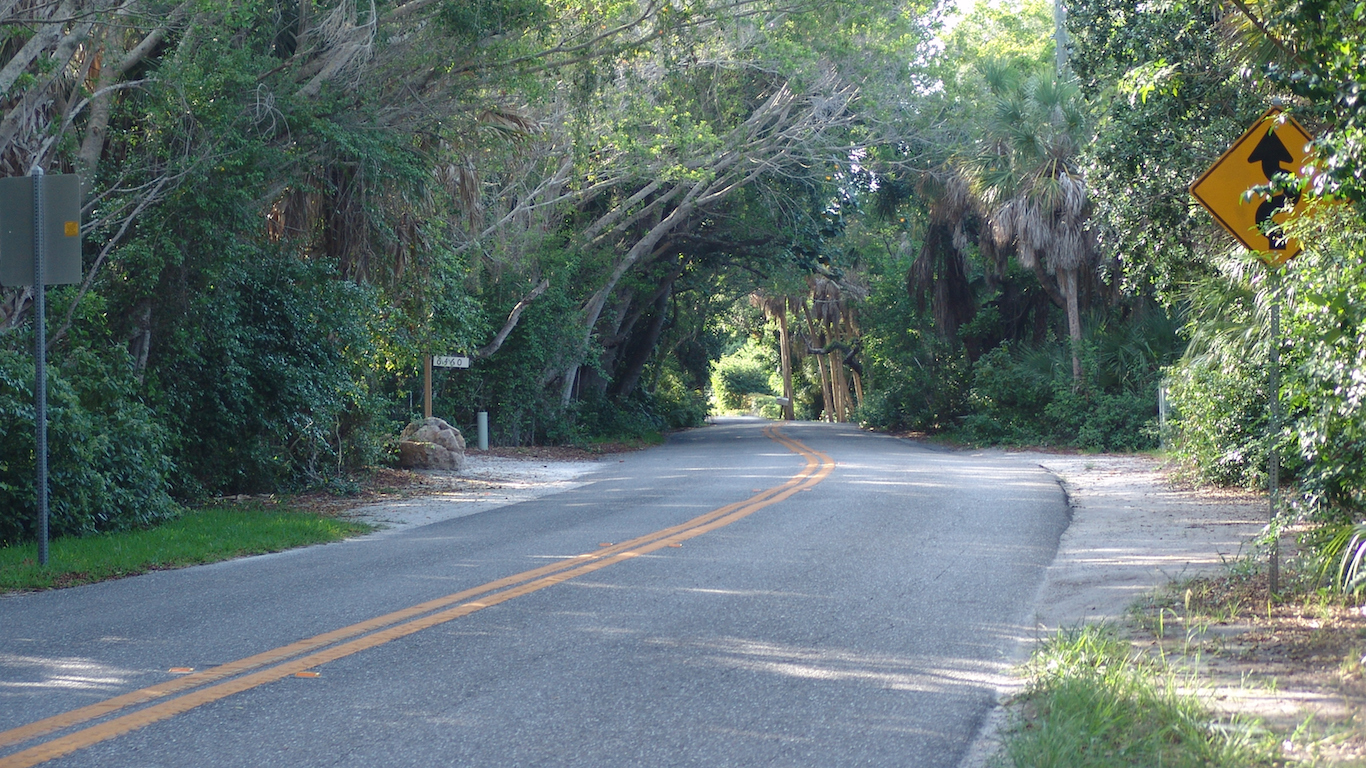
After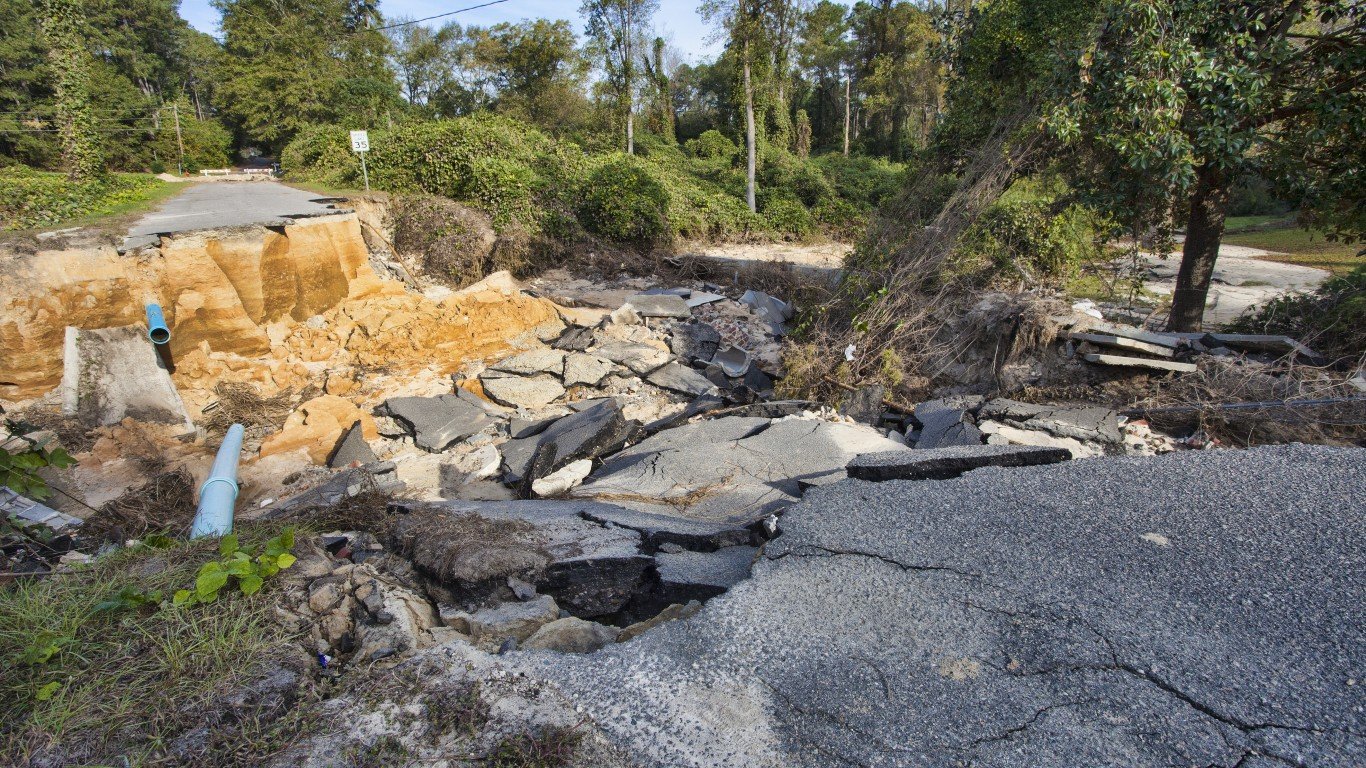
11. Matthew
> Damage: $10.30 billion
> Area pictured: North Carolina
> Max wind speed at landfall: 130 mph
> Date of landfall: October 2016
Before

After
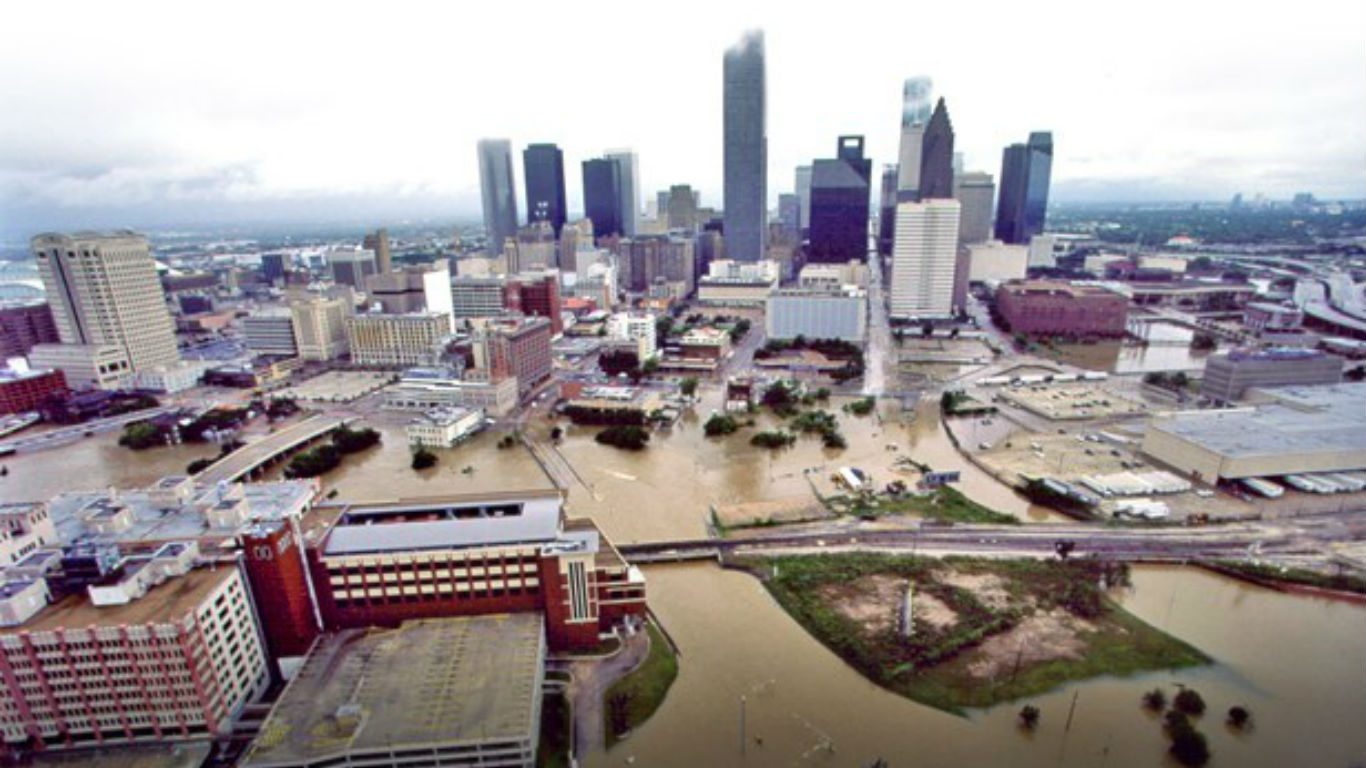
10. Allison
> Damage: $11.82 billion
> Area pictured: Houston, Texas
> Max wind speed at landfall: 45 mph
> Date of landfall: June 2001
[recirclink id=578696]
Before
After
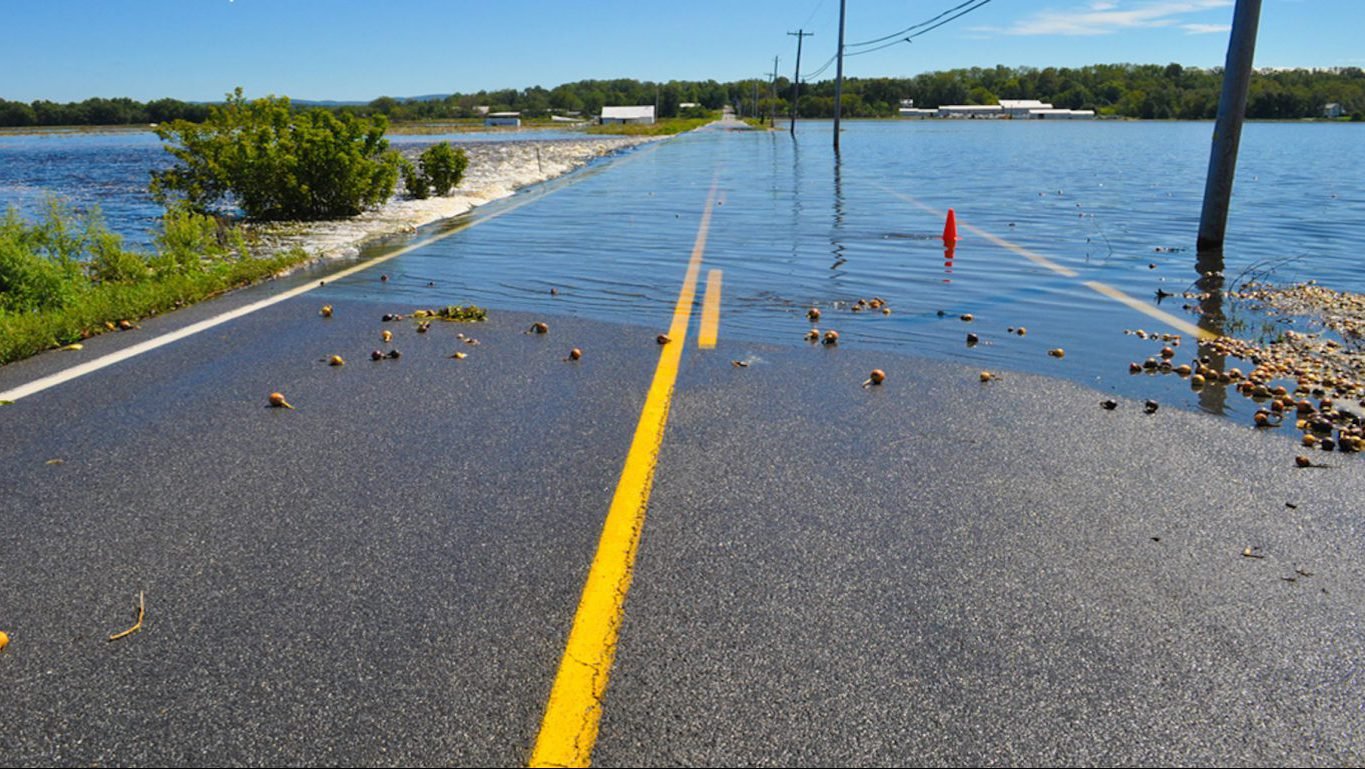
9. Irene
> Damage: $14.98 billion
> Area pictured: Pine Island, New York
> Max wind speed at landfall: 100 mph
> Date of landfall: August 2011
[in-text-ad-2]
Before
After
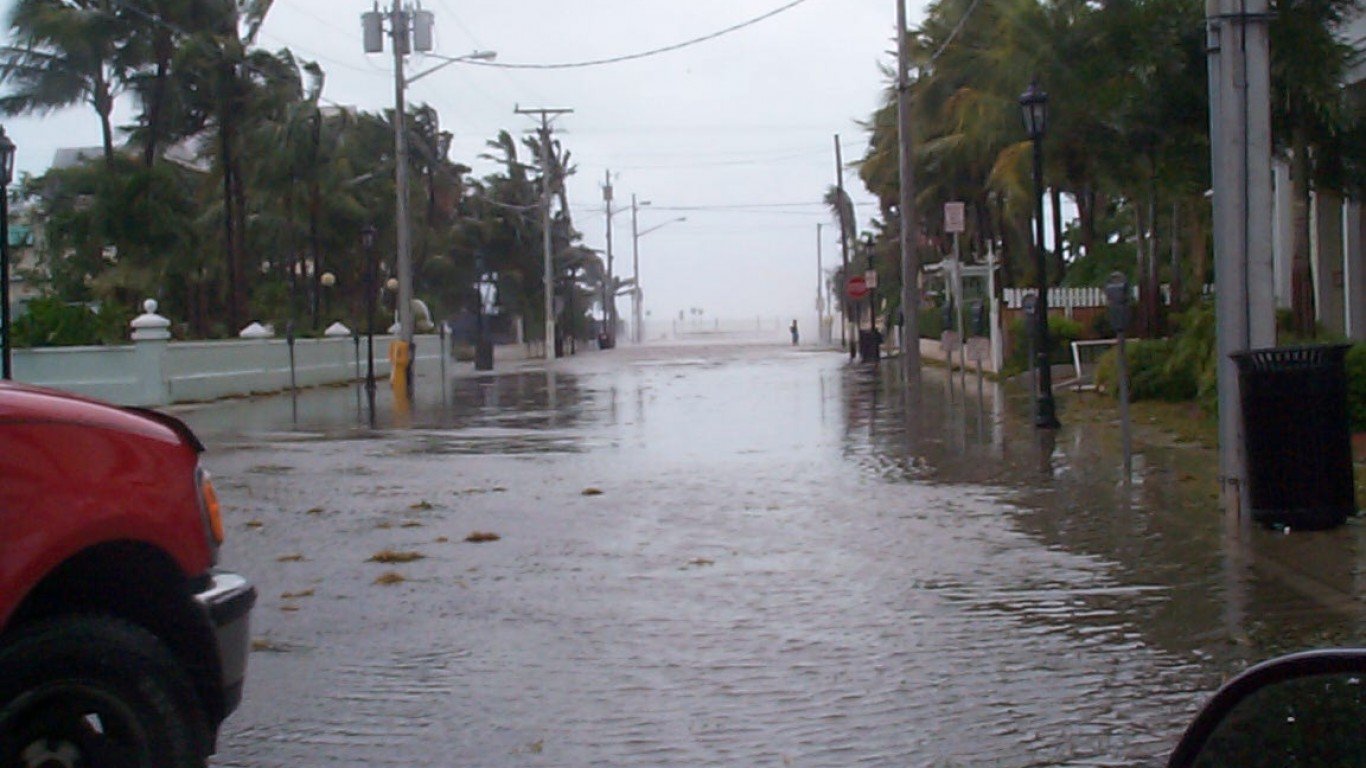
8. Charley
> Damage: $21.12 billion
> Area pictured: Key West, Florida
> Max wind speed at landfall: 130 mph
> Date of landfall: August 2004
Before
After
7. Rita
> Damage: $23.68 billion
> Area pictured: Holly Beach, Louisiana
> Max wind speed at landfall: 100 mph
> Date of landfall: September 2005
[in-text-ad]
Before

After
6. Wilma
> Damage: $24.32 billion
> Area pictured: Florida Keys
> Max wind speed at landfall: 130 mph
> Date of landfall: October 2005
Before
After
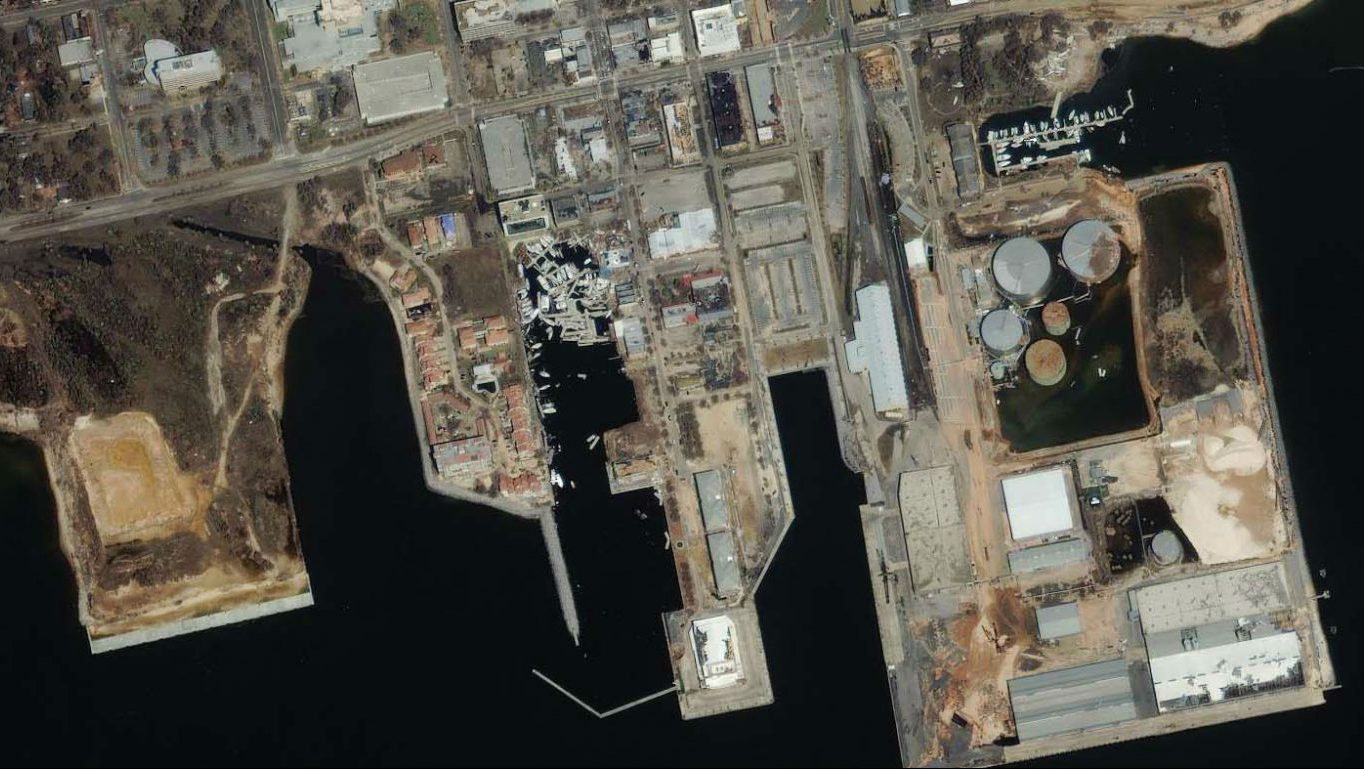
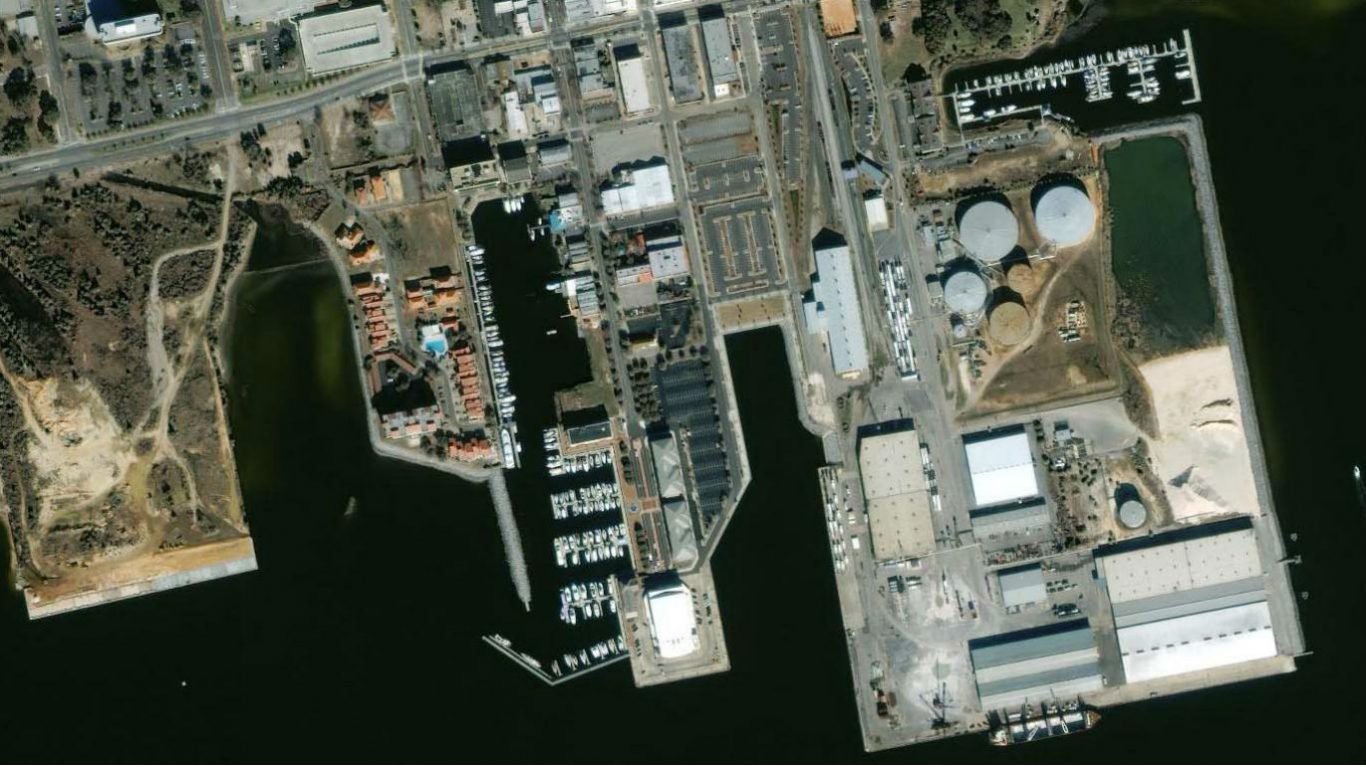
5. Ivan
> Damage: $27.06 billion
> Area pictured: Pensacola, Florida
> Max wind speed at landfall: 105 mph
> Date of landfall: September 2004
[in-text-ad-2]
Before
After
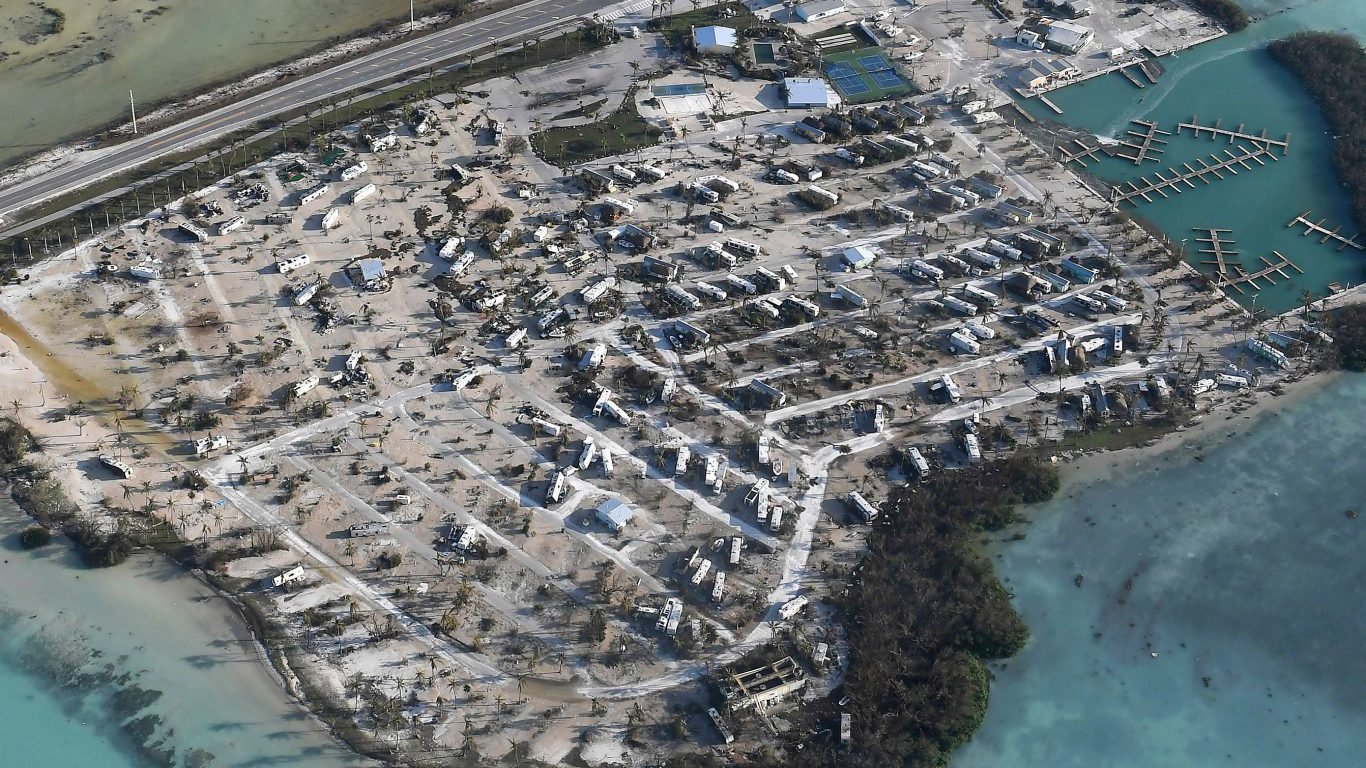
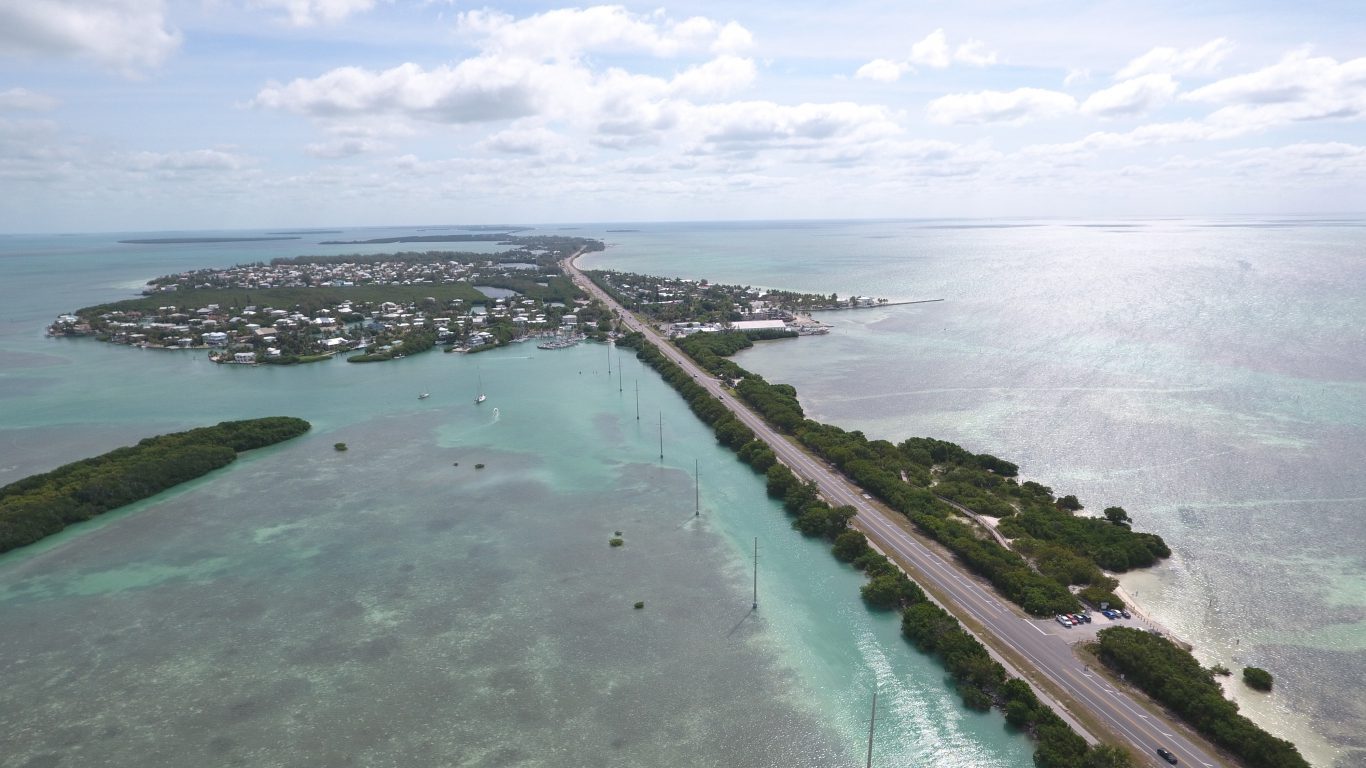
4. Irma
> Damage: $50.00 billion
> Area pictured: Florida Keys
> Max wind speed at landfall: 155 mph
> Date of landfall: September 2017
Before

After
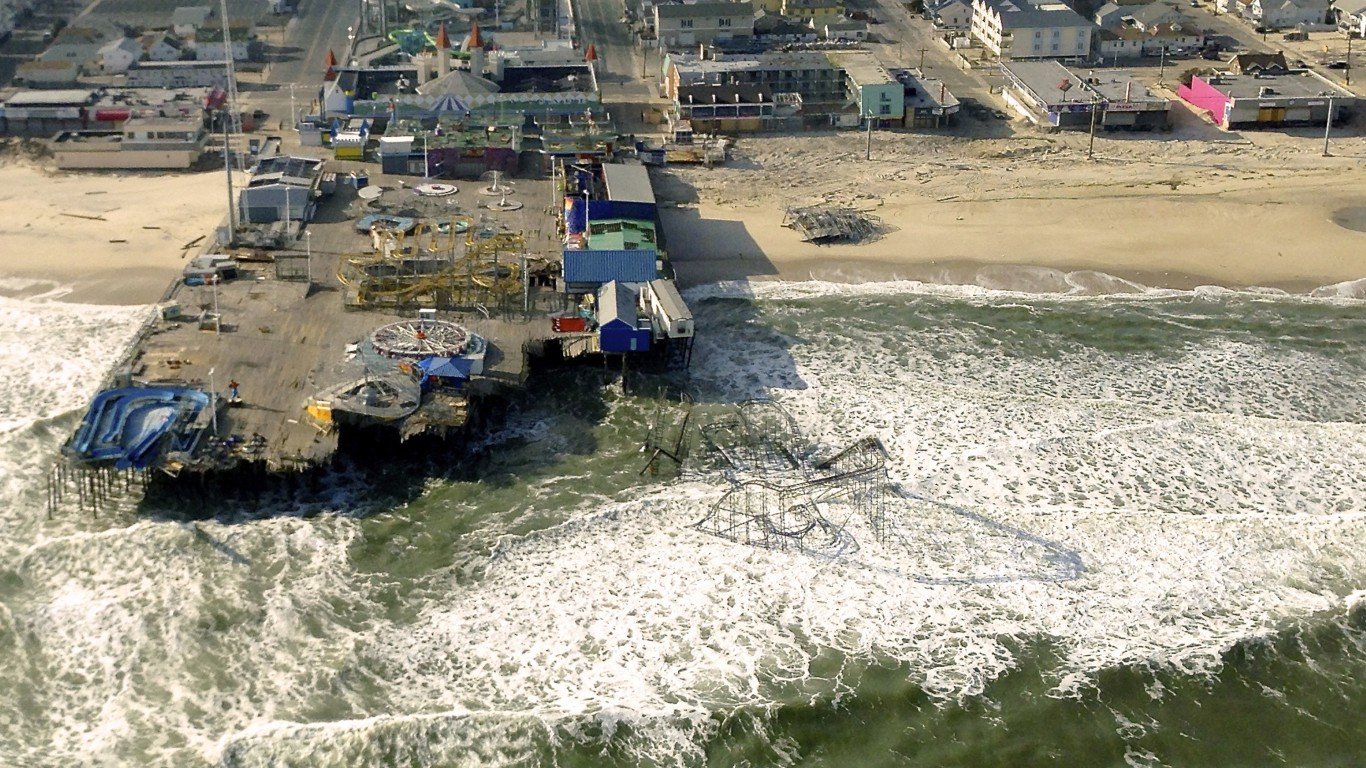
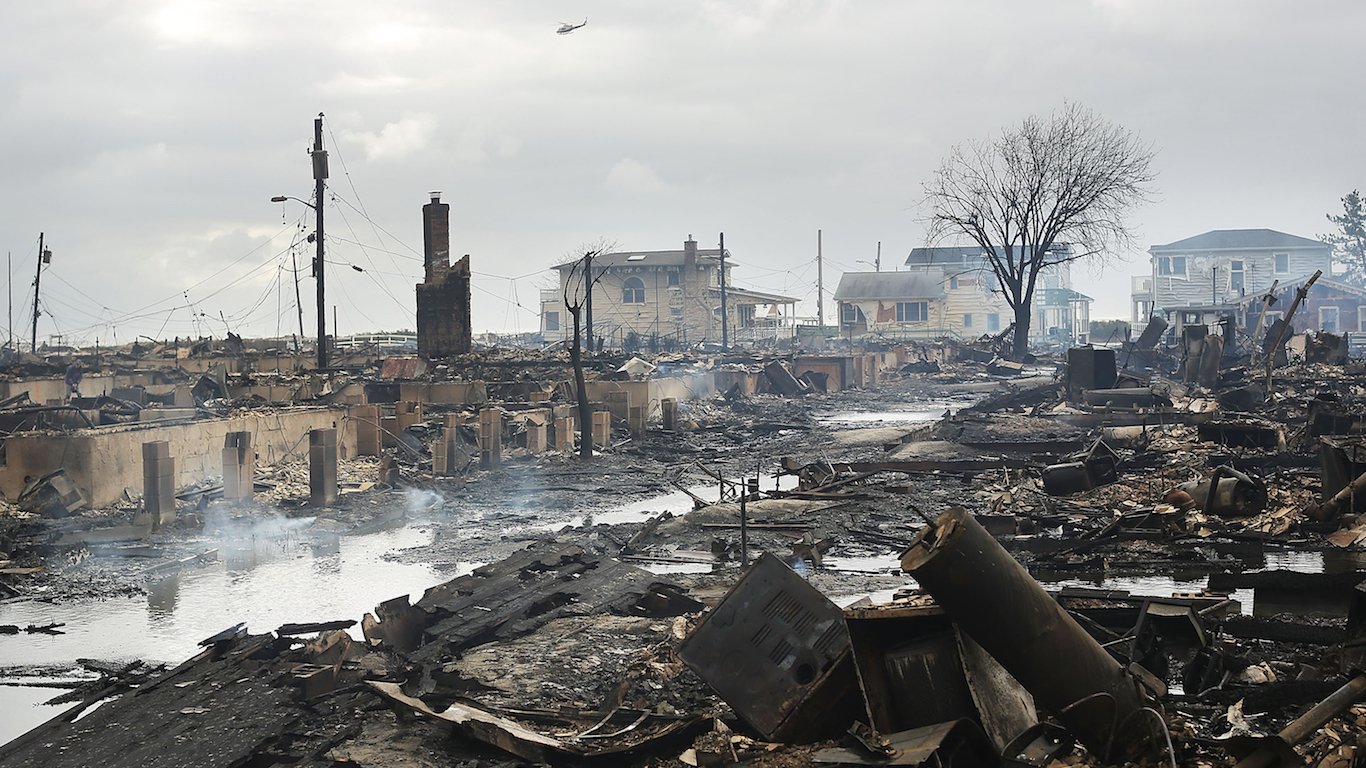
3. Sandy
> Damage: $70.20 billion
> Area pictured: Seaside Heights, New Jersey
> Max wind speed at landfall: 100 mph
> Date of landfall: October 2012
[in-text-ad]
Before
After
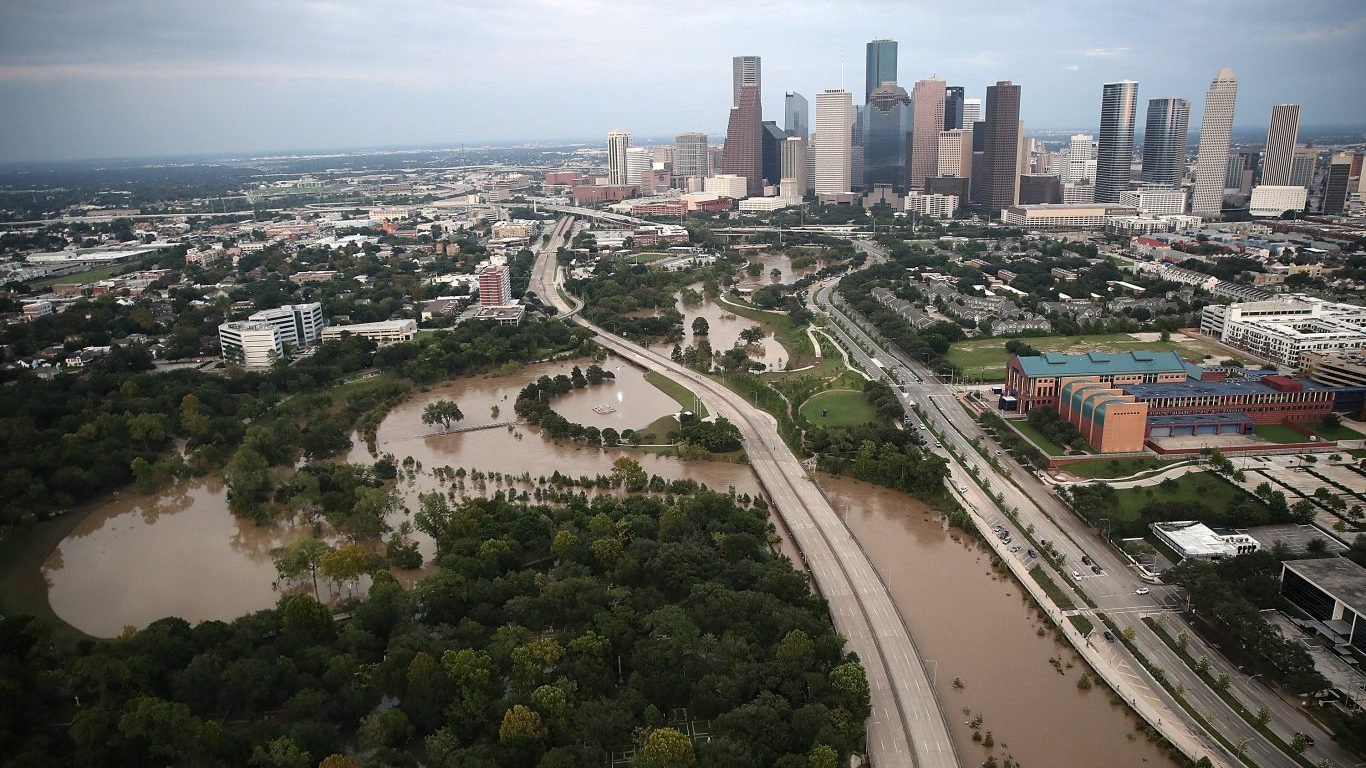
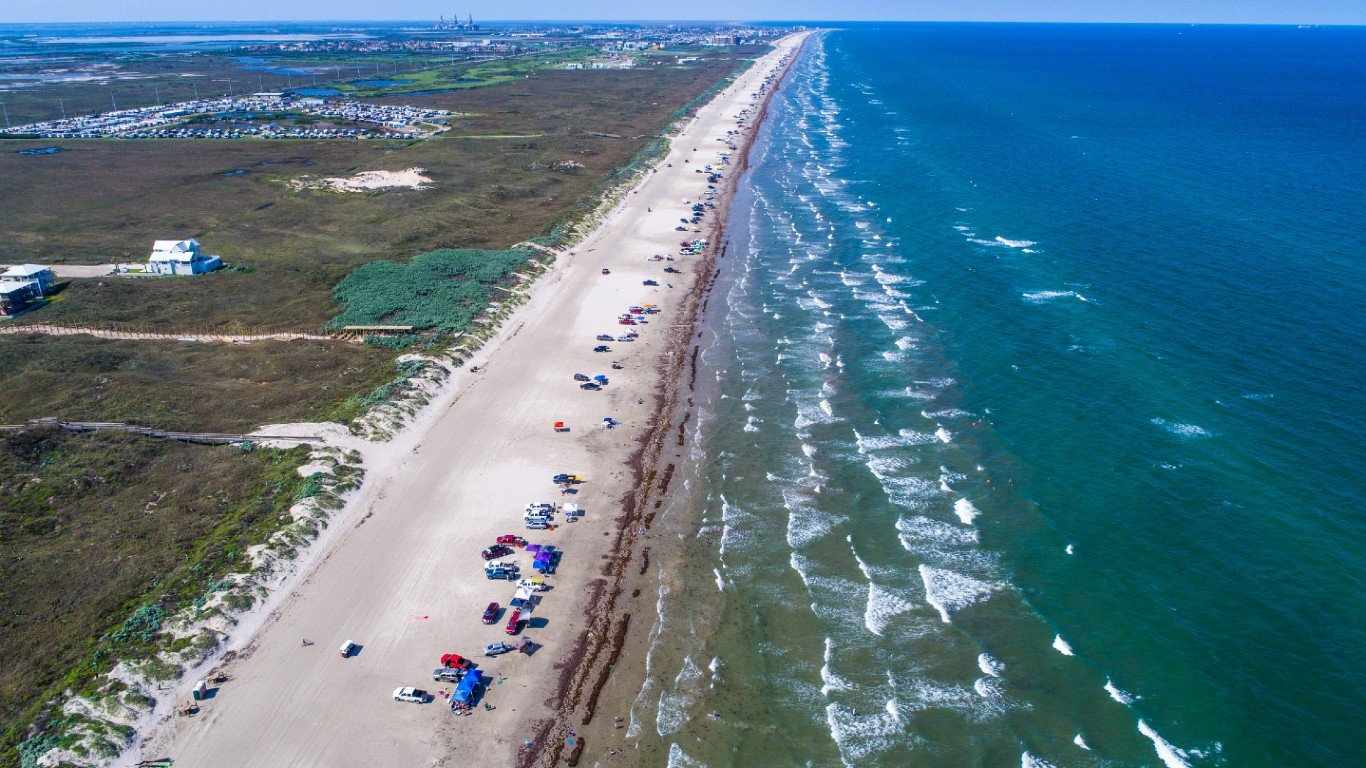
2. Harvey
> Damage: $125.00 billion
> Area pictured: Houston, Texas
> Max wind speed at landfall: 115 mph
> Date of landfall: August 2017
[recirclink id=731694]
Before

After
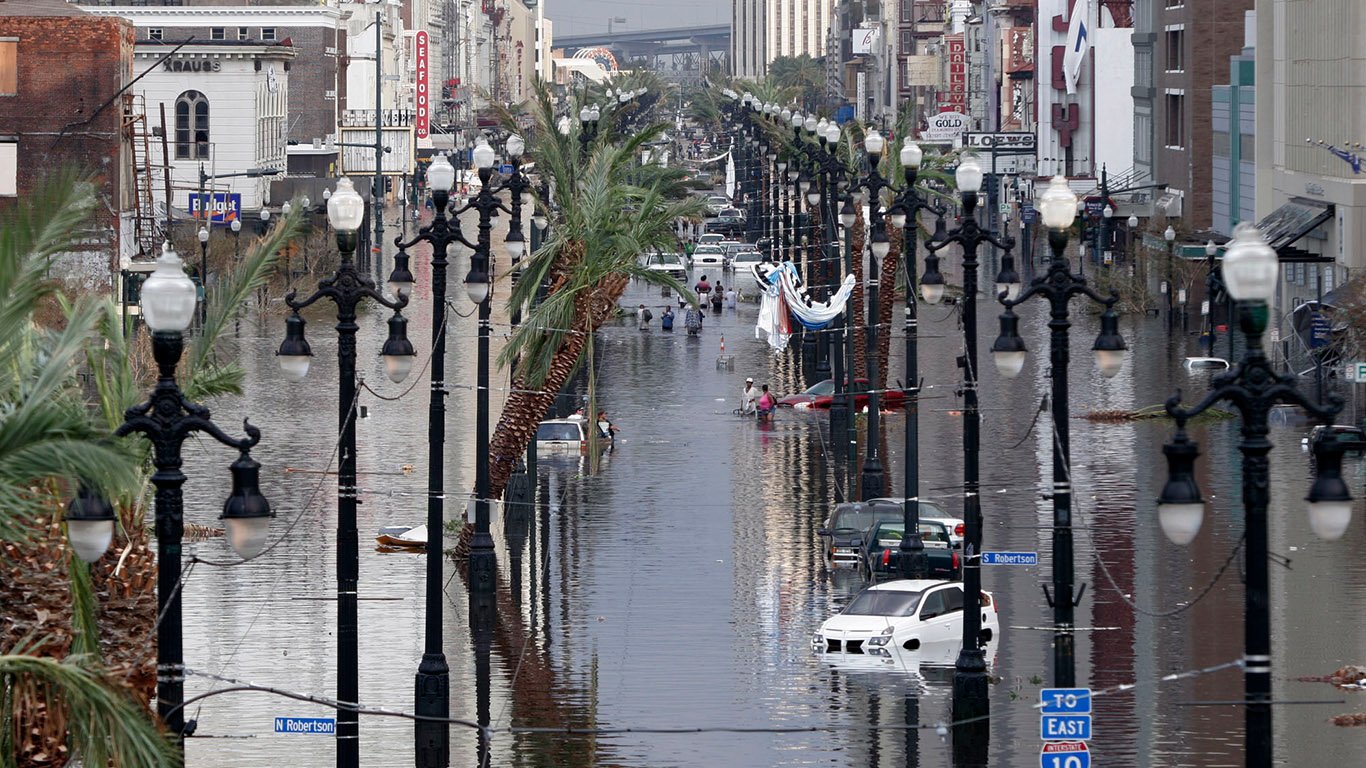
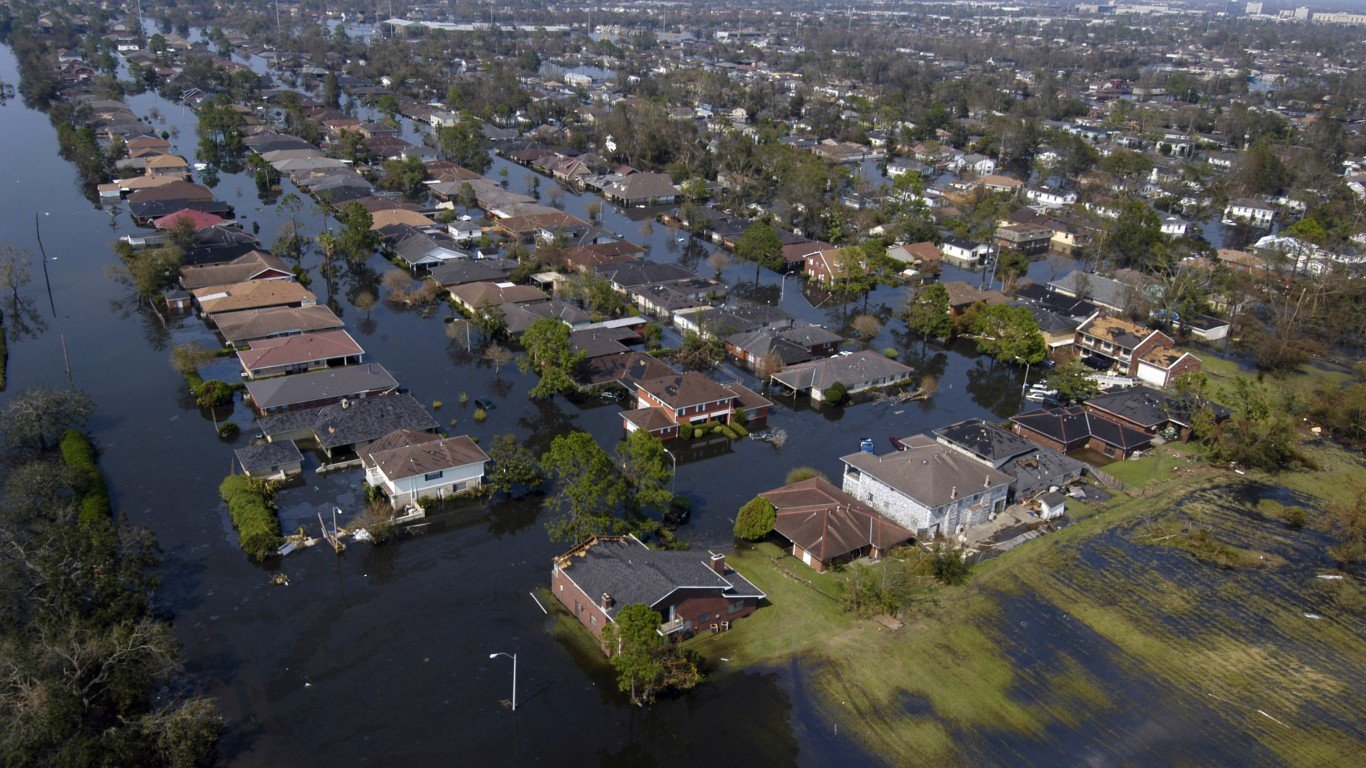
1. Katrina
> Damage: $160.00 billion
> Area pictured: New Orleans, Louisiana
> Max wind speed at landfall: 110 mph
> Date of landfall: August 2005
Contact [email protected] for any questions or corrections.