The U.S. faces a severe housing crunch. The country needs 3.8 million homes to house its citizens, according to estimates from Up For Growth, a research organization focused on housing affordability and production. That’s double from 2012, when the nation was 1.65 million units short. (Here is how much land people live on in every state.)
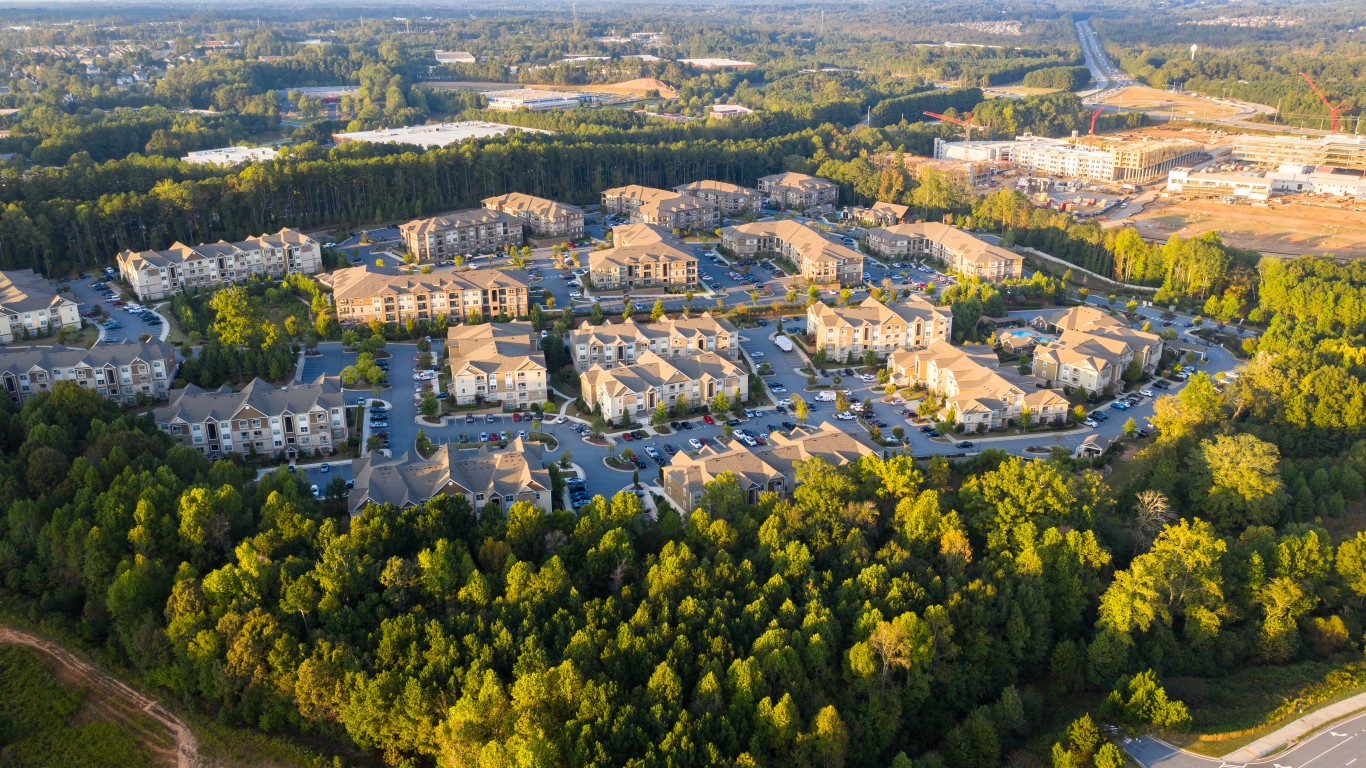
One potential solution is high-density housing. Buildings of five or more units can shelter more people on scarce urban and suburban land. In recent years, more cities across the country appear to be taking that approach, some growing their high-density building considerably more than others, often in response to development and population growth.
To determine the cities that are building the most new high density housing, 24/7 Wall St. reviewed data from the U.S. Census Bureau’s monthly Build Permits Survey, using annual data from 2021 and 2016. Cities were ranked based on the percentage-point change in the number of new construction permits for buildings with five units or more as a share of all buildings from 2016 to 2021. All other data came from the Census.
Ranking by the change in high-density building permits, the Philadelphia-Camden-Wilmington metro area straddling New Jersey, Pennsylvania, Delaware, and Maryland could see a boom in multifamily construction if all are built. In 2021, 70% of new permits were for units of five or more units, up 34 points from 2016. Those units will help house the area’s 6 million residents.
Not far behind is the Santa Rosa-Petaluma, California metro area north of San Francisco. More than 50% of new permits were for multifamily buildings in 2021, a 24 point increase from 2016. Between 2016 and 2021, permits for five or more housing units skyrocketed 430%. Its current population stands at a bit less than 500,000. But considering its location at the fringe of the tech industry in northern California, that number will likely grow. (Find out if any of these cities are also among the cities with the strongest economies in 2022.)
No. 3 is Worcester, in central Massachusetts, which recorded a 21.1-point jump in new permits for dwellings of five or more units as a percentage of all permits from 2016 to 2021. About 37% of new permits were for multifamily construction. Meanwhile, 53% of permits in No. 50 Denver were registered last year for buildings of five or more units, but that was a mere 2.3 percentage points higher than in 2016. In 20 cities, there was a 10 point jump in new permits for housing of five or more units.
Click here to see cities where new apartment construction is skyrocketing.
Click here to see our detailed methodology.
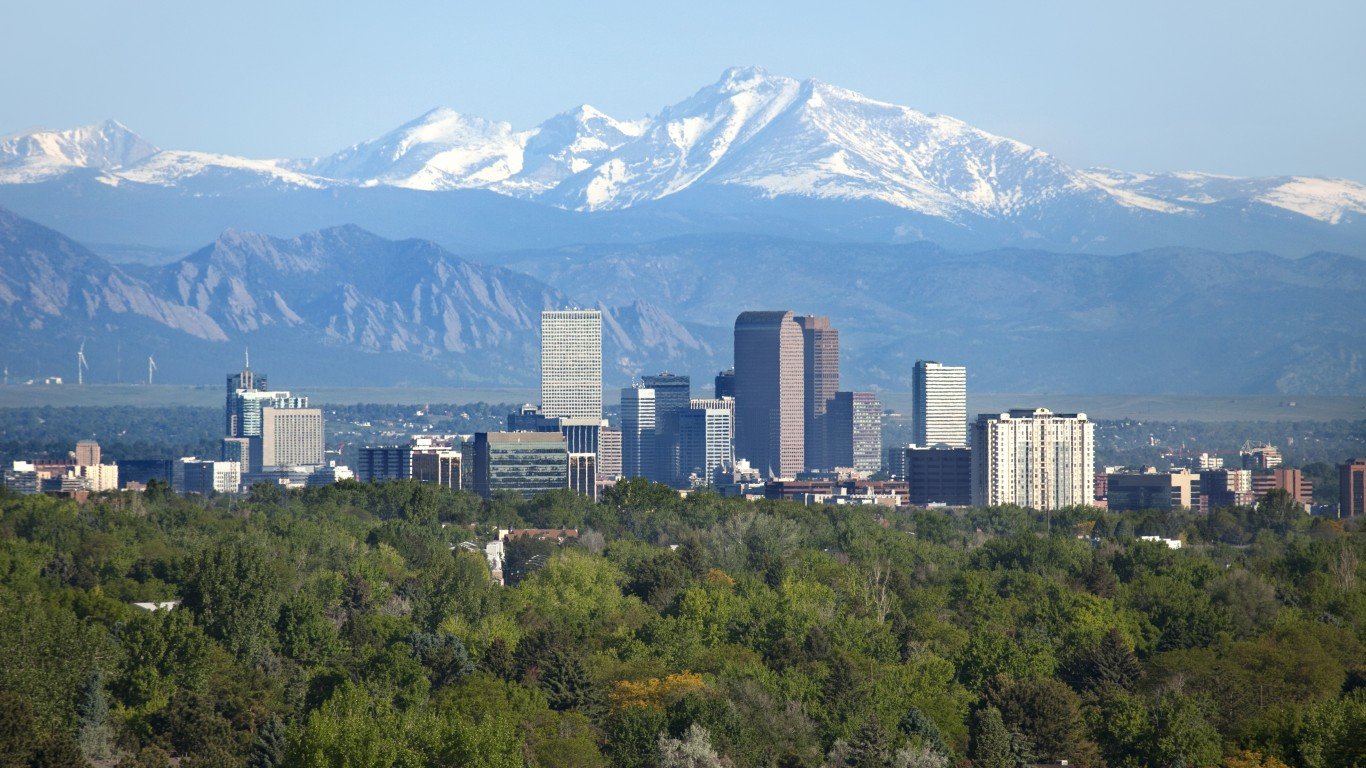
50. Denver-Aurora-Lakewood, CO
> New building permits with 5+ units, 2021: 53.4% of all permits (+2.3 ppts from 2016)
> New building permits with 5+ units, 2016: 51.1% of all permits
> Median rent: $1,605 per month
> Population density, 2021: 356.2 people per square mile
> Total population, 2021: 3.0 million
[in-text-ad]
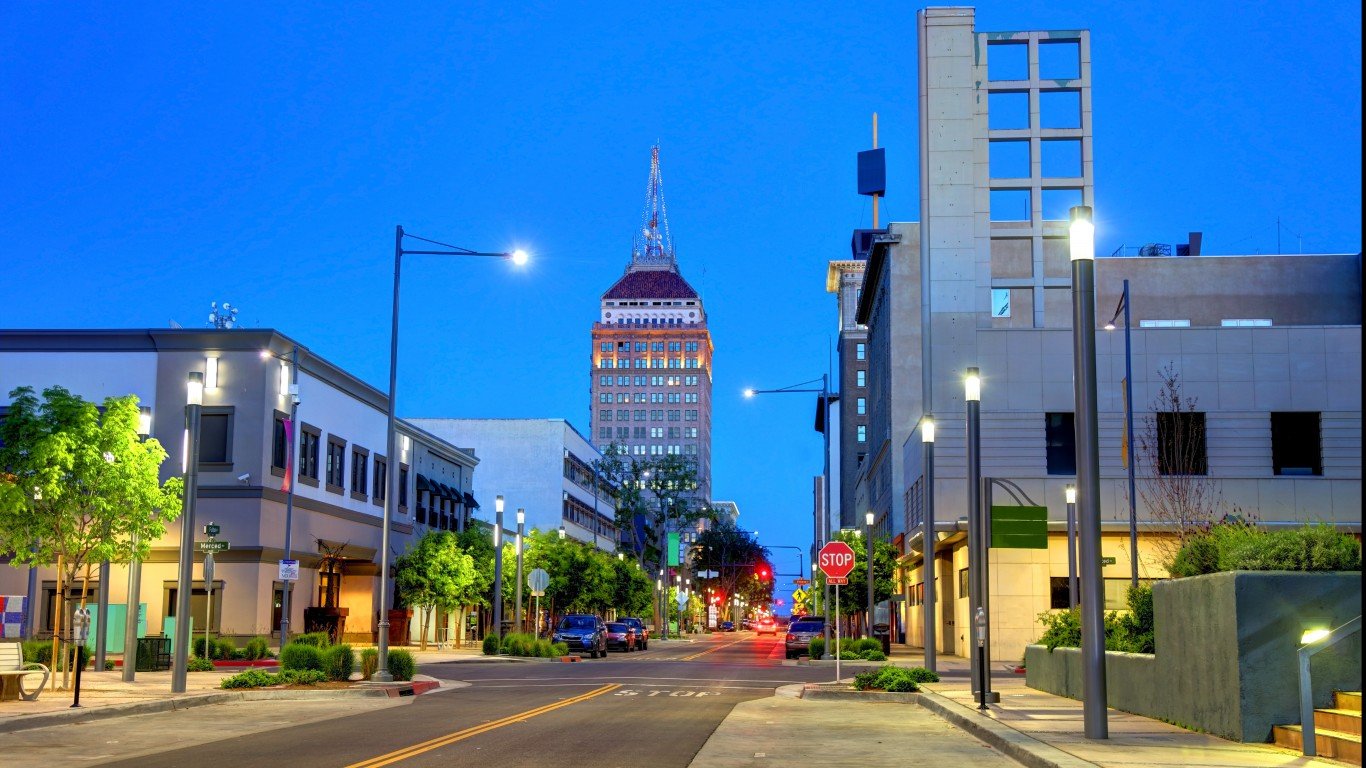
49. Fresno, CA
> New building permits with 5+ units, 2021: 11.8% of all permits (+2.3 ppts from 2016)
> New building permits with 5+ units, 2016: 9.5% of all permits
> Median rent: $1,164 per month
> Population density, 2021: 170.1 people per square mile
> Total population, 2021: 1.0 million
[recirclink id=1165715]
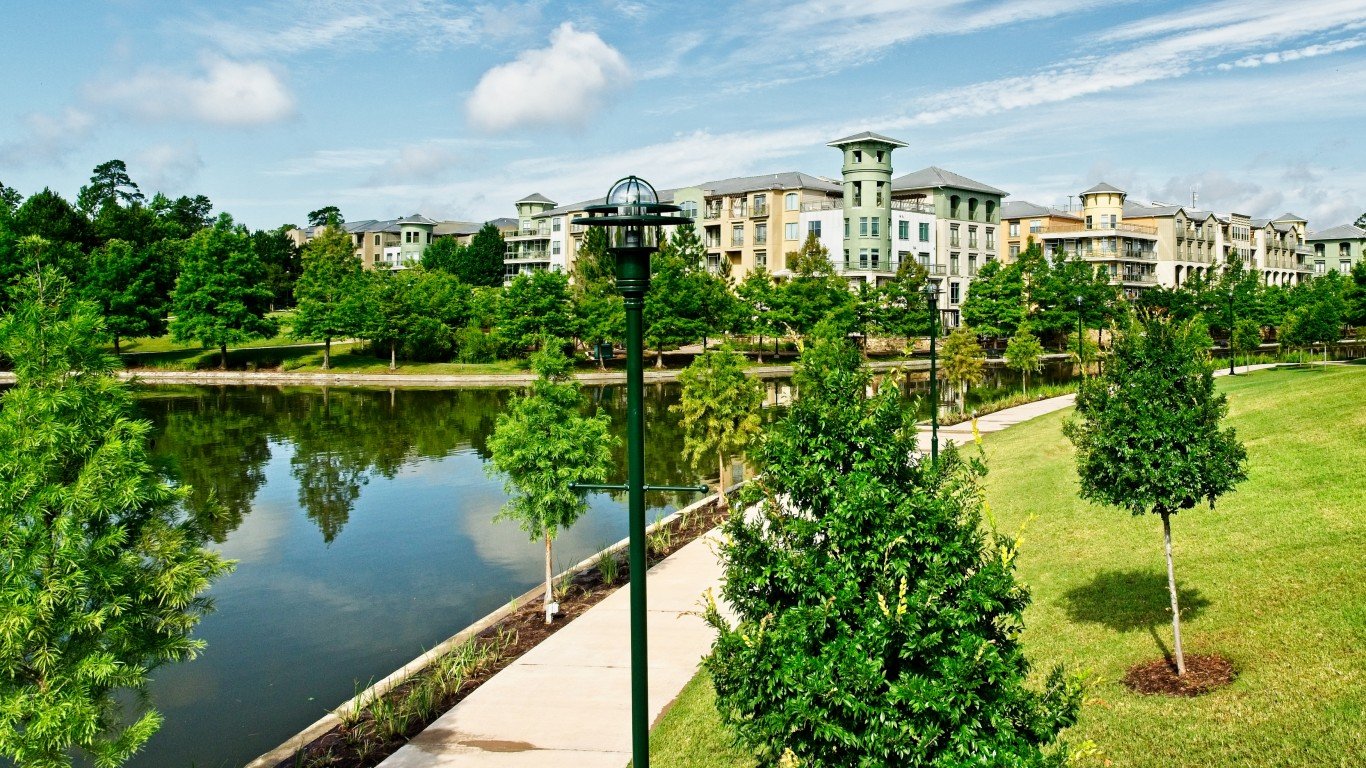
48. Houston-The Woodlands-Sugar Land, TX
> New building permits with 5+ units, 2021: 22.6% of all permits (+2.4 ppts from 2016)
> New building permits with 5+ units, 2016: 20.2% of all permits
> Median rent: $1,190 per month
> Population density, 2021: 871.6 people per square mile
> Total population, 2021: 7.2 million
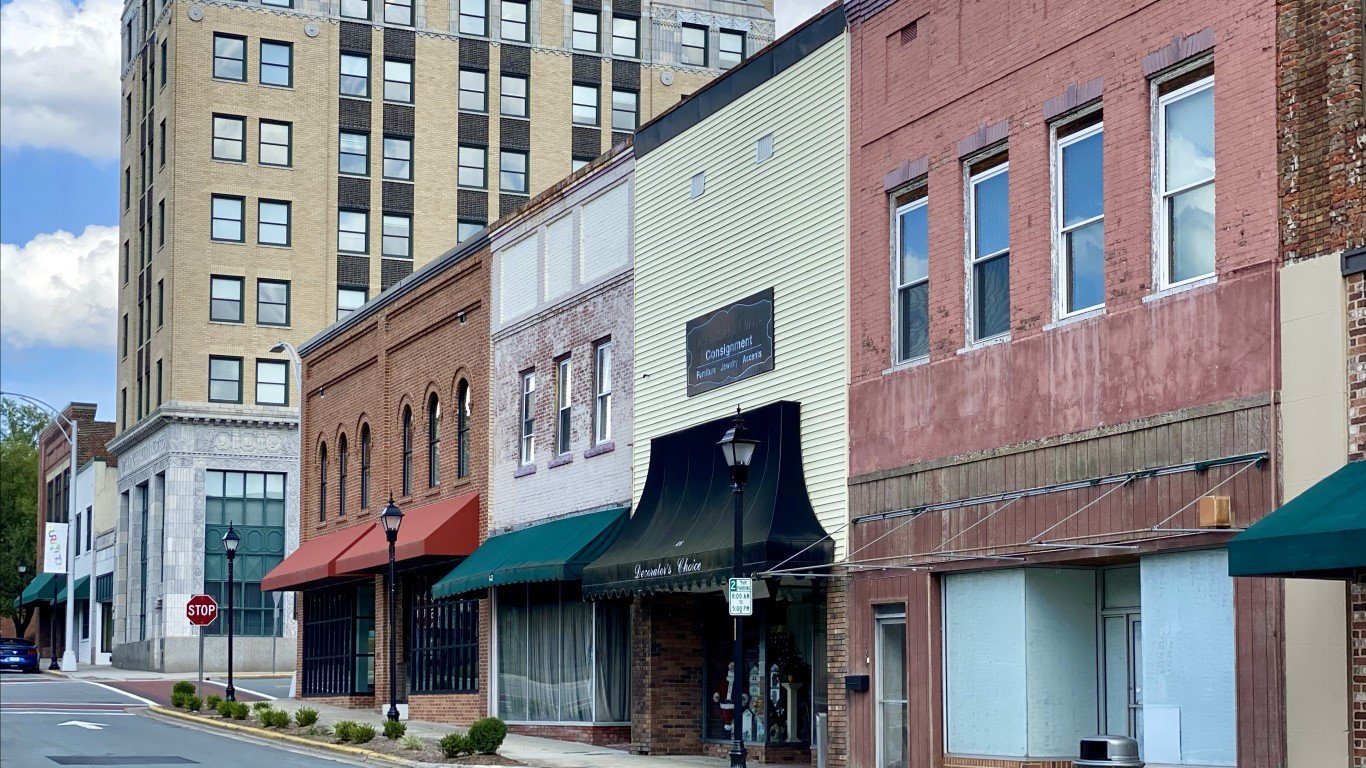
47. Burlington, NC
> New building permits with 5+ units, 2021: 31.0% of all permits (+2.4 ppts from 2016)
> New building permits with 5+ units, 2016: 28.6% of all permits
> Median rent: $894 per month
> Population density, 2021: 410.6 people per square mile
> Total population, 2021: 173,877
[in-text-ad-2]

46. New York-Newark-Jersey City, NY-NJ-PA
> New building permits with 5+ units, 2021: 72.8% of all permits (+2.6 ppts from 2016)
> New building permits with 5+ units, 2016: 70.2% of all permits
> Median rent: $1,600 per month
> Population density, 2021: 2,957.4 people per square mile
> Total population, 2021: 19.8 million
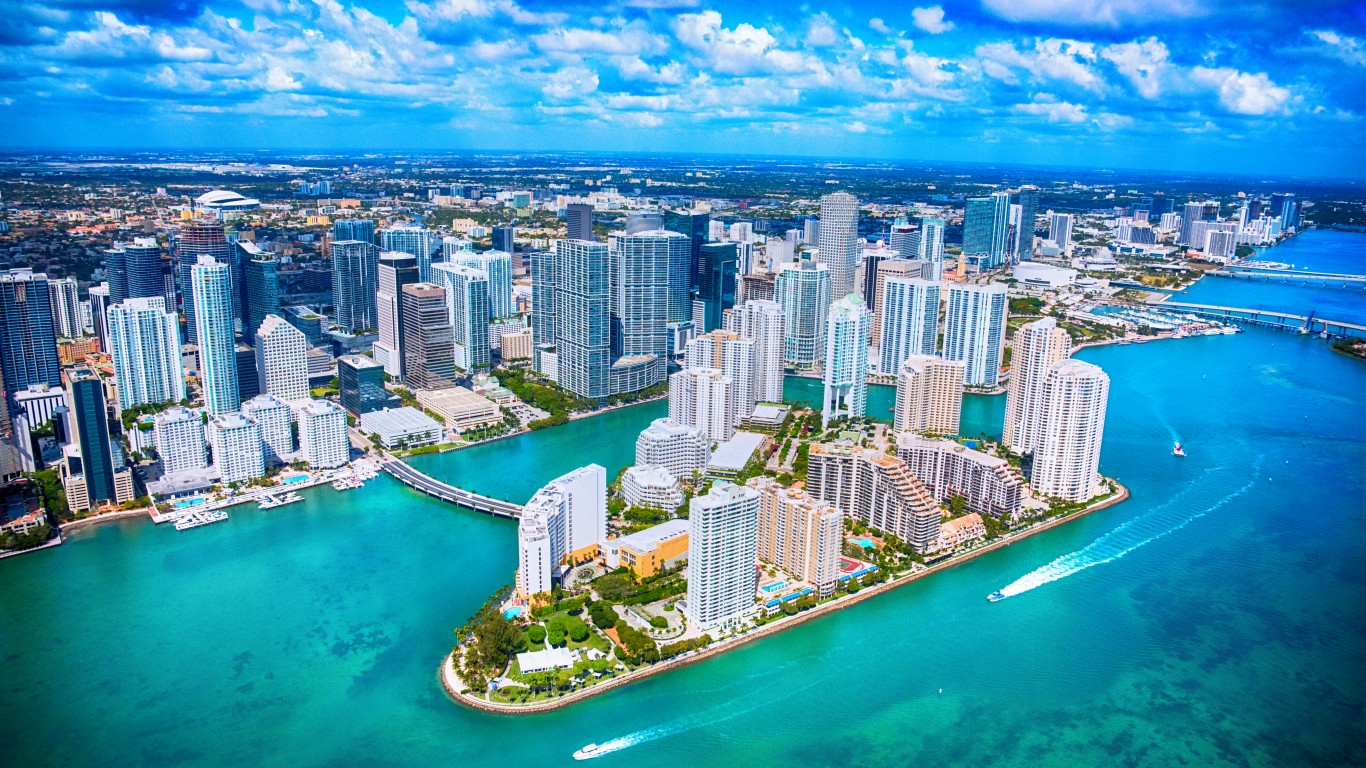
45. Miami-Fort Lauderdale-Pompano Beach, FL
> New building permits with 5+ units, 2021: 65.4% of all permits (+2.8 ppts from 2016)
> New building permits with 5+ units, 2016: 62.6% of all permits
> Median rent: $1,519 per month
> Population density, 2021: 1,202.2 people per square mile
> Total population, 2021: 6.1 million
[in-text-ad]

44. Virginia Beach-Norfolk-Newport News, VA-NC
> New building permits with 5+ units, 2021: 34.6% of all permits (+3.3 ppts from 2016)
> New building permits with 5+ units, 2016: 31.3% of all permits
> Median rent: $1,232 per month
> Population density, 2021: 511.7 people per square mile
> Total population, 2021: 1.8 million
[recirclink id=1165876]

43. Boulder, CO
> New building permits with 5+ units, 2021: 62.4% of all permits (+3.6 ppts from 2016)
> New building permits with 5+ units, 2016: 58.8% of all permits
> Median rent: $1,732 per month
> Population density, 2021: 453.7 people per square mile
> Total population, 2021: 329,543

42. Orlando-Kissimmee-Sanford, FL
> New building permits with 5+ units, 2021: 40.7% of all permits (+3.7 ppts from 2016)
> New building permits with 5+ units, 2016: 37.0% of all permits
> Median rent: $1,420 per month
> Population density, 2021: 771.0 people per square mile
> Total population, 2021: 2.7 million
[in-text-ad-2]
41. Greeley, CO
> New building permits with 5+ units, 2021: 19.9% of all permits (+3.9 ppts from 2016)
> New building permits with 5+ units, 2016: 16.1% of all permits
> Median rent: $1,333 per month
> Population density, 2021: 85.3 people per square mile
> Total population, 2021: 340,036
40. Durham-Chapel Hill, NC
> New building permits with 5+ units, 2021: 35.9% of all permits (+3.9 ppts from 2016)
> New building permits with 5+ units, 2016: 32.0% of all permits
> Median rent: $1,147 per month
> Population density, 2021: 285.6 people per square mile
> Total population, 2021: 654,012
[in-text-ad]

39. Raleigh-Cary, NC
> New building permits with 5+ units, 2021: 34.0% of all permits (+4.2 ppts from 2016)
> New building permits with 5+ units, 2016: 29.9% of all permits
> Median rent: $1,266 per month
> Population density, 2021: 683.7 people per square mile
> Total population, 2021: 1.4 million
[recirclink id=1129695]
38. Springfield, MO
> New building permits with 5+ units, 2021: 34.0% of all permits (+4.3 ppts from 2016)
> New building permits with 5+ units, 2016: 29.7% of all permits
> Median rent: $802 per month
> Population density, 2021: 159.5 people per square mile
> Total population, 2021: 479,598
37. Albany-Schenectady-Troy, NY
> New building permits with 5+ units, 2021: 43.8% of all permits (+4.6 ppts from 2016)
> New building permits with 5+ units, 2016: 39.3% of all permits
> Median rent: $1,091 per month
> Population density, 2021: 319.8 people per square mile
> Total population, 2021: 899,286
[in-text-ad-2]
36. Santa Maria-Santa Barbara, CA
> New building permits with 5+ units, 2021: 49.9% of all permits (+4.8 ppts from 2016)
> New building permits with 5+ units, 2016: 45.1% of all permits
> Median rent: $1,859 per month
> Population density, 2021: 163.3 people per square mile
> Total population, 2021: 446,475

35. New Orleans-Metairie, LA
> New building permits with 5+ units, 2021: 17.5% of all permits (+5.1 ppts from 2016)
> New building permits with 5+ units, 2016: 12.4% of all permits
> Median rent: $1,069 per month
> Population density, 2021: 393.9 people per square mile
> Total population, 2021: 1.3 million
[in-text-ad]

34. Portland-South Portland, ME
> New building permits with 5+ units, 2021: 23.1% of all permits (+5.1 ppts from 2016)
> New building permits with 5+ units, 2016: 18.0% of all permits
> Median rent: $1,204 per month
> Population density, 2021: 267.6 people per square mile
> Total population, 2021: 556,893
[recirclink id=1163587]
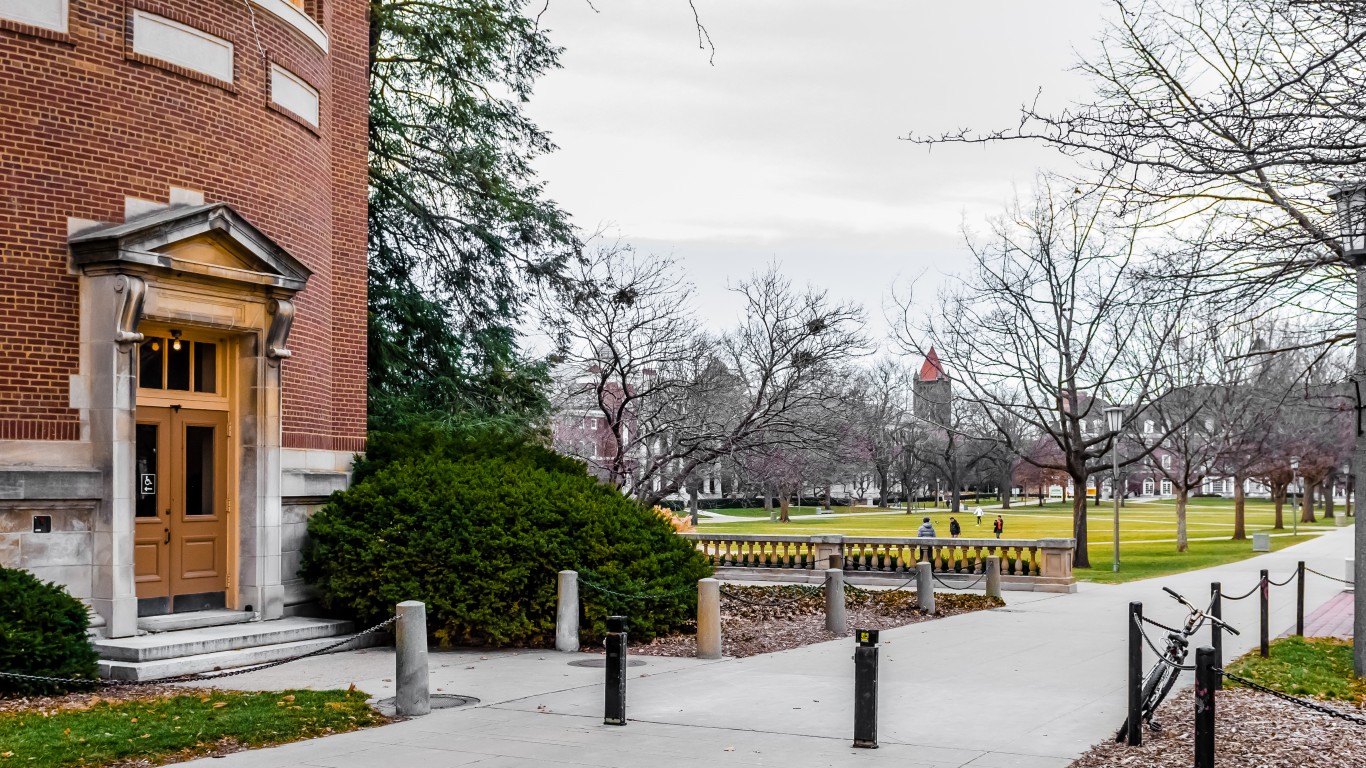
33. Champaign-Urbana, IL
> New building permits with 5+ units, 2021: 56.0% of all permits (+5.4 ppts from 2016)
> New building permits with 5+ units, 2016: 50.6% of all permits
> Median rent: $913 per month
> Population density, 2021: 155.2 people per square mile
> Total population, 2021: 222,696
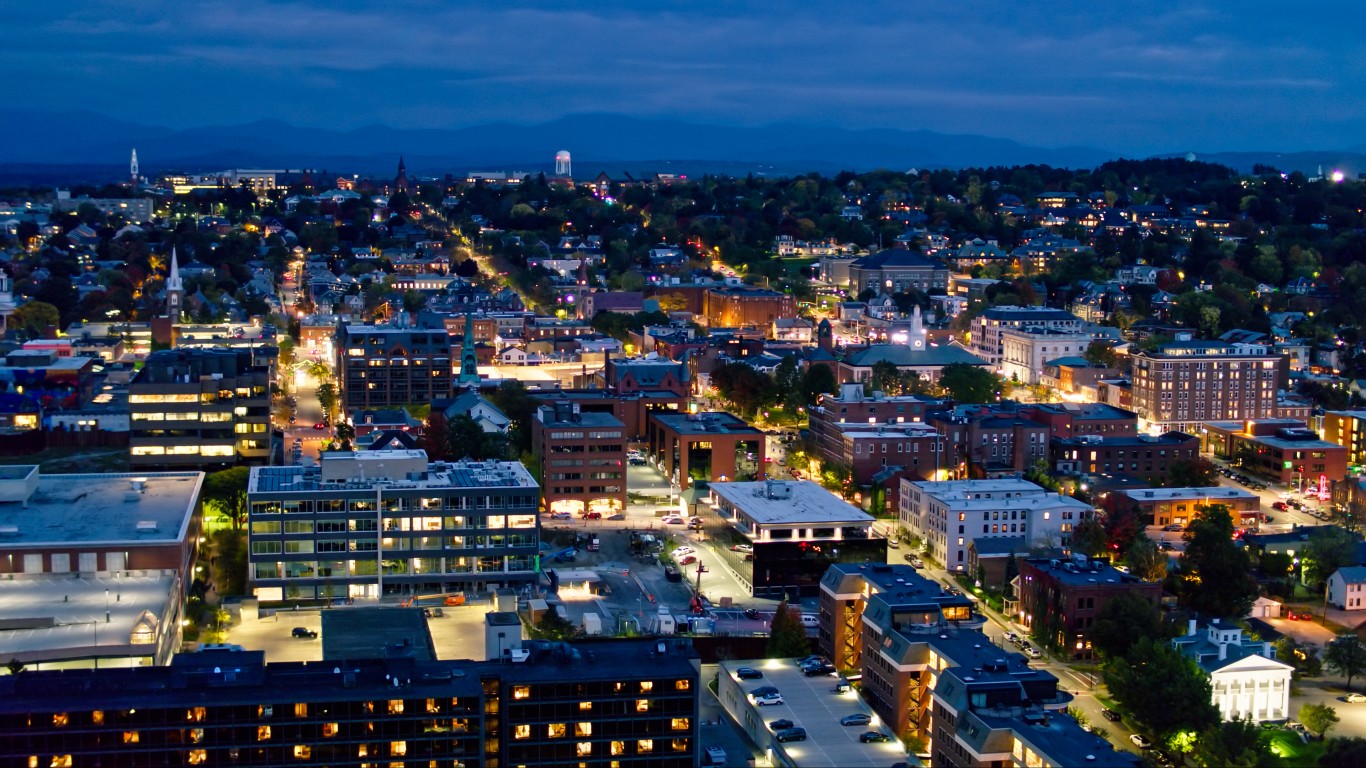
32. Burlington-South Burlington, VT
> New building permits with 5+ units, 2021: 49.9% of all permits (+5.4 ppts from 2016)
> New building permits with 5+ units, 2016: 44.5% of all permits
> Median rent: $1,458 per month
> Population density, 2021: 181.4 people per square mile
> Total population, 2021: 226,715
[in-text-ad-2]

31. Cincinnati, OH-KY-IN
> New building permits with 5+ units, 2021: 34.3% of all permits (+5.9 ppts from 2016)
> New building permits with 5+ units, 2016: 28.4% of all permits
> Median rent: $923 per month
> Population density, 2021: 497.5 people per square mile
> Total population, 2021: 2.3 million

30. Seattle-Tacoma-Bellevue, WA
> New building permits with 5+ units, 2021: 66.1% of all permits (+6.9 ppts from 2016)
> New building permits with 5+ units, 2016: 59.2% of all permits
> Median rent: $1,730 per month
> Population density, 2021: 683.4 people per square mile
> Total population, 2021: 4.0 million
[in-text-ad]

29. Coeur dAlene, ID
> New building permits with 5+ units, 2021: 29.3% of all permits (+8.4 ppts from 2016)
> New building permits with 5+ units, 2016: 20.9% of all permits
> Median rent: $1,176 per month
> Population density, 2021: 145.3 people per square mile
> Total population, 2021: 179,789
[recirclink id=1159308]

28. Huntsville, AL
> New building permits with 5+ units, 2021: 30.9% of all permits (+8.5 ppts from 2016)
> New building permits with 5+ units, 2016: 22.5% of all permits
> Median rent: $974 per month
> Population density, 2021: 369.2 people per square mile
> Total population, 2021: 502,728
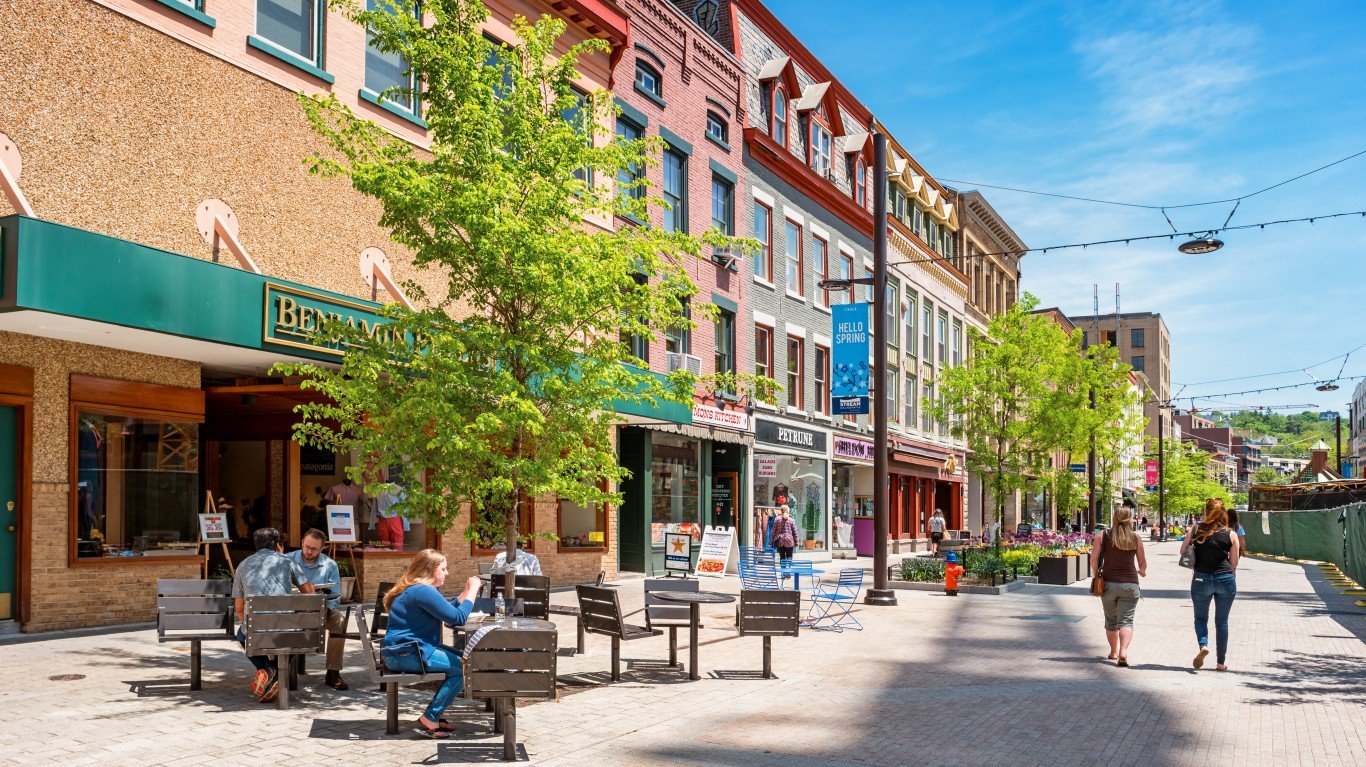
27. Ithaca, NY
> New building permits with 5+ units, 2021: 79.7% of all permits (+9.0 ppts from 2016)
> New building permits with 5+ units, 2016: 70.6% of all permits
> Median rent: $1,272 per month
> Population density, 2021: 221.6 people per square mile
> Total population, 2021: 105,162
[in-text-ad-2]

26. Nashville-Davidson–Murfreesboro–Franklin, TN
> New building permits with 5+ units, 2021: 45.0% of all permits (+9.3 ppts from 2016)
> New building permits with 5+ units, 2016: 35.7% of all permits
> Median rent: $1,260 per month
> Population density, 2021: 353.9 people per square mile
> Total population, 2021: 2.0 million

25. Detroit-Warren-Dearborn, MI
> New building permits with 5+ units, 2021: 30.9% of all permits (+9.5 ppts from 2016)
> New building permits with 5+ units, 2016: 21.5% of all permits
> Median rent: $1,051 per month
> Population density, 2021: 1,121.5 people per square mile
> Total population, 2021: 4.4 million
[in-text-ad]
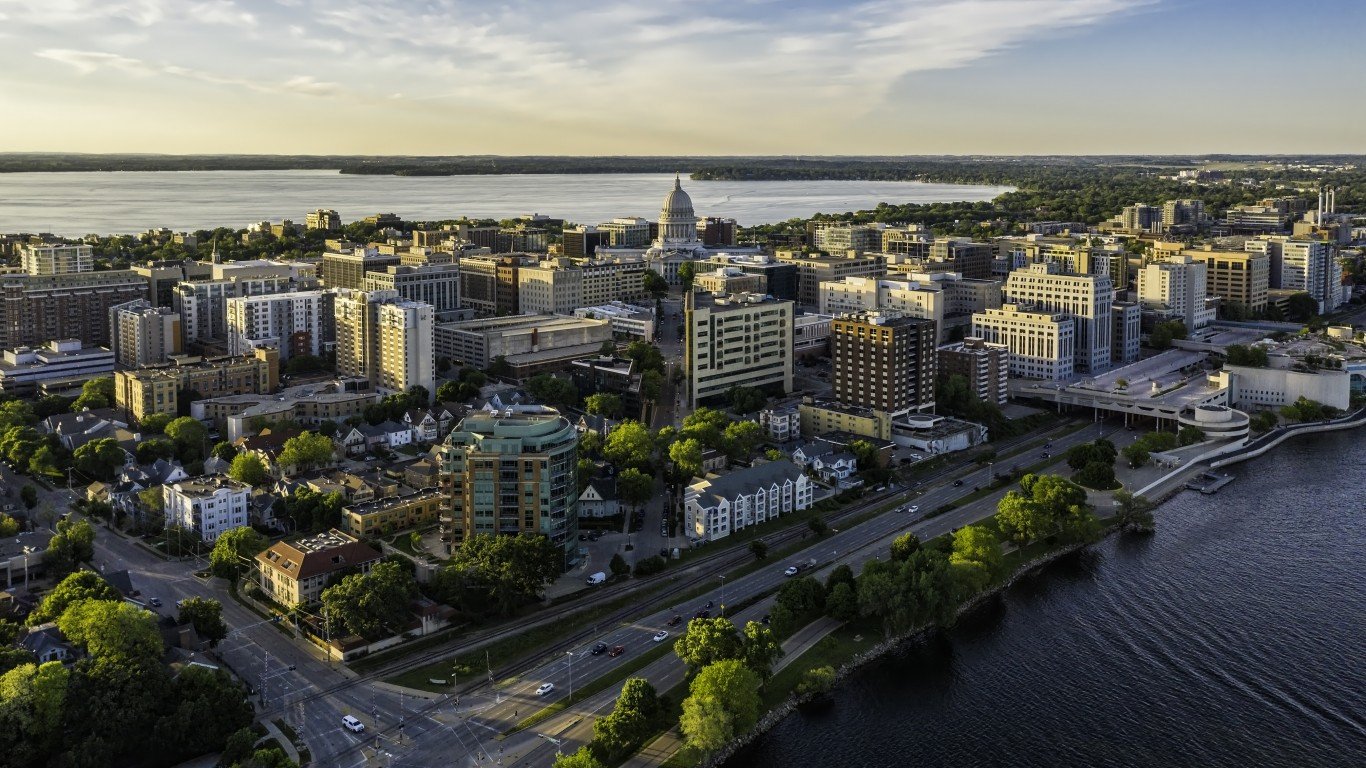
24. Madison, WI
> New building permits with 5+ units, 2021: 72.8% of all permits (+9.6 ppts from 2016)
> New building permits with 5+ units, 2016: 63.2% of all permits
> Median rent: $1,157 per month
> Population density, 2021: 206.5 people per square mile
> Total population, 2021: 683,183
[recirclink id=1165715]
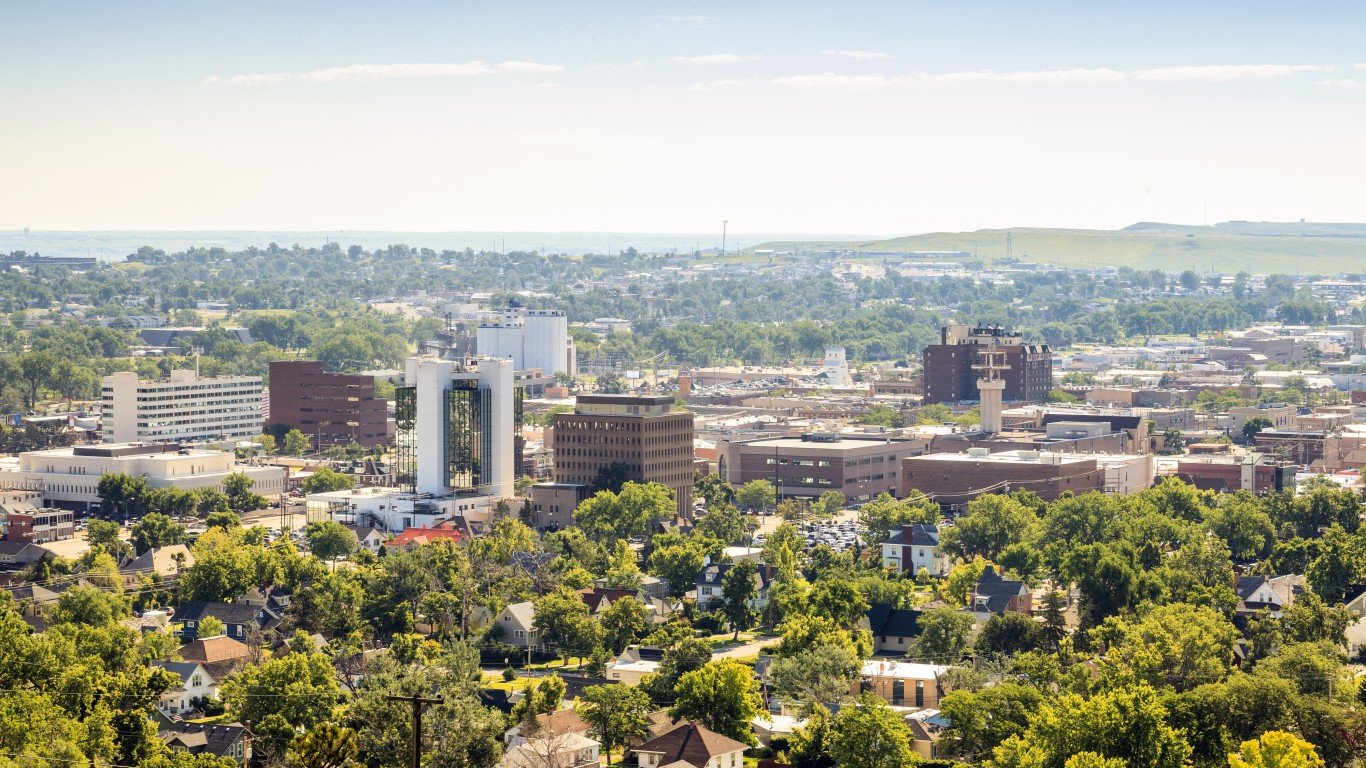
23. Rapid City, SD
> New building permits with 5+ units, 2021: 53.6% of all permits (+9.7 ppts from 2016)
> New building permits with 5+ units, 2016: 44.0% of all permits
> Median rent: $1,002 per month
> Population density, 2021: 22.6 people per square mile
> Total population, 2021: 141,190

22. Manchester-Nashua, NH
> New building permits with 5+ units, 2021: 42.4% of all permits (+9.8 ppts from 2016)
> New building permits with 5+ units, 2016: 32.6% of all permits
> Median rent: $1,393 per month
> Population density, 2021: 483.8 people per square mile
> Total population, 2021: 424,079
[in-text-ad-2]

21. Sacramento-Roseville-Folsom, CA
> New building permits with 5+ units, 2021: 23.0% of all permits (+9.9 ppts from 2016)
> New building permits with 5+ units, 2016: 13.0% of all permits
> Median rent: $1,556 per month
> Population density, 2021: 473.3 people per square mile
> Total population, 2021: 2.4 million

20. Minneapolis-St. Paul-Bloomington, MN-WI
> New building permits with 5+ units, 2021: 53.3% of all permits (+10.2 ppts from 2016)
> New building permits with 5+ units, 2016: 43.1% of all permits
> Median rent: $1,246 per month
> Population density, 2021: 523.6 people per square mile
> Total population, 2021: 3.7 million
[in-text-ad]
19. Omaha-Council Bluffs, NE-IA
> New building permits with 5+ units, 2021: 40.6% of all permits (+10.4 ppts from 2016)
> New building permits with 5+ units, 2016: 30.2% of all permits
> Median rent: $1,007 per month
> Population density, 2021: 223.7 people per square mile
> Total population, 2021: 972,195
[recirclink id=1165876]

18. Boise City, ID
> New building permits with 5+ units, 2021: 26.2% of all permits (+10.8 ppts from 2016)
> New building permits with 5+ units, 2016: 15.5% of all permits
> Median rent: $1,222 per month
> Population density, 2021: 68.1 people per square mile
> Total population, 2021: 801,470

17. Boston-Cambridge-Newton, MA-NH
> New building permits with 5+ units, 2021: 65.7% of all permits (+11.6 ppts from 2016)
> New building permits with 5+ units, 2016: 54.1% of all permits
> Median rent: $1,718 per month
> Population density, 2021: 1,405.6 people per square mile
> Total population, 2021: 4.9 million
[in-text-ad-2]
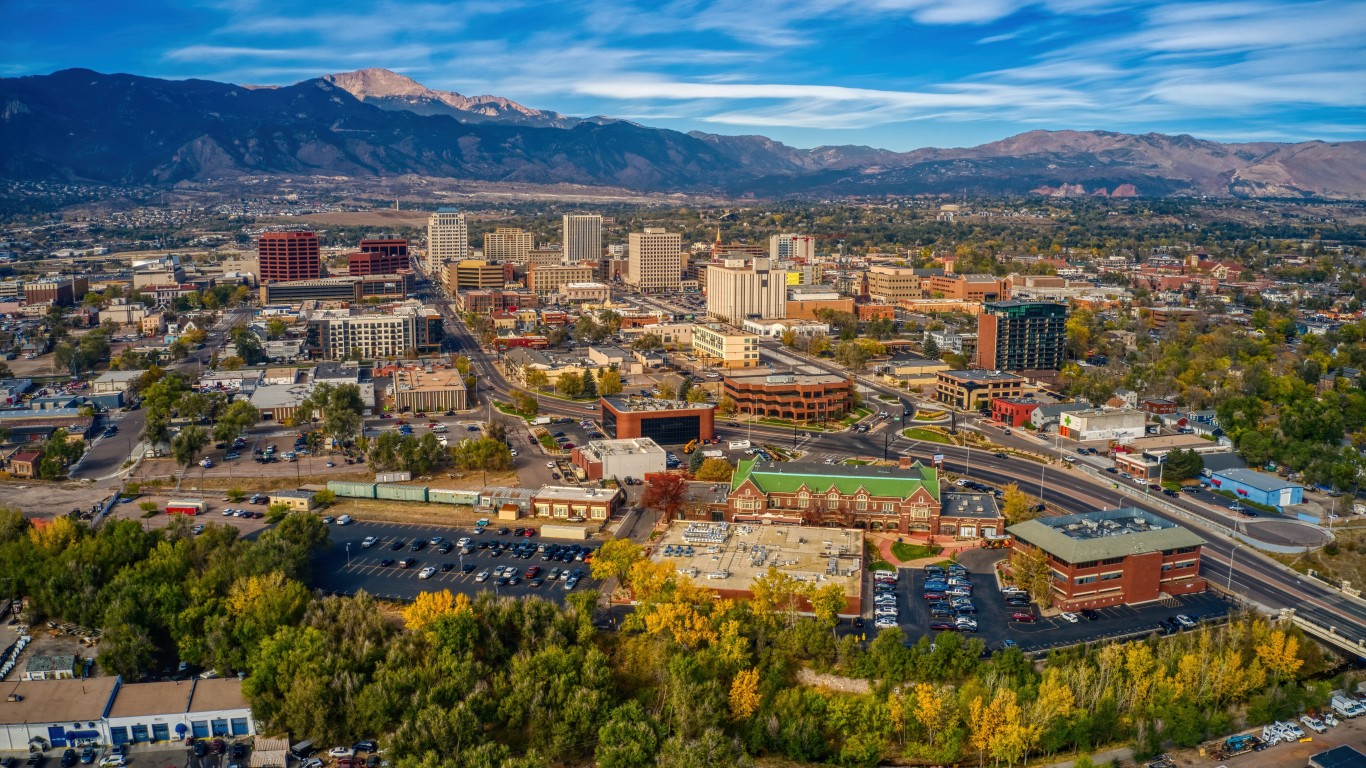
16. Colorado Springs, CO
> New building permits with 5+ units, 2021: 42.0% of all permits (+12.1 ppts from 2016)
> New building permits with 5+ units, 2016: 30.0% of all permits
> Median rent: $1,465 per month
> Population density, 2021: 284.2 people per square mile
> Total population, 2021: 762,792

15. Austin-Round Rock-Georgetown, TX
> New building permits with 5+ units, 2021: 50.4% of all permits (+12.4 ppts from 2016)
> New building permits with 5+ units, 2016: 37.9% of all permits
> Median rent: $1,427 per month
> Population density, 2021: 557.5 people per square mile
> Total population, 2021: 2.4 million
[in-text-ad]
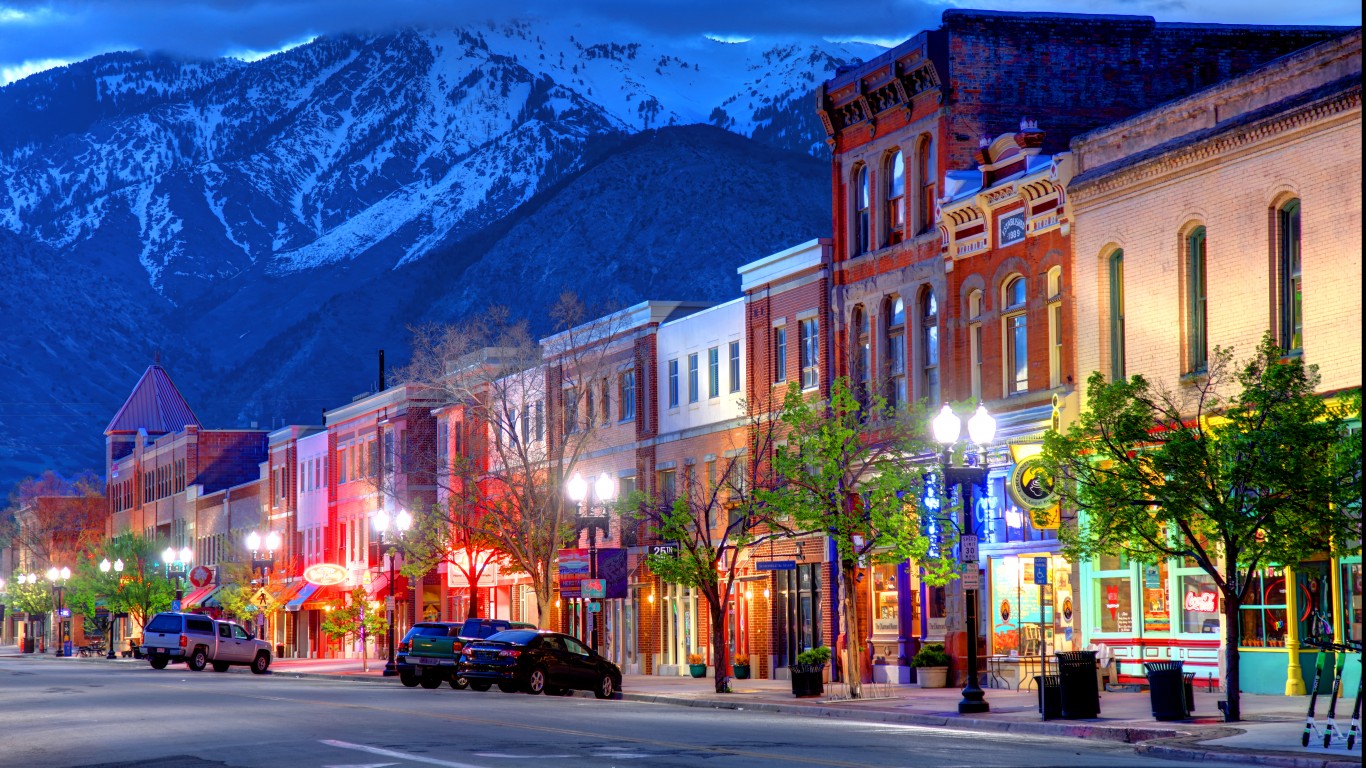
14. Ogden-Clearfield, UT
> New building permits with 5+ units, 2021: 41.8% of all permits (+12.5 ppts from 2016)
> New building permits with 5+ units, 2016: 29.3% of all permits
> Median rent: $1,123 per month
> Population density, 2021: 98.0 people per square mile
> Total population, 2021: 708,543
[recirclink id=1129695]
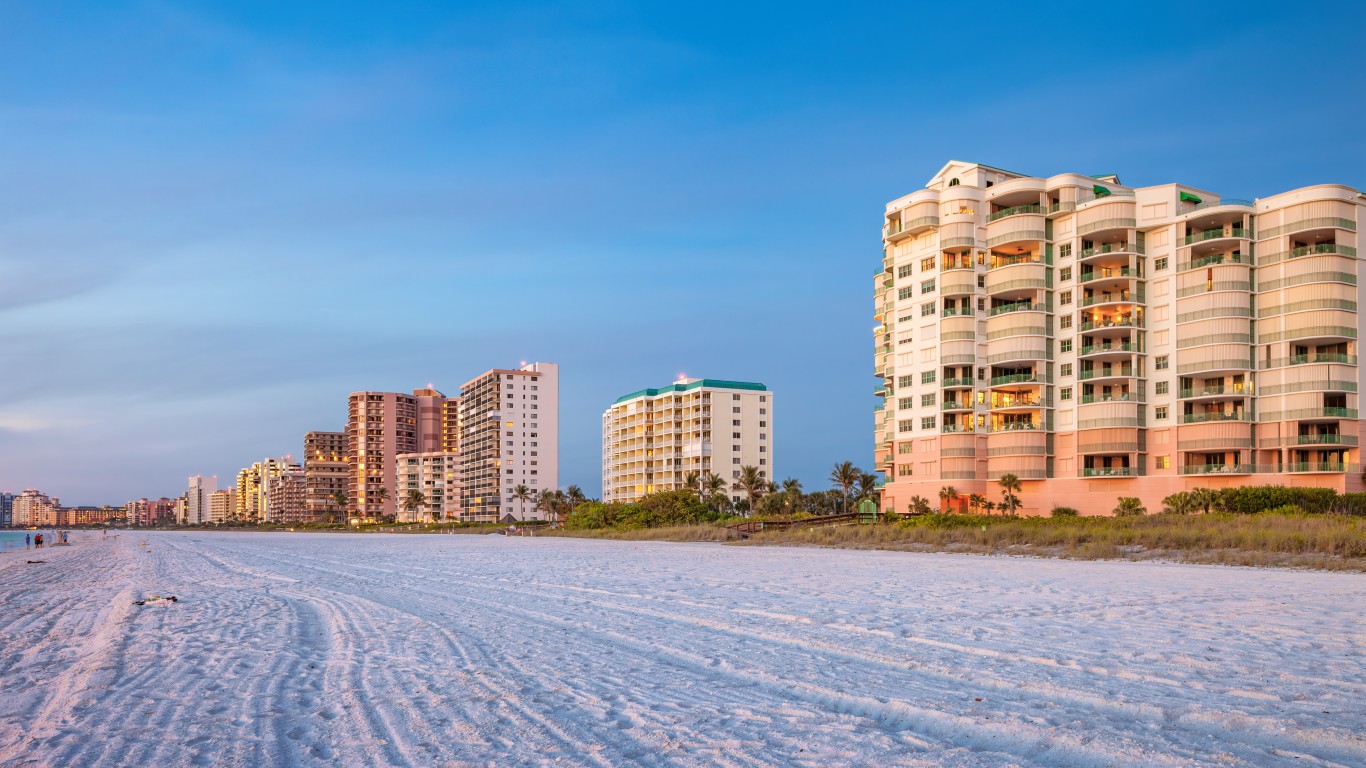
13. Naples-Marco Island, FL
> New building permits with 5+ units, 2021: 32.6% of all permits (+14.2 ppts from 2016)
> New building permits with 5+ units, 2016: 18.4% of all permits
> Median rent: $1,503 per month
> Population density, 2021: 193.3 people per square mile
> Total population, 2021: 385,980

12. Olympia-Lacey-Tumwater, WA
> New building permits with 5+ units, 2021: 59.4% of all permits (+14.4 ppts from 2016)
> New building permits with 5+ units, 2016: 45.0% of all permits
> Median rent: $1,474 per month
> Population density, 2021: 412.4 people per square mile
> Total population, 2021: 297,977
[in-text-ad-2]
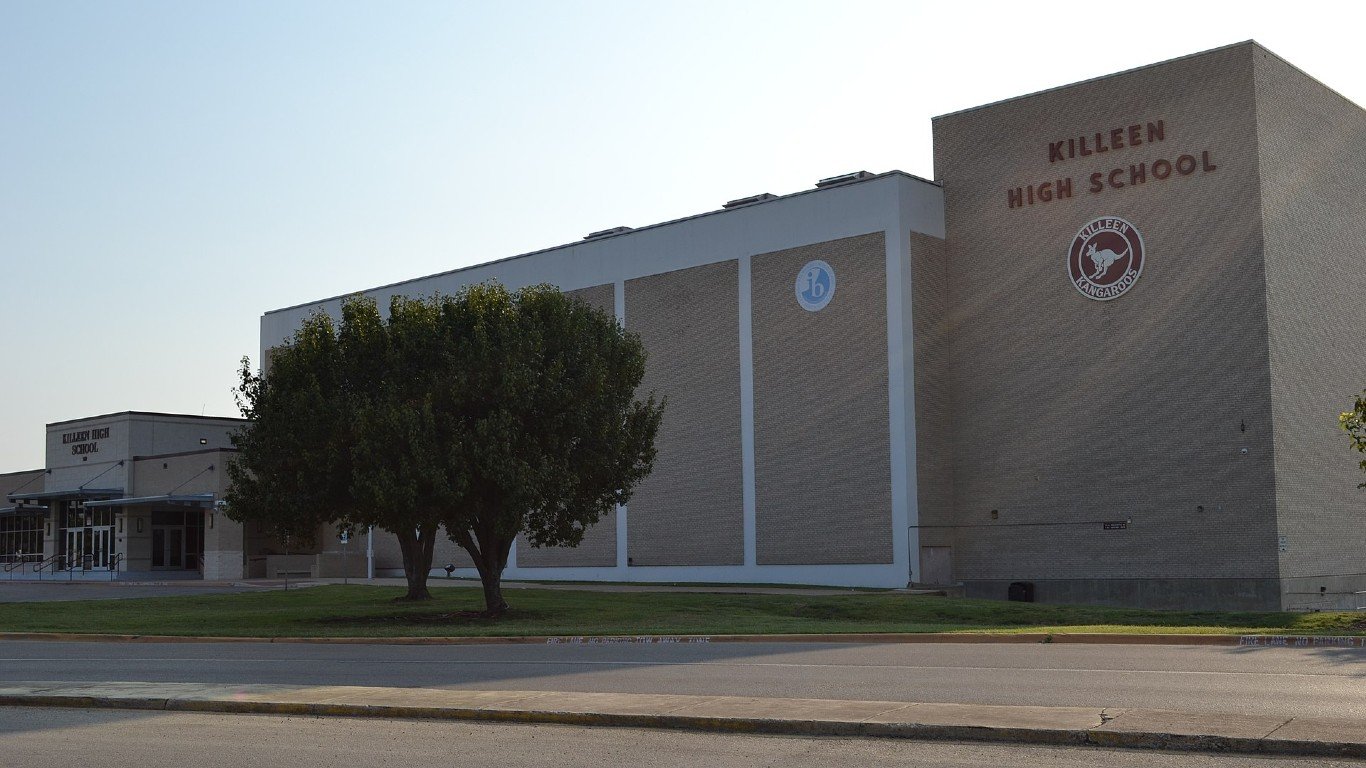
11. Killeen-Temple, TX
> New building permits with 5+ units, 2021: 27.1% of all permits (+14.7 ppts from 2016)
> New building permits with 5+ units, 2016: 12.5% of all permits
> Median rent: $1,009 per month
> Population density, 2021: 172.6 people per square mile
> Total population, 2021: 486,416
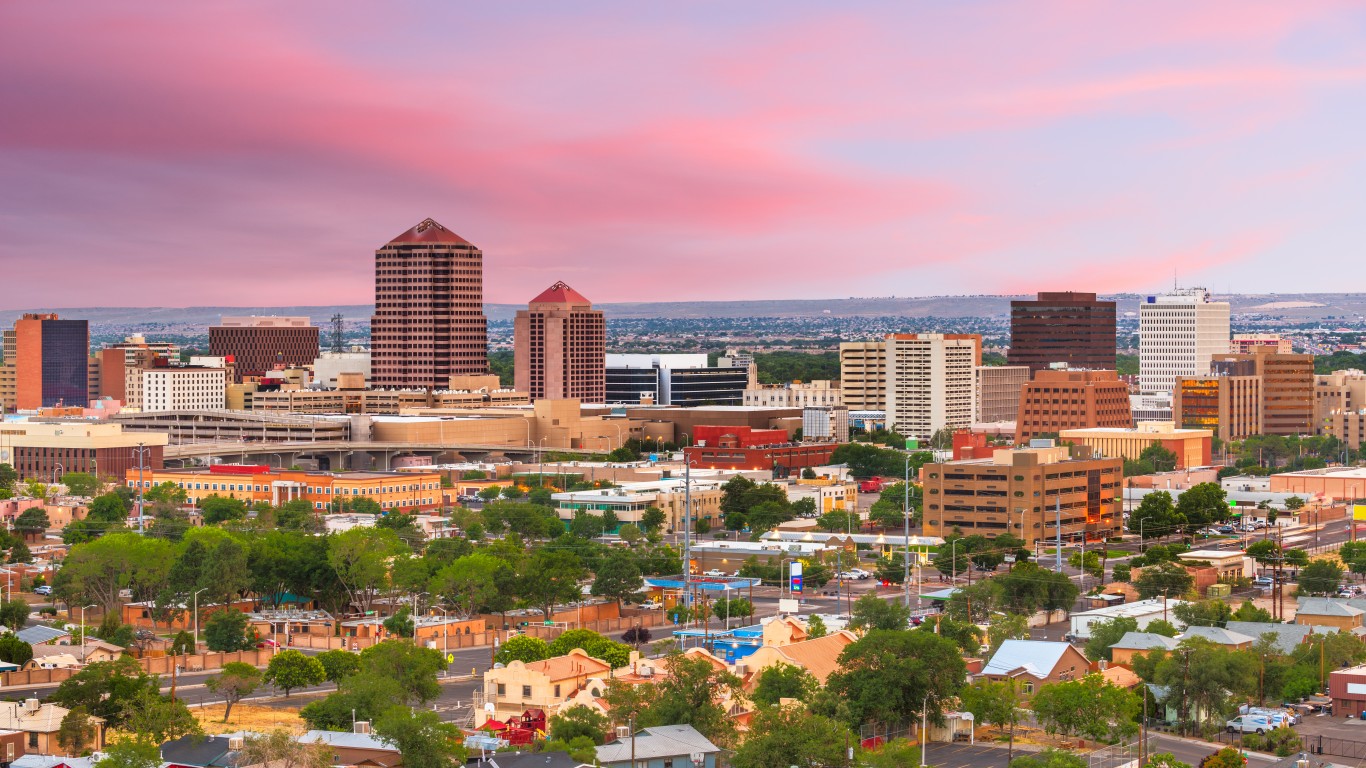
10. Albuquerque, NM
> New building permits with 5+ units, 2021: 35.1% of all permits (+14.8 ppts from 2016)
> New building permits with 5+ units, 2016: 20.3% of all permits
> Median rent: $961 per month
> Population density, 2021: 99.2 people per square mile
> Total population, 2021: 921,311
[in-text-ad]

9. Provo-Orem, UT
> New building permits with 5+ units, 2021: 29.2% of all permits (+15.0 ppts from 2016)
> New building permits with 5+ units, 2016: 14.2% of all permits
> Median rent: $1,253 per month
> Population density, 2021: 129.1 people per square mile
> Total population, 2021: 696,699
[recirclink id=1163587]
8. Bend, OR
> New building permits with 5+ units, 2021: 31.4% of all permits (+15.6 ppts from 2016)
> New building permits with 5+ units, 2016: 15.7% of all permits
> Median rent: $1,569 per month
> Population density, 2021: 67.9 people per square mile
> Total population, 2021: 204,801
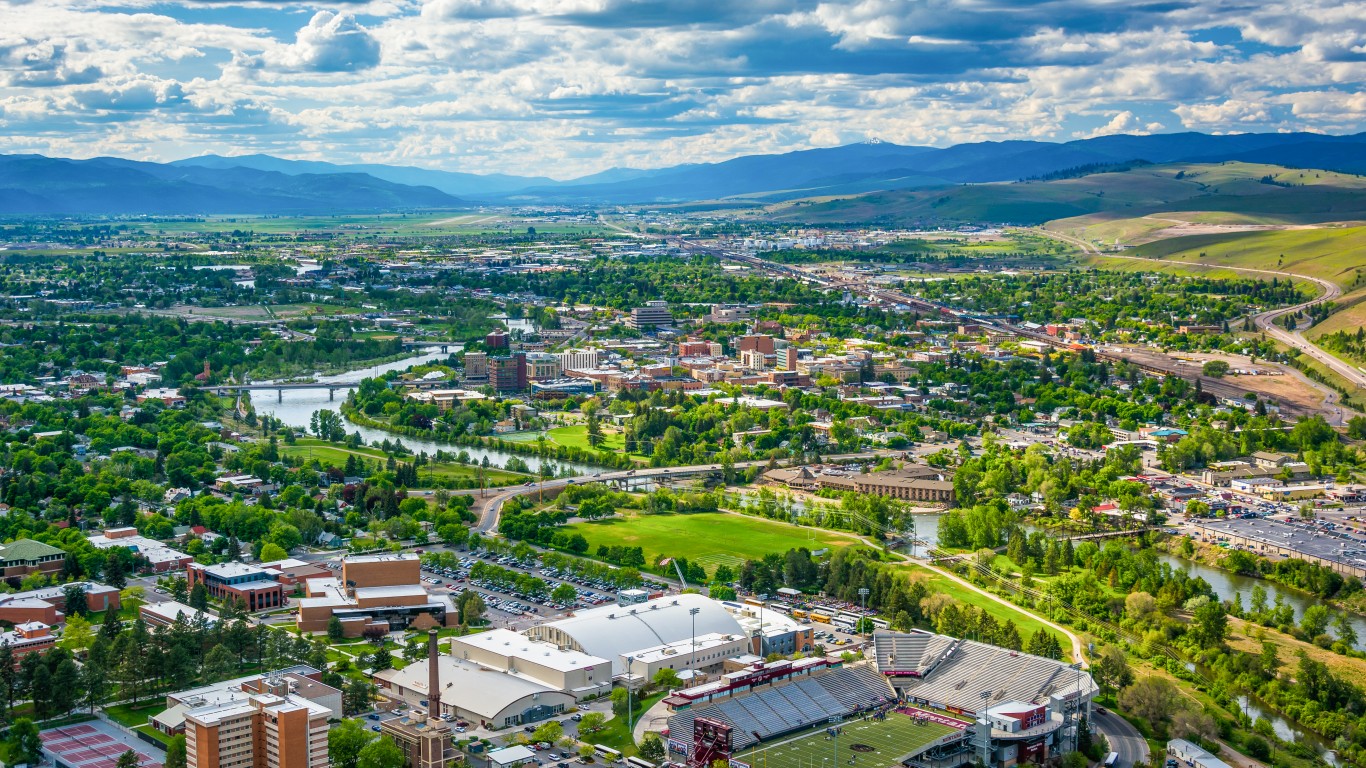
7. Missoula, MT
> New building permits with 5+ units, 2021: 73.2% of all permits (+16.2 ppts from 2016)
> New building permits with 5+ units, 2016: 57.0% of all permits
> Median rent: $1,034 per month
> Population density, 2021: 46.1 people per square mile
> Total population, 2021: 119,533
[in-text-ad-2]

6. Richmond, VA
> New building permits with 5+ units, 2021: 33.0% of all permits (+17.2 ppts from 2016)
> New building permits with 5+ units, 2016: 15.8% of all permits
> Median rent: $1,202 per month
> Population density, 2021: 301.9 people per square mile
> Total population, 2021: 1.3 million
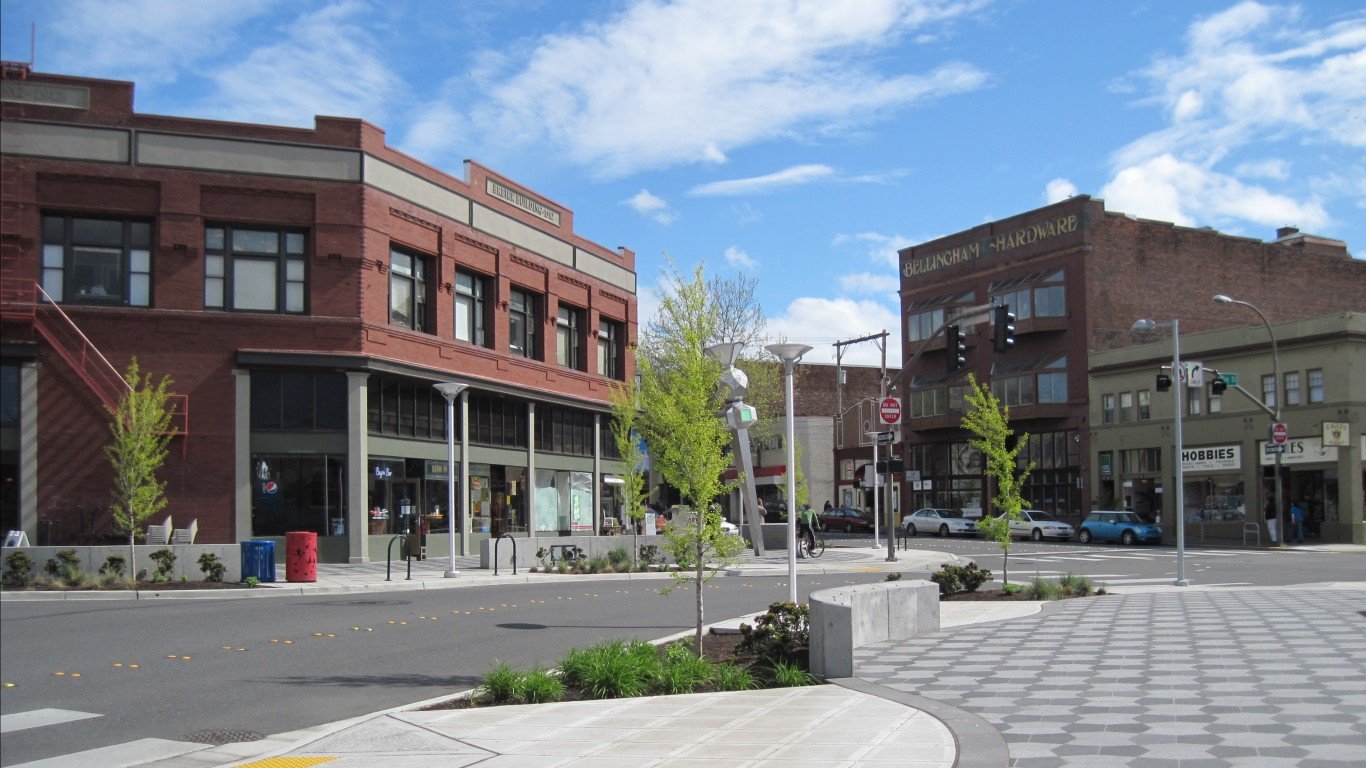
5. Bellingham, WA
> New building permits with 5+ units, 2021: 49.2% of all permits (+18.1 ppts from 2016)
> New building permits with 5+ units, 2016: 31.1% of all permits
> Median rent: $1,347 per month
> Population density, 2021: 108.6 people per square mile
> Total population, 2021: 228,831
[in-text-ad]

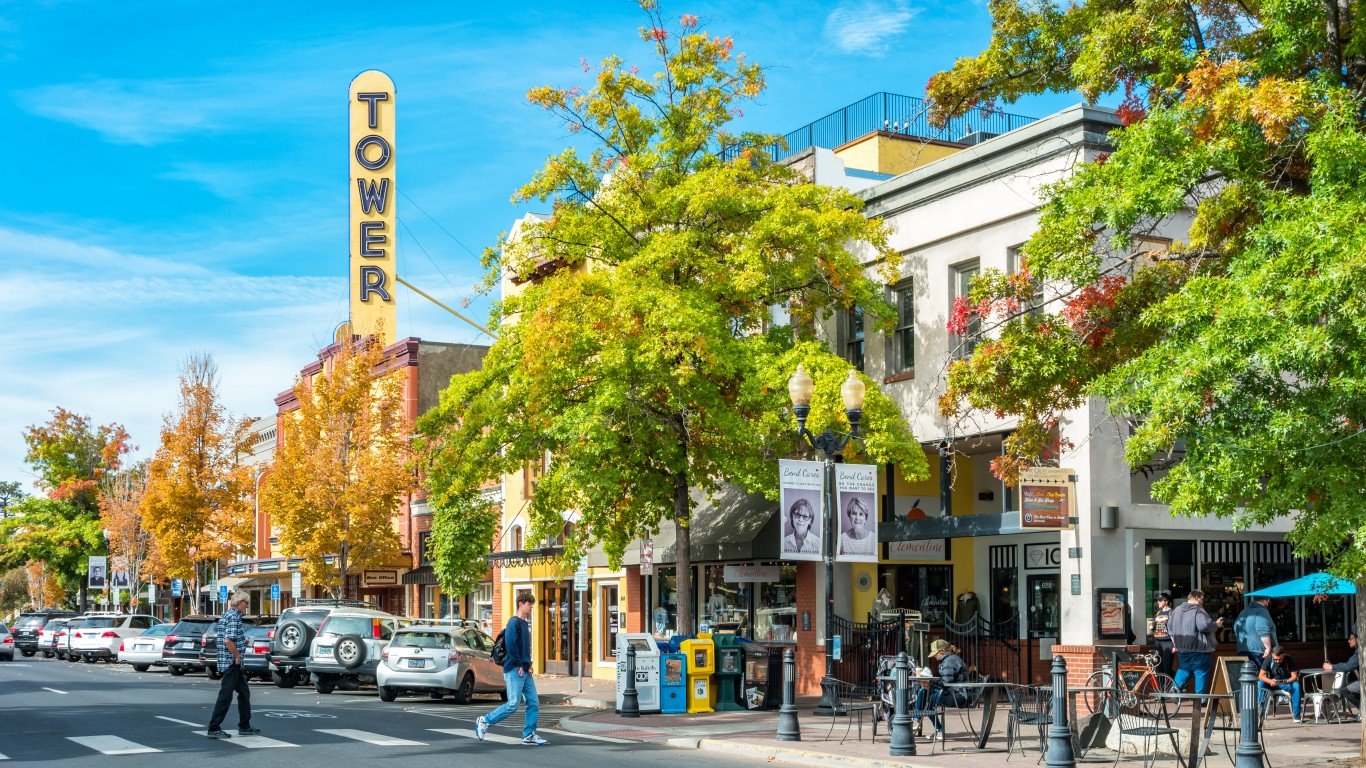
4. Eugene-Springfield, OR
> New building permits with 5+ units, 2021: 54.1% of all permits (+18.7 ppts from 2016)
> New building permits with 5+ units, 2016: 35.4% of all permits
> Median rent: $1,131 per month
> Population density, 2021: 84.1 people per square mile
> Total population, 2021: 383,189
[recirclink id=1159308]

3. Worcester, MA-CT
> New building permits with 5+ units, 2021: 37.0% of all permits (+21.1 ppts from 2016)
> New building permits with 5+ units, 2016: 15.9% of all permits
> Median rent: $1,168 per month
> Population density, 2021: 483.5 people per square mile
> Total population, 2021: 978,447
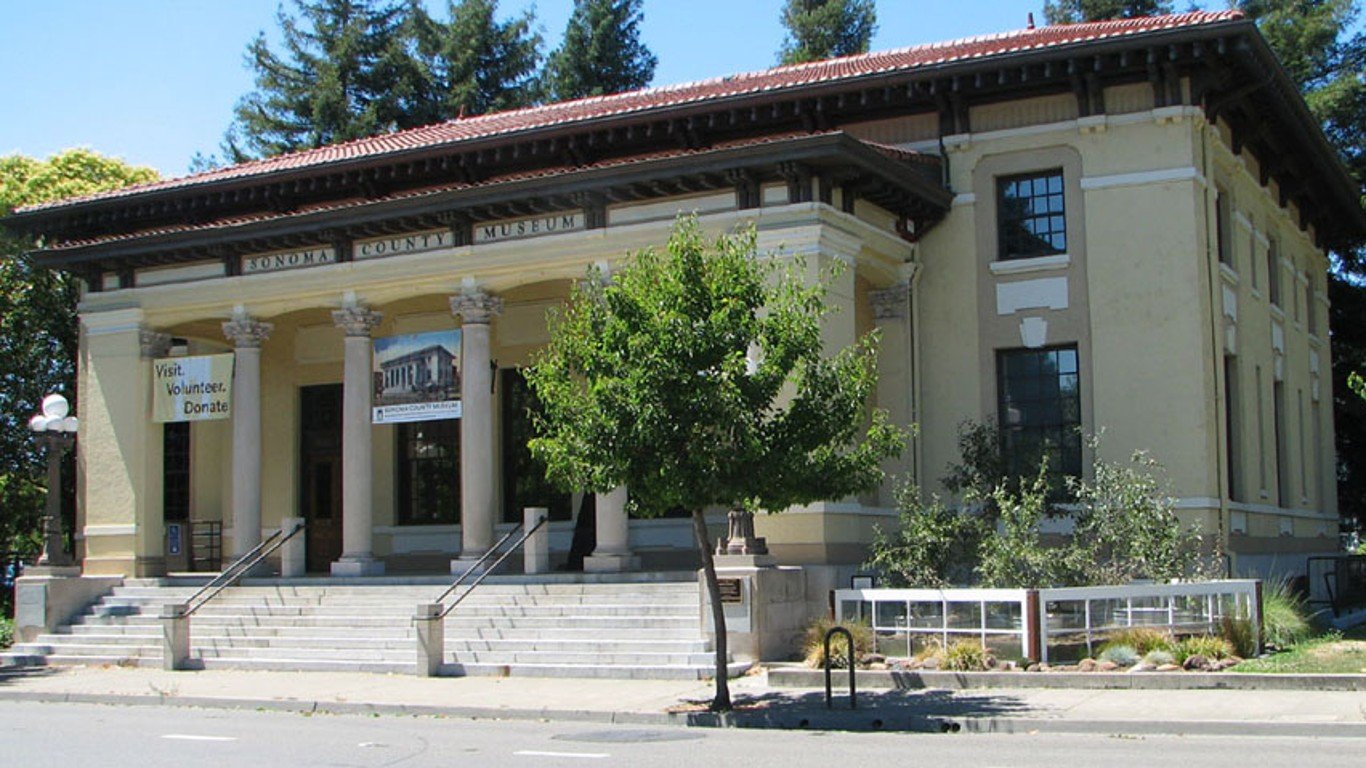
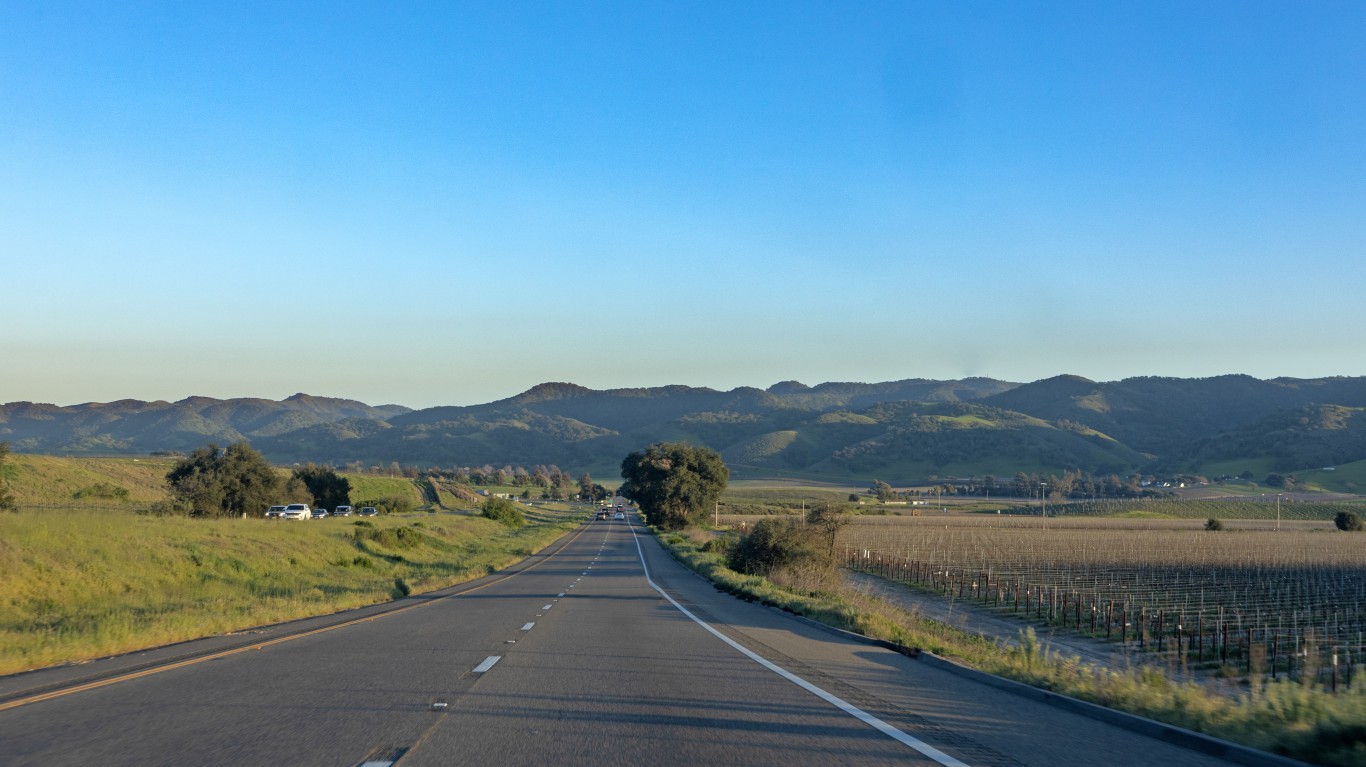
2. Santa Rosa-Petaluma, CA
> New building permits with 5+ units, 2021: 51.5% of all permits (+23.9 ppts from 2016)
> New building permits with 5+ units, 2016: 27.6% of all permits
> Median rent: $1,900 per month
> Population density, 2021: 308.4 people per square mile
> Total population, 2021: 485,887
[in-text-ad-2]

1. Philadelphia-Camden-Wilmington, PA-NJ-DE-MD
> New building permits with 5+ units, 2021: 70.0% of all permits (+33.6 ppts from 2016)
> New building permits with 5+ units, 2016: 36.4% of all permits
> Median rent: $1,258 per month
> Population density, 2021: 1,353.1 people per square mile
> Total population, 2021: 6.2 million
Methodology
To determine the cities that are building the most high-density housing, 24/7 Wall St. reviewed data from the U.S. Census Bureau’s monthly Build Permits Survey, using annual data from 2021 and 2016. Cities were ranked based on the percentage-point change in the number of new construction permits for buildings with five units or more as a share of all buildings from 2016 to 2021.
Supplemental data on new building permits for all buildings also came from the U.S. Census Bureau. Data on population and median monthly rent are from the 2021 American Community Survey and are one-year estimates. Data on land area used to calculate population density came from the U.S. Census Bureau and are current as of 2021.
Contact [email protected] for any questions or corrections.