The housing market has been red hot during the pandemic, with home prices hitting record highs up until a few months ago. More recently, surging mortgage rates have put some pressure on the housing market, slowing the climb in housing prices. That could be good news for buyers, though home prices remain considerably higher than they were in 2019 after surging in the two years since.
Nationwide, the average median home value rose 17% between 2019 and 2021, according to data from the 2021 and 2019 American Community Surveys from the U.S. Census Bureau. During that time, median household incomes grew a far smaller 6%. That gap has made homes, especially in some areas, more unaffordable.
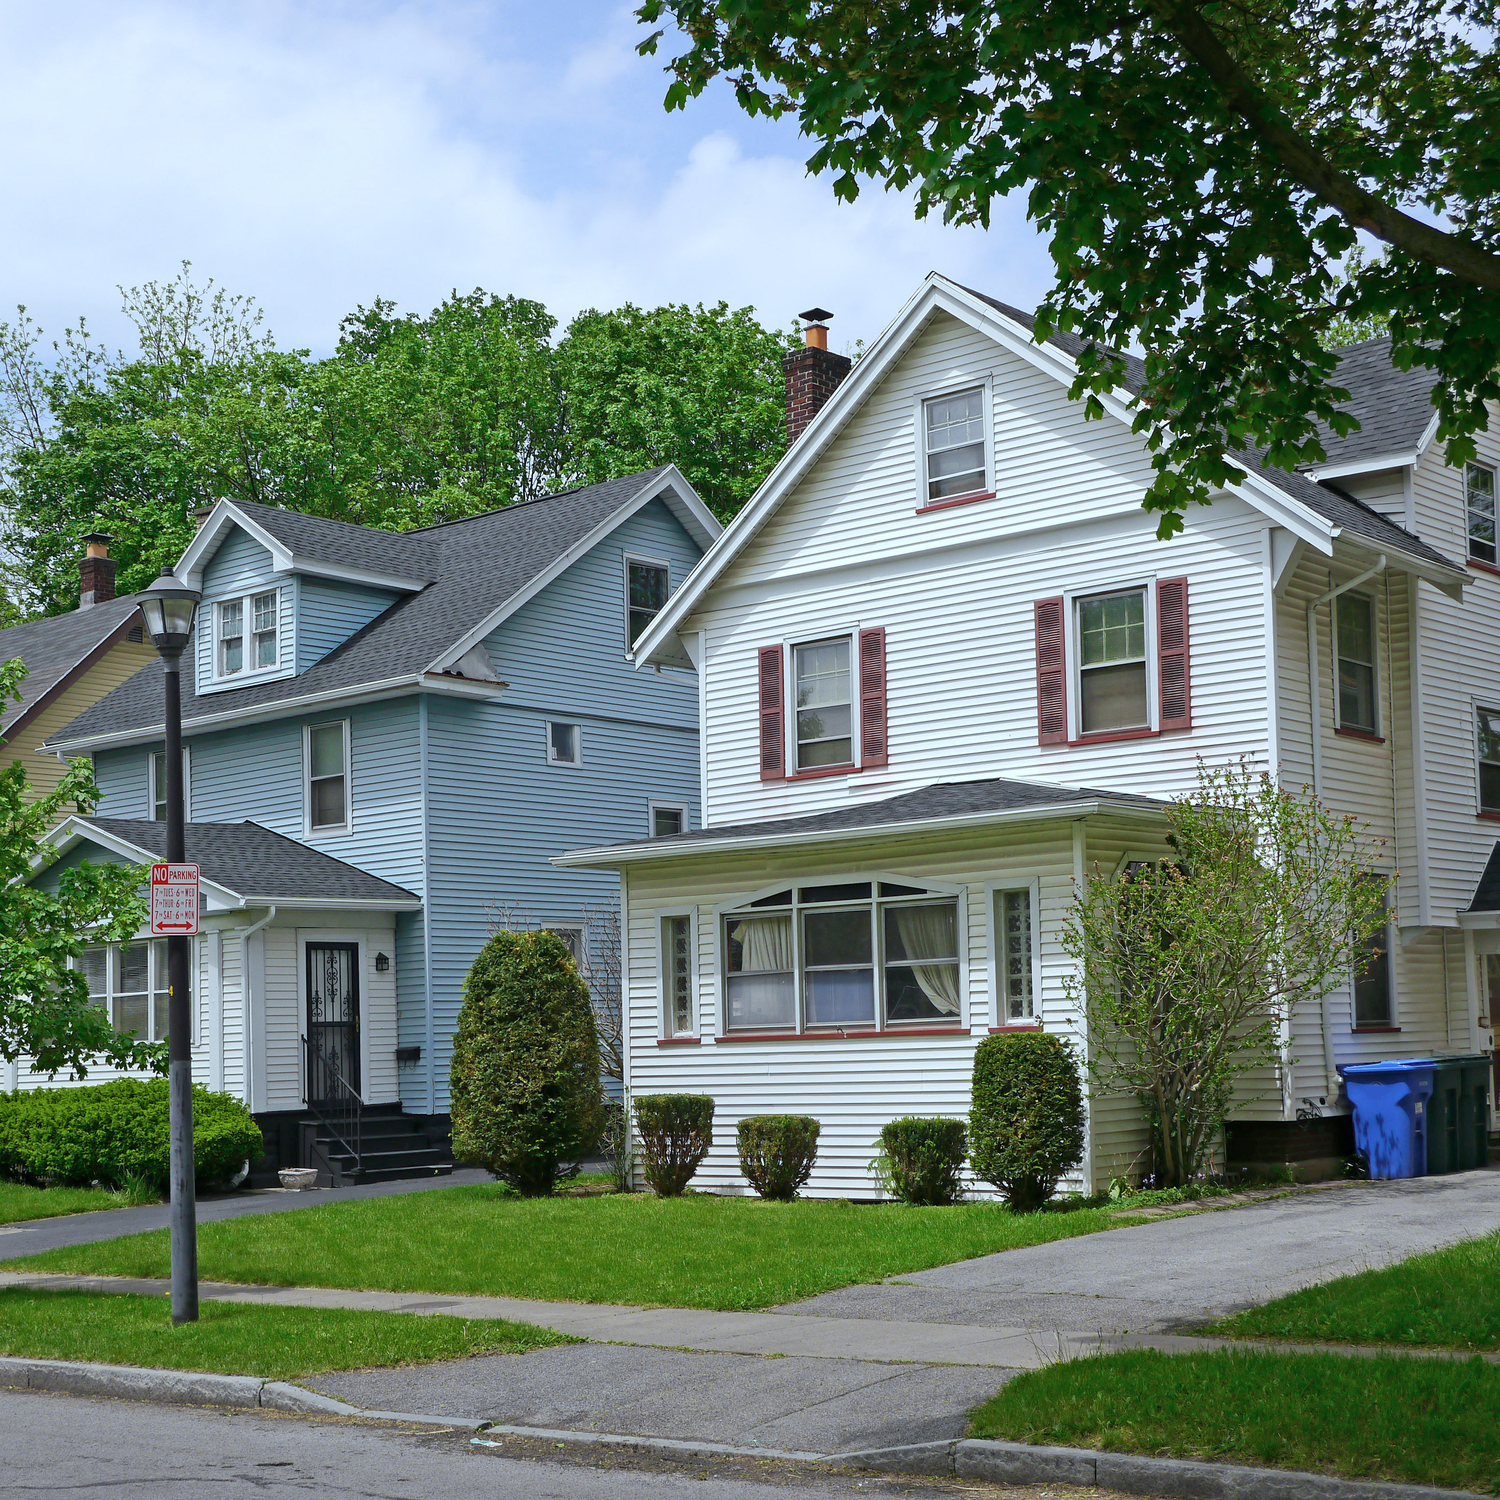
Rhode Island is one of the 23 states where home values rose faster than average during the COVID-19 pandemic. The typical home in the state was worth $348,100 in 2021, compared to $283,000 in 2019. The 23.0% increase ranks as the eighth highest among states.
As was the case nationwide, home value growth outpaced income growth in Rhode Island. The typical household in the state earned $74,008 in 2021, up just 4.0% from $71,169 in 2019.
Population growth can fuel housing demand and push prices up – and over the same period, Rhode Island’s population grew by 3.4%.
All data on income, population, and home value are one-year estimates from the U.S. Census Bureau’s American Community Survey from 2019 and 2021.
| Rank | State | Increase in home value, 2019-2021 (%) | Median home value in 2021 ($) | Median home value in 2019 ($) | Increase in median household income, 2019-2021 (%) | Increase in population, 2019-2021 (%) |
|---|---|---|---|---|---|---|
| 1 | Idaho | 44.7 | 369,300 | 255,200 | 9.0 | 6.4 |
| 2 | Arizona | 31.4 | 336,300 | 255,900 | 11.3 | 0.0 |
| 3 | Utah | 27.7 | 421,700 | 330,300 | 4.8 | 4.1 |
| 4 | Montana | 27.3 | 322,800 | 253,600 | 10.7 | 3.3 |
| 5 | Maine | 25.7 | 252,100 | 200,500 | 9.9 | 2.1 |
| 6 | Washington | 25.3 | 485,700 | 387,600 | 7.1 | 1.6 |
| 7 | Georgia | 23.3 | 249,700 | 202,500 | 7.4 | 1.7 |
| 8 | Rhode Island | 23.0 | 348,100 | 283,000 | 4.0 | 3.4 |
| 9 | New Hampshire | 22.7 | 345,200 | 281,400 | 13.5 | 2.2 |
| 10 | North Carolina | 22.6 | 236,900 | 193,200 | 8.1 | 0.6 |
| 11 | Tennessee | 22.6 | 235,200 | 191,900 | 6.5 | 2.1 |
| 12 | Oregon | 19.2 | 422,700 | 354,600 | 6.7 | 0.7 |
| 13 | Arkansas | 19.2 | 162,300 | 136,200 | 7.3 | 0.3 |
| 14 | South Dakota | 18.9 | 219,900 | 185,000 | 11.1 | 1.2 |
| 15 | South Carolina | 18.7 | 213,500 | 179,800 | 5.5 | 0.8 |
| 16 | Nebraska | 18.6 | 204,900 | 172,700 | 5.7 | 1.5 |
| 17 | Florida | 18.6 | 290,700 | 245,100 | 6.5 | 1.4 |
| 18 | Texas | 18.5 | 237,400 | 200,400 | 4.6 | 1.8 |
| 19 | New Mexico | 18.3 | 214,000 | 180,900 | 3.9 | 0.9 |
| 20 | Colorado | 18.1 | 466,200 | 394,600 | 6.6 | 0.9 |
| 21 | Missouri | 18.0 | 198,300 | 168,000 | 7.7 | 0.5 |
| 22 | Michigan | 17.4 | 199,100 | 169,600 | 6.6 | 0.6 |
| 23 | Nevada | 17.4 | 373,000 | 317,800 | 4.7 | 2.1 |