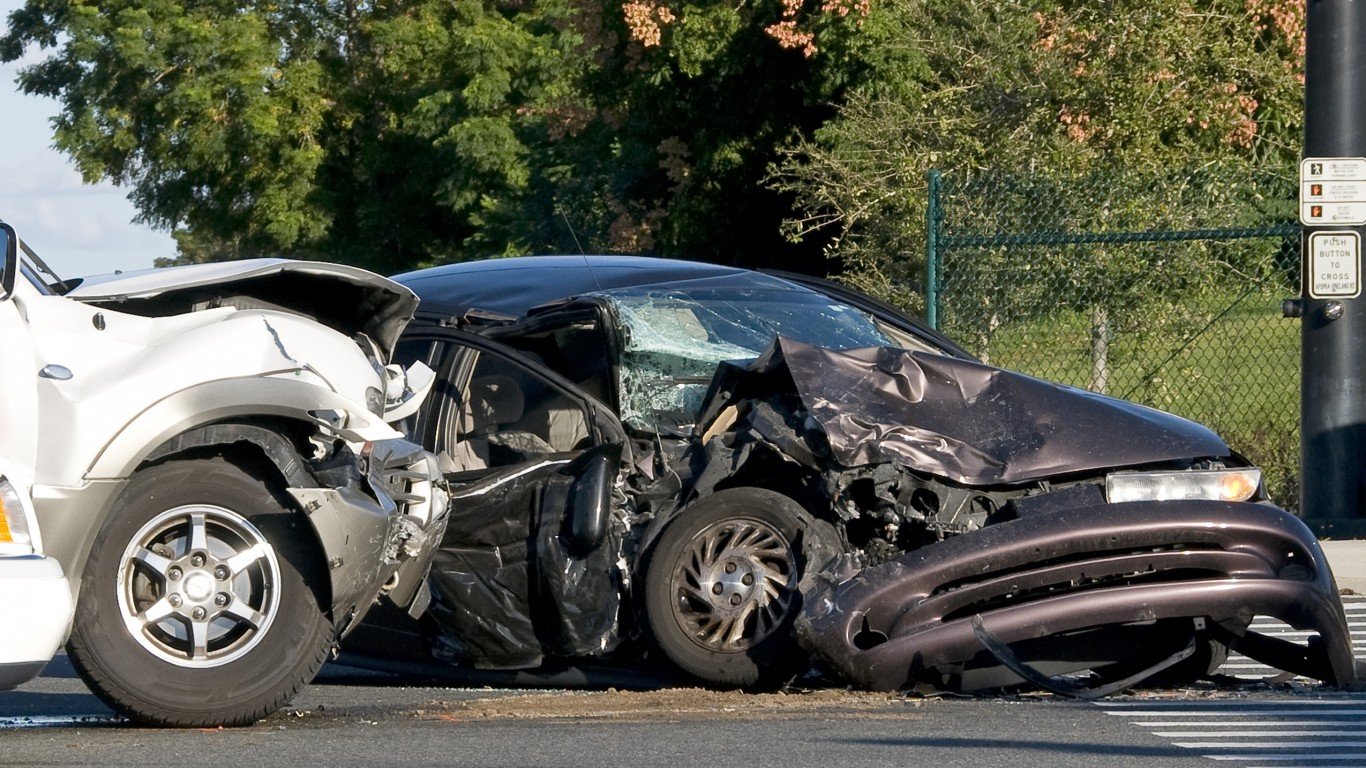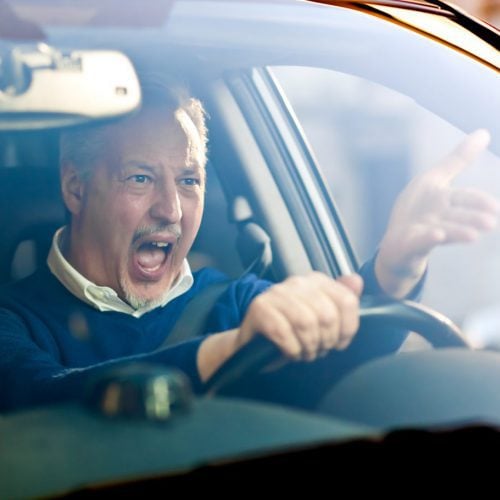
Speeding. Hard braking. Rapid acceleration. These are the hallmarks of aggressive driving, and the number of people who exhibit this kind of behavior varies sharply from city to city. However, one large city tops the most aggressive driving list, with over one out of five drivers identified as aggressive.
GasBuddy looked at driving habits in America’s 30 largest cities. Los Angeles was at the top of the list, with 22% of the drivers exhibiting aggressive behavior compared to the average American driver. Four of the top six cities were in California. State capital Sacramento was third, with a count of 21.5%. San Francisco was fifth with a rate of 19.0%, followed by San Diego at 17.6%. Each of these cities is among the 20 worst cities to drive in based on commute time, fatalities and cost of commutes.
Among the other cities at the top of the list, Philadelphia ranked second with a rate of aggressive drivers of 21.8%. Atlanta was in fourth place with a rate of 20.2%.
And aggressive driving can drive up the cost of commuting. GasBuddy researchers report, “Los Angeles consistently tops the list of having some of the most expensive gas prices in the nation, currently averaging $3.35 per gallon. Combined with traffic and congestion, the GasBuddy Aggressive Driving study reveals that the way Los Angeles motorists are driving is also contributing to a larger gasoline budget.” Aggressive driving in general nationwide is expensive. The cost of these three behaviors adds as much as $477 in fuel consumption per year.
[nativounit]
A look at the three causes of aggressive driving also shows variation from city to city. Philadelphia has the highest percentage of people who “brake hard” at 21% above the average among drivers nationwide. San Diego tops of the list for “speeding incidents” compared to average drivers, an extraordinary 62% higher. Los Angeles tops the list of “rapid acceleration incidents” at 26.5% above the national average, a tiny fraction ahead of Philadelphia.
How did GasBuddy collect that data? It used the Drives Feature in its app. It broke out the data into the aggressive driving habits in the top 30 metropolitan areas by population based on the Census definition. The period of the study was from November 2018 February 2019. The app captured the frequency of an aggressive event while driving, whether it be speeding, hard braking or accelerating.
[recirclink id=533624]
| Rank | Metro | Vs. Avg. |
|---|---|---|
| 1 | Los Angeles | 21.98% |
| 2 | Philadelphia | 21.83% |
| 3 | Sacramento | 21.53% |
| 4 | Atlanta | 20.26% |
| 5 | San Francisco | 19.02% |
| 6 | San Diego | 17.57% |
| 7 | Orlando | 9.33% |
| 8 | Detroit | 7.81% |
| 9 | Austin | 6.53% |
| 10 | Las Vegas | 6.44% |
| 11 | Charlotte | 6.17% |
| 12 | Pittsburgh | 5.30% |
| 13 | Phoenix | 4.82% |
| 14 | Boston | 4.34% |
| 15 | Dallas-Fort Worth | 4.07% |
| 16 | Chicago | 3.14% |
| 17 | Miami-Fort Lauderdale | 2.54% |
| 18 | Baltimore | 2.42% |
| 19 | Tampa-St. Petersburg | 2.08% |
| 20 | Washington D.C. | −0.15% |
| 21 | San Antonio | −1.24% |
| 22 | Houston | −1.37% |
| 23 | New York | −1.94% |
| 24 | Kansas City | −2.33% |
| 25 | St. Louis | −3.00% |
| 26 | Denver | −3.16% |
| 27 | Portland, OR | −4.44% |
| 28 | Cincinnati | −6.13% |
| 29 | Seattle | −10.23% |
| 30 | Minneapolis-St. Paul | −12.59% |
[wallst_email_signup]
Contact [email protected] for any questions or corrections.