Special Report
American Cities Losing the Most Jobs This Year

Published:
Last Updated:
The U.S. economy added roughly 2.4 million workers over the past year. Over the same period, the unemployment rate fell from 5.0% to 4.9%, close to the lowest it has been in nearly a decade. The 1.7% employment growth nationwide was not uniform, and some areas lost a substantial share of workers.
To determine the cities that lost the most jobs, 24/7 Wall St. analyzed employment data from the Bureau of Labor Statistics. Most cities added jobs in past 12 months, and most have posted unemployment declines. In 75 metro areas, however, there was a net loss in total employment. The Lafayette, Louisiana metro area had the greatest loss workers, with total employment falling by 4.5% since October 2015.
[in-text-ad]
One major factor driving employment changes across the United States is industrial composition. Continued outsourcing and automation has lowered international demand for American manufacturing, and the downturn in the price of petroleum has hurt the oil and gas sector. Nationwide, the worst performing sectors were manufacturing, information, and mining, logging, and construction.
Click here to see the American cities losing the most jobs this year.
Cities with economies that heavily depend on these industries tended to have the most job loss. In an interview with 24/7 Wall St., Martin Kohli, chief regional economist at the BLS, explained that a “large concentration of employment in energy and construction-related industries has definitely been negative in the last few years for communities.” In many cases, a major round of layoffs or plant shutdowns contributed to employment declines in the past year.
People are not likely to move to a city without a job or some other opportunity available. As a result, the distribution of employment growth across the country mirrors today’s domestic migration patterns. Kohli added that residents of the Northeast and Midwest, where a majority of the metro areas are losing workers, have been relocating to major cities in the Sun Belt, which is gaining the most workers.
Employment tends to increase as unemployment declines. In metropolitan areas losing the most workers, employment declines contributed to labor force declines and a rise in unemployment. In Oklahoma City, Oklahoma, for example, the 14,200 workers lost in Oklahoma City was among the most of any metro area. At the same time, the labor force shrank by a total of 9,000 workers, while area unemployment rate rose from 3.6% to 4.4%.
To identify the cities losing the most workers, 24/7 Wall St. reviewed metropolitan statistical areas with the largest employment decline from October 2015 through October 2016. Unemployment rates, the size of the labor force, and employment levels are from the Bureau of Labor Statistics (BLS) and are seasonally adjusted. Industry-specific growth rates for the same period are from the Current Employment Survey (CES), a monthly BLS survey. Educational attainment is from the 2015 American Community Survey (ACS) of the U.S. Census Bureau.
These are the cities losing the most jobs.

25. Lynchburg, VA
> Employment change: -1.41%
> No. of jobs Oct. 2015: 116,888
> No. of jobs Oct. 2016: 115,240
> Unemployment rate Oct. 2016: 4.9%
The Lynchburg metro area lost a net total of more than 1,600 jobs in the past year. While U.S. total employment increased by 1.7%, Lynchburg employment fell by 1.4%. Similarly, while the number of education and health professionals declined by 3.3% in Lynchburg, employment in the education and health sector grew more than nearly any other industry nationwide. In February 2016, insurance company Genworth Financial announced it would lay off 200 workers in Lynchburg.
[in-text-ad]

24. Bloomington, IL
> Employment change: -1.41%
> No. of jobs Oct. 2015: 93,826
> No. of jobs Oct. 2016: 92,502
> Unemployment rate Oct. 2016: 5.1%
The Bloomington metro area lost a net total of roughly 1,300 workers in 2016. While the area’s college attainment rate of 44% is among the highest in the country, the talented workforce did not attract jobs in the metropolitan area. The largest employment decline occurred in the manufacturing industry, which shed 1,200 workers over the past year. This was likely driven by the closing of the Mitsubishi Motors manufacturing plant in the metro area earlier in 2016, which led to the loss of roughly 1,000 workers.

23. Elmira, NY
> Employment change: -1.45%
> No. of jobs Oct. 2015: 35,529
> No. of jobs Oct. 2016: 35,014
> Unemployment rate Oct. 2016: 5.9%
There are roughly 500 fewer workers in the Elmira metro area today than there were one year ago. While the number of U.S. workers grew by 1.7% over the past year, the Elmira workforce contracted by 1.4% over the same period. Elmira is one of many cities undergoing rapid employment decline in New York’s Southern Tier region. The Southern Tier includes the neighboring Binghamton metropolitan area, where employment declined 2.0% over the past year. In both Binghamton and Elmira, manufacturing was among the sectors contributing to the largest workers losses.

22. Joplin, MO
> Employment change: -1.54%
> No. of jobs Oct. 2015: 84,395
> No. of jobs Oct. 2016: 83,093
> Unemployment rate Oct. 2016: 4.5%
The number of jobs in Joplin fell by 1.5% in the past year, while nationwide employment increased by 1.7%. In October 2015, more than one in four Joplin employees worked in the trade, transportation, and utilities sector, nearly the highest proportion of any metro area. Over the past year, however, Joplin’s largest sector shed a net total of 700 workers, contributing heavily to the area’s total employment decline. In addition to major losses in the trade, transportation, and utilities sector, battery parts manufacturer Eagle Picher laid off 225 Joplin workers in the past year. Despite the Eagle Picher layoffs, Joplin’s manufacturing sector had net employment growth over the past year.

21. Vineland-Bridgeton, NJ
> Employment change: -1.57%
> No. of jobs Oct. 2015: 61,685
> No. of jobs Oct. 2016: 60,718
> Unemployment rate Oct. 2016: 7.9%
The Vineland-Bridgeton metro area lost a net total of 967 workers in the 12 months ending October 2016. While employment in Vineland-Bridgeton fell by 1.6%, the total number of U.S. jobs nationwide increased by 1.7%. Cities with an educated workforce are more likely to attract cutting-edge businesses and have fewer obstacles to job growth. In Vineland-Bridgeton, however, just 13.5% of adults have at least a bachelor’s degree, less than half the 30.6% national college attainment rate. Vineland’s relatively small professional and business services sector, which includes many of the industries most likely to benefit from an educated labor force, lost more workers proportional to its size in the past year than any other sector in the metro area.

20. Duluth, MN-WI
> Employment change: -1.67%
> No. of jobs Oct. 2015: 133,885
> No. of jobs Oct. 2016: 131,650
> Unemployment rate Oct. 2016: 5.6%
Over the past year, the Duluth workforce contracted by 1.7%. The employment decline may stem from the overall economic decline of Minnesota’s Iron Range, a mining region in which a steep downturn in iron-ore prices has led to massive layoffs and shutdowns. While not a part of the Iron Range, Duluth relies heavily on the mining industry. The DM&IR railroad is the transportation hub for much of the ore produced in the Iron Range, and the Port of Duluth-Superior is the exit point for many of the mining products that are shipped throughout the Great Lakes region. As the Iron Range generates less revenue, Duluth’s trade facilities may suffer. Employment in the metro area’s trade, transportation, and utilities industries declined the most of any sector in Duluth in the past year.
[in-text-ad]

19. Alexandria, LA
> Employment change: -1.67%
> No. of jobs Oct. 2015: 62,409
> No. of jobs Oct. 2016: 61,367
> Unemployment rate Oct. 2016: 6.5%
Alexandria lost a net total of more than 1,000 workers over the past year. As employment in the metro area fell by 1.7%, the number of workers nationwide increased by the same amount. Like many metropolitan areas in Louisiana, the loss was largely due to the decline in oil prices. As employment in the area fell, the unemployment rate rose, from 6.1% to 6.5%.

18. Decatur, IL
> Employment change: -1.68%
> No. of jobs Oct. 2015: 47,203
> No. of jobs Oct. 2016: 46,409
> Unemployment rate Oct. 2016: 6.6%
The number of unemployed people in Decatur fell by more than 400 over the past 12 months. While this decline may appear to be an improvement in employment market conditions, it may actually be more an indication of area residents giving up looking for work as the area’s labor force contracted by an even greater 1,219 workers. Total employment dropped by 1.7%.

17. Williamsport, PA
> Employment change: -1.82%
> No. of jobs Oct. 2015: 56,793
> No. of jobs Oct. 2016: 55,758
> Unemployment rate Oct. 2016: 6.9%
The Williamsport, Pennsylvania metropolitan area’s largest industry is the trade, transportation, and utilities sector, which accounts for about one in five area workers. Williamsport employment in that sector also took the biggest hit over the past year, declining by about 300 employees for a 2.7% decline. As a whole, the number of workers employed in the area declined by more than 1,000.

16. Fairbanks, AK
> Employment change: -1.86%
> No. of jobs Oct. 2015: 43,823
> No. of jobs Oct. 2016: 43,007
> Unemployment rate Oct. 2016: 6.1%
Low-skilled jobs tend to be less stable and more subject to major job cuts. The major industries to lose workers over the past year — energy and manufacturing — tend to rely on workers without a college degree. In most of the metropolitan areas to lose the most workers, a lower share of the adult population has a bachelor’s degree than the national share of 30.6%. Fairbanks is an exception. Despite an above-average 34.5% bachelor’s attainment rate, area employment fell by 1.9% over the past year. Fairbanks’ government sector shed the largest share of jobs over that period.

15. Topeka, KS
> Employment change: -1.96%
> No. of jobs Oct. 2015: 116,159
> No. of jobs Oct. 2016: 113,879
> Unemployment rate Oct. 2016: 4.1%
Employment in the Topeka, Kansas metropolitan area fell by nearly 2% over the last 12 months, among the biggest declines in the country. Topeka’s government sector, its largest by employment as it accounts for nearly one in every four jobs, actually added about 400 jobs over the period. This was not enough to offset employment losses in both the manufacturing and the trade, transportation, and utilities sectors, the latter of which shed about 800 workers over that time.
[in-text-ad]

14. Binghamton, NY
> Employment change: -1.98%
> No. of jobs Oct. 2015: 103,787
> No. of jobs Oct. 2016: 101,727
> Unemployment rate Oct. 2016: 5.7%
Binghamton is one of many cities reporting rapid employment decline in New York’s Southern Tier region. The Southern Tier includes the neighboring Elmira metropolitan area, where employment declined 1.4% over the past year. In both metropolitan areas, job losses in manufacturing contributed substantially to the overall employment decline. Once home to major manufacturing operations for giants such as IBM, General Electric, and Endicott Johnson, Binghamton’s manufacturing sector today is a shadow of its post-WWII heyday.

13. Mankato-North Mankato, MN
> Employment change: -2.01%
> No. of jobs Oct. 2015: 58,051
> No. of jobs Oct. 2016: 56,886
> Unemployment rate Oct. 2016: 3.0%
The Mankato-North Mankato metropolitan area in Minnesota shed about 1,200 jobs over the past year. During that time, a similar number of workers left the labor force entirely. According to BLS chief regional economist Martin Kohli, the nationwide economic recovery over the past few years may have led to an acceleration of the long-term migratory trend of Americans moving from the Midwest and Northeast to the South and Southwest. This may have driven the decline in the Mankato region’s labor force. It appears that area employment will struggle to return to previous levels as an area plastics manufacturing plant, which had just opened in 2014, will close in early 2017, affecting 86 jobs.

12. Staunton-Waynesboro, VA
> Employment change: -2.02%
> No. of jobs Oct. 2015: 56,138
> No. of jobs Oct. 2016: 55,003
> Unemployment rate Oct. 2016: 4.4%
The Staunton-Waynesboro metropolitan area in northern Virginia lost about 1,100 workers over the past year. A similar number of people, possibly many of those who lost their jobs, left the labor force entirely. Still, even with the employment decline, unemployment in the area remains below national levels. While Staunton’s unemployment rate increased from 4.1% to 4.4% over the past year, it remained lower than the national unemployment rate of 4.9%.

11. Tulsa, OK
> Employment change: -2.03%
> No. of jobs Oct. 2015: 457,325
> No. of jobs Oct. 2016: 448,061
> Unemployment rate Oct. 2016: 5.3%
Tulsa is one of three metro areas in Oklahoma in which total employment fell by more than 2.0%. While the number of jobs in Tulsa fell by roughly 9,300, the number of people in the area’s labor force fell by just 4,400, pushing the area’s unemployment rate higher. Tulsa’s unemployment rate surged from 4.2% in October 2015 to 5.3% in October 2016. The 1.1 percentage point increase is tied as the fourth largest of any metro area.

10. Manhattan, KS
> Employment change: -2.03%
> No. of jobs Oct. 2015: 49,209
> No. of jobs Oct. 2016: 48,208
> Unemployment rate Oct. 2016: 3.5%
The number of employed workers in the Manhattan, Kansas metro area declined by 2.0% over the past year. By comparison, employment across the country grew by 1.7% over the same period. The job losses may have contributed to a shrinking labor force as well as rising unemployment. The Manhattan labor force contracted by 866 eligible workers between October 2015 and 2016. At the same time, the unemployment rate rose from 3.2% to 3.5%, reflecting an increase of 135 unemployed workers. In total, the metro area lost a little over 1,000 workers. One company that contributed to the area’s employment loss was the Florence Manufacturing Company, which laid off an estimated 80 workers in December 2015.
[in-text-ad]
9. Cheyenne, WY
> Employment change: -2.07%
> No. of jobs Oct. 2015: 47,071
> No. of jobs Oct. 2016: 46,098
> Unemployment rate Oct. 2016: 4.1%
Due to persistently depressed global oil prices, the mining, logging, and construction sector often led employment declines in the metropolitan areas that lost the largest share of workers in the past year. In Cheyenne, which reported one of the biggest relative overall employment declines in the country, the sector shed about 500 workers, or 12.5% of the sector’s workers. In an interview with the Wyoming Eagle Tribune at the beginning of 2016, Cheyenne Mayor Rick Kaysen said that in addition to lost tax revenue from the oil sector, the regional decline of oil operations would likely affect the construction industry in the area as well in the future.
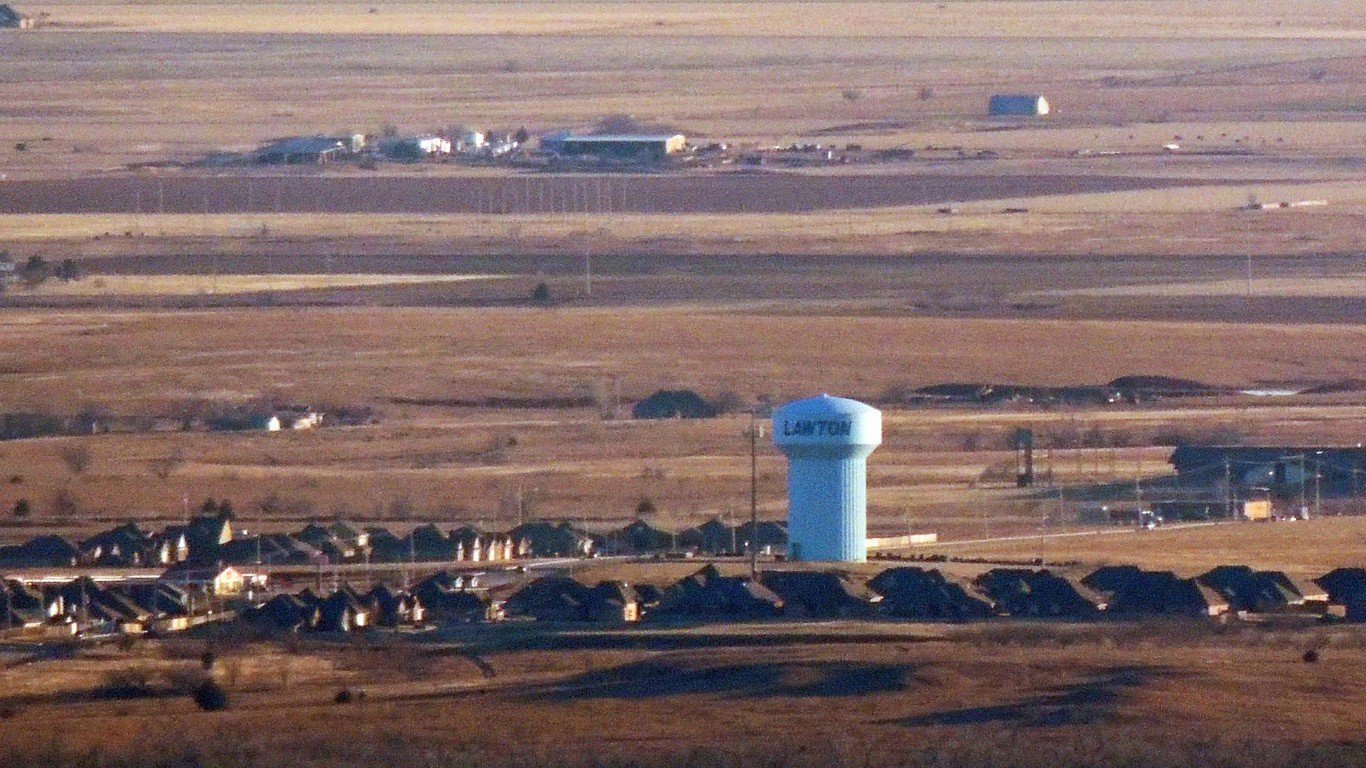
8. Lawton, OK
> Employment change: -2.07%
> No. of jobs Oct. 2015: 51,029
> No. of jobs Oct. 2016: 49,971
> Unemployment rate Oct. 2016: 4.8%
While the number of workers nationwide increased by 1.7% in the past year, employment in the Lawton, Oklahoma metro area decreased by 2.1%. With many Americans moving from the Midwest to the Sunbelt states, the Lawton labor force contracted by a net total of 671 eligible workers between October 2015 and 2016. Additionally, as the number of residents out of work grew by roughly 400 unemployed people, the city’s unemployment rate rose from 4.0% to 4.8%. The total number of workers in the metro area fell by more than 1,000, many of them in the oil and gas sector.

7. Carbondale-Marion, IL
> Employment change: -2.15%
> No. of jobs Oct. 2015: 57,565
> No. of jobs Oct. 2016: 56,328
> Unemployment rate Oct. 2016: 5.9%
Employment in the Carbondale-Marion metro area decreased by 2.1% over the past year. Unlike most cities losing jobs, Carbondale’s employment decline is likely less due to a weak economy and more the result of outbound migration. While the number of workers fell by roughly 1,200, the total labor force in the area fell by 1,500. So while there was one job less in Carbondale for every member of the workforce who moved from the metro area, some previously unemployed residents also found work. The area’s unemployment rate fell from 6.2% in October 2015 to 5.9% in October 2016, one of best improvements of any metro with a shrinking labor force.

6. Oklahoma City, OK
> Employment change: -2.20%
> No. of jobs Oct. 2015: 647,024
> No. of jobs Oct. 2016: 632,814
> Unemployment rate Oct. 2016: 4.4%
Oklahoma City is one of three metro areas in Oklahoma with employment decline greater than 2.0%. The job losses likely led to both outbound migration and rising unemployment onset by low energy prices. With many Americans relocating from the Midwest to the Sunbelt states, the Oklahoma City labor force contracted by a net total of 9,000 eligible workers in 2016. As the unemployment rate rose from 3.6% in October 2015 to 4.4% in October 2016, the number of unemployed workers grew by more than 5,000. In total, Oklahoma City lost an estimated 14,210 workers in 2016, more than any metro area in the country other than New York and Minneapolis.

5. Mansfield, OH
> Employment change: -2.33%
> No. of jobs Oct. 2015: 50,576
> No. of jobs Oct. 2016: 49,399
> Unemployment rate Oct. 2016: 5.6%
Cities without a talented, educated workforce often rely on one dominant, low-skilled industry and may be more vulnerable to changes in commodity prices and other market shifts than more diversified economies. Nearly one in five workers in Mansfield works in manufacturing, and just 14.4% of adults in the metro area have at least a bachelor’s degree. As demand for American manufacturing continues to decline, Mansfield’s reliance on the industry may have partially caused accelerated employment decline over the past year. The number of employed workers in the city decreased by 2.3% in 2016, more than nearly any other metro area.
[in-text-ad]

4. Shreveport-Bossier City, LA
> Employment change: -2.35%
> No. of jobs Oct. 2015: 180,977
> No. of jobs Oct. 2016: 176,731
> Unemployment rate Oct. 2016: 6.8%
Employment in the Shreveport-Bossier City area decreased by over 4,200 workers in the past year. During the same period, nearly an equal amount of people left the labor force.
Following the statewide trend, the Shreveport area is losing workers in the oil and gas sector. Unlike other areas in Louisiana that are more dependent on the oil and gas industry, however, Shreveport has a more diverse economy, and employment losses in this industry have had a less dramatic effect on the area’s overall employment. Still, due to falling oil prices and reduced natural gas production at the Haynesville Shale — a rock formation rich in natural gas — the industry’s job losses accounted for a sizable share of the area’s 2.3% employment decrease.

3. Houma-Thibodaux, LA
> Employment change: -3.74%
> No. of jobs Oct. 2015: 91,738
> No. of jobs Oct. 2016: 88,311
> Unemployment rate Oct. 2016: 6.7%
The number of employed workers in the Houma-Thibodaux area decreased by around 3,400 in the past year. While area employment declined by 3.7%, the number of workers increased by 1.7% nationwide. A large share of the area’s employment decline resulted from a shrinking oil and gas sector. Following a drop in oil prices and the first decrease in North American oil production in years, many oil workers nationwide have lost their jobs. The effects of these industry declines are exaggerated in Houma-Thibodaux, where a large share of residents are employed in the sector.

2. Casper, WY
> Employment change: -3.77%
> No. of jobs Oct. 2015: 40,156
> No. of jobs Oct. 2016: 38,644
> Unemployment rate Oct. 2016: 6.6%
The Casper metro area lost around 1,500 employed workers in the past year. This 3.8% decrease was largely caused by a declining coal mining industry in Wyoming. During the first quarter of 2016, coal production nationwide was the lowest it has been in 35 years, with Wyoming among the regions whose production has declined the most. The Casper metro area is around 100 miles from America’s two largest coal mines. Earlier this year, both of these mines announced large layoffs.

1. Lafayette, LA
> Employment change: -4.46%
> No. of jobs Oct. 2015: 210,224
> No. of jobs Oct. 2016: 200,845
> Unemployment rate Oct. 2016: 7.1%
The Lafayette metro area lost around 9,400 workers in the past year. Employment in the area fell by around 4.5%, even as nationwide employment increased by 1.7%. Following a trend of declining manufacturing employment nationwide, Lafayette’s manufacturing sector shed the most jobs of any industry. The employment declines likely led to a large share of residents giving up looking for work or leaving the area. The overall labor force decreased by nearly 8,500 in the past year. This 3.8% decline in labor force was the largest of any U.S. metro area.
Want retirement to come a few years earlier than you’d planned? Or are you ready to retire now, but want an extra set of eyes on your finances?
Now you can speak with up to 3 financial experts in your area for FREE. By simply clicking here you can begin to match with financial professionals who can help you build your plan to retire early. And the best part? The first conversation with them is free.
Click here to match with up to 3 financial pros who would be excited to help you make financial decisions.
Thank you for reading! Have some feedback for us?
Contact the 24/7 Wall St. editorial team.


 24/7 Wall St.