The U.S. violent crime rate — an annual, population-adjusted measure of cases of rape, robbery, aggravated assault, and homicide — climbed by 5% in 2020. The increase was driven by a rise in aggravated assault and, most notably, a historic 29% surge in homicides that made 2020 the deadliest year in the United States since the mid-1990s.
Despite the largest single-year increase in homicides on record, the overall violent crime rate in 2020 remains relatively low by historical standards. There were 1.3 million violent crimes reported in the U.S. in 2020, or 399 for every 100,000 people. For context, the violent crime rate ranged between 523 and 758 incidents per 100,000 throughout the 1990s.
Of course, crime is a local phenomenon influenced by a wide range of factors. As a result, violent crime rates in the U.S. can vary considerably from place to place — and in some metro areas, rates of violence far exceed the nation-level highs recorded in decades past.
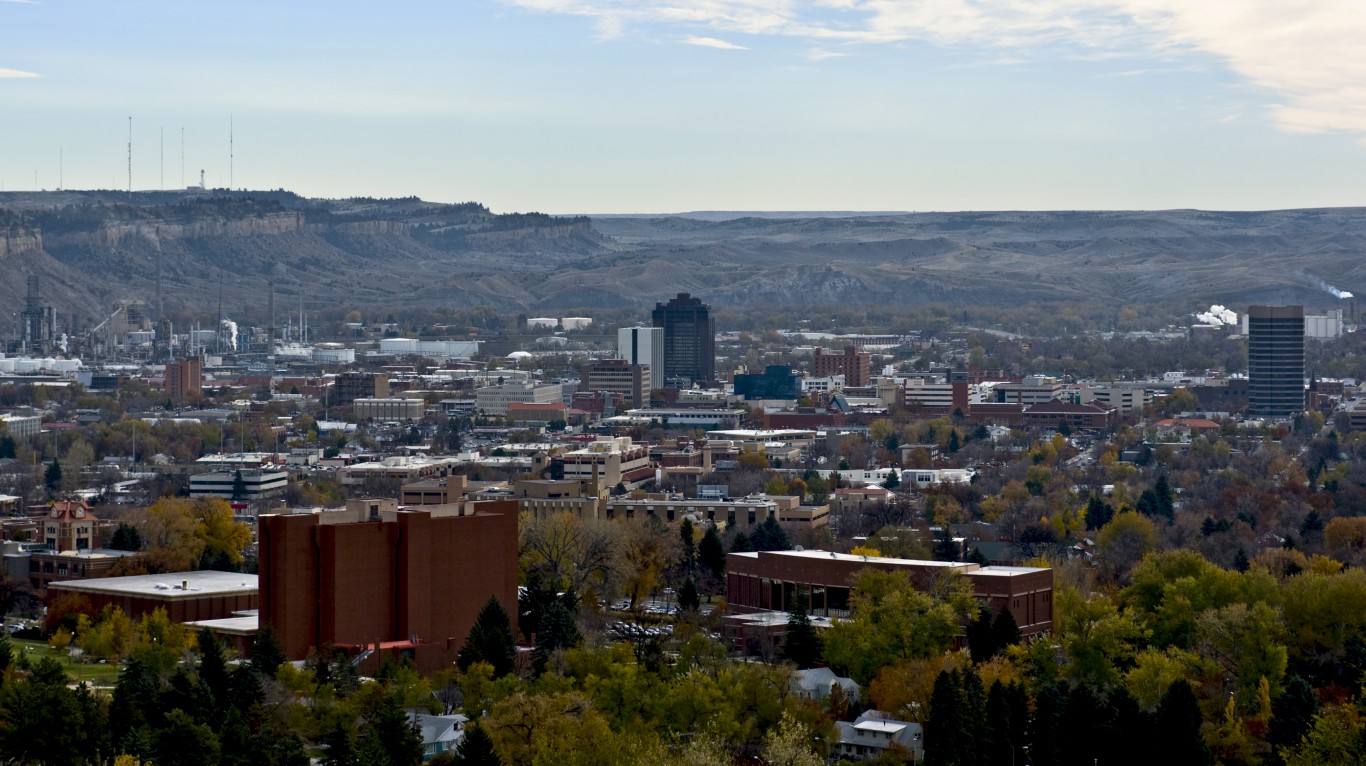
There were 1,152 violent crimes reported in the Billings, Montana, metro area in 2020, or 627 for every 100,000 people. Like much of the country, the area is suffering from a surge in violence. According to the Billings Police Department, domestic violence calls increased by 25% in 2020 and assaults on police officers and assaults with a weapon each increased by 50%.
In response to the rising violence, Billings residents passed a ballot initiative in November 2021 that will allocate $7.1 million to address the rising rates of violence. That money is in addition to the extra $5 million allocated to public safety in 2020.
Metro areas are ranked on their violent crime rate using data from the FBI’s 2020 Uniform Crime Report. Additional data on specific crimes are also from the 2020 FBI UCR. Poverty rates are one-year estimates from the U.S. Census Bureau’s 2019 American Community Survey.
| Rank | Metro area | Violent crimes per 100,000 people, 2020 | Total violent crimes, 2020 | Murders per 100,000 people, 2020 | Total murders, 2020 |
|---|---|---|---|---|---|
| 1 | Memphis, TN | 1,359 | 18,324 | 24.2 | 327 |
| 2 | Monroe, LA | 1,309 | 2,605 | 11.6 | 23 |
| 3 | Anchorage, AK | 1,171 | 3,576 | 5.9 | 18 |
| 4 | Pine Bluff, AR | 1,098 | 950 | 27.7 | 24 |
| 5 | Detroit, MI | 1,088 | 18,894 | 22.3 | 387 |
| 6 | Danville, IL | 1,050 | 785 | 17.4 | 13 |
| 7 | Albany, GA | 1,008 | 1,469 | 15.8 | 23 |
| 8 | Albuquerque, NM | 1,006 | 9,296 | 9.4 | 87 |
| 9 | Alexandria, LA | 968 | 1,464 | 14.5 | 22 |
| 10 | Little Rock, AR | 939 | 7,014 | 13.1 | 98 |
| 11 | Lubbock, TX | 919 | 2,985 | 9.5 | 31 |
| 12 | Florence, SC | 860 | 1,764 | 19.0 | 39 |
| 13 | Fairbanks, AK | 841 | 277 | 9.1 | 3 |
| 14 | Sumter, SC | 812 | 1,140 | 19.9 | 28 |
| 15 | Saginaw, MI | 795 | 1,501 | 17.5 | 33 |
| 16 | Lake Charles, LA | 789 | 1,663 | 9.0 | 19 |
| 17 | Rockford, IL | 771 | 2,566 | 10.8 | 36 |
| 18 | Gainesville, FL | 760 | 2,516 | 5.1 | 17 |
| 19 | Corpus Christi, TX | 738 | 3,176 | 10.0 | 43 |
| 20 | Stockton, CA | 723 | 5,517 | 11.0 | 84 |
| 21 | Pueblo, CO | 722 | 1,216 | 10.7 | 18 |
| 22 | Macon, GA | 708 | 1,624 | 19.2 | 44 |
| 23 | Odessa, TX | 697 | 1,180 | 11.2 | 19 |
| 24 | Bakersfield, CA | 692 | 6,216 | 12.9 | 116 |
| 25 | Shreveport, LA | 683 | 2,683 | 21.6 | 85 |
| 26 | Milwaukee, WI | 678 | 10,688 | 13.1 | 206 |
| 27 | Amarillo, TX | 673 | 1,787 | 6.8 | 18 |
| 28 | Springfield, IL | 667 | 1,369 | 5.8 | 12 |
| 29 | Rapid City, SD | 665 | 957 | 10.4 | 15 |
| 30 | Niles, MI | 664 | 1,013 | 5.2 | 8 |
| 31 | Battle Creek, MI | 664 | 886 | 10.5 | 14 |
| 32 | Kalamazoo, MI | 663 | 1,763 | 7.5 | 20 |
| 33 | Farmington, NM | 661 | 817 | 3.2 | 4 |
| 34 | Jonesboro, AR | 660 | 893 | 9.6 | 13 |
| 35 | South Bend, IN | 655 | 2,121 | 9.3 | 30 |
| 36 | Houston, TX | 632 | 45,368 | 9.2 | 662 |
| 37 | Springfield, MO | 632 | 2,993 | 5.5 | 26 |
| 38 | Billings, MT | 627 | 1,152 | 8.2 | 15 |
| 39 | Jackson, TN | 625 | 1,115 | 9.5 | 17 |
| 40 | New Orleans, LA | 624 | 7,960 | 21.7 | 277 |
| 41 | Nashville, TN | 616 | 12,137 | 7.7 | 152 |
| 42 | Fort Smith, AR | 615 | 1,541 | 4.4 | 11 |
| 43 | Chattanooga, TN | 613 | 3,487 | 7.9 | 45 |
| 44 | Beaumont, TX | 606 | 2,372 | 8.9 | 35 |
| 45 | Kokomo, IN | 604 | 498 | 9.7 | 8 |
| 46 | Lawton, OK | 603 | 759 | 12.7 | 16 |
| 47 | Merced, CA | 599 | 1,660 | 8.7 | 24 |
| 48 | Fresno, CA | 597 | 5,948 | 9.4 | 94 |
| 49 | Tulsa, OK | 591 | 5,947 | 9.3 | 94 |
| 50 | Hot Springs, AR | 583 | 582 | 9.0 | 9 |