Sending You to Google News in 3
Our top personal finance-related articles today. Your wallet will thank you later.
Both Disney and PayPal sit well below their multi-year highs, and both are flashing signals that tempt bargain hunters. But…
Own ASML Holding (NASDAQ:ASML | ASML Price Prediction) before the opening bell on July 15 when the company reports Q2…
Every quarter, a taxable DGRO position quietly hands a slice of its dividends to the IRS, and most investors never…
After 35 years of running a successful electrical contracting business, Dan pulled up his Social Security estimate and found a…
A legal career can eventually deliver a six-figure income, but the path is rarely passive. The median annual wage for…
Picture a married couple in their mid-60s, both healthy, staring at a brokerage statement that finally looks generous again. Their…
The math on replacing $60,000 of annual income looks simple until you ask a different question. At a 3.5% yield,…
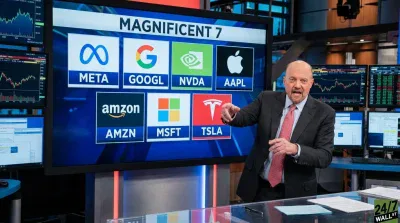
Jim Cramer owns six of the Magnificent Seven and argues that grouping them together is one of the costliest mistakes…
The S&P 500 is up 10.3% YTD, and Wall Street is convinced the markets have more room to run, particularly…