The U.S. has one of the largest and most advanced technology sectors in the world. California’s Silicon Valley has been a hub of technological innovation for over half a century and is now home to some of the most recognizable and influential technology companies, including Apple, Google’s parent company, Alphabet, and Meta, formerly Facebook.
Technology is a crucial driver of economic growth. It raises the productivity of existing industries and creates new ones. Areas with booming high tech sectors often have thriving economies and other strong socioeconomic indicators.
The Bureau of Labor Statistics defines high-tech industries as those with a high concentration of STEM (science, technology, engineering, and mathematics) occupations. These industries extend beyond semiconductors and computers and include chemicals, pharmaceuticals, aerospace products, and other industries.
The Huntsville metro area, located in Alabama, has one of the fastest growing high-tech sectors in the country. Between 2015 and 2020, employment in high-tech industries climbed by 30.6%, or 9,258 jobs, compared to 8.9% nationwide. The growth was led by surging employment in the scientific research and development services industry, which reported 62.2% job growth over the same period.
Jobs in high-tech sectors are often well paying. The average annual salary across high-tech industries in the Huntsville metro area stands at $190,484, about 2.9 times higher than the average salary across all jobs in the metro area.
It is important to note that the cities with the fastest growing tech sectors are not necessarily major tech hubs. Though, in Huntsville, high-tech industries account for 17.6% of overall employment, compared to 9.5% nationwide.
All data used in this story is from the Bureau of Labor Statistics Quarterly Census of Employment and Wages. Only metropolitan areas in which high-tech industries constitute at least 5% of the total workforce and where the high-tech industries added at least 1,000 jobs from 2015 to 2020 were included for consideration.
| Rank | Metro area | Change in high-tech industry employment, 2015 to 2020 (%) | Average annual high-tech industry pay, 2020 ($) | Share of all jobs in high-tech sectors (%) |
|---|---|---|---|---|
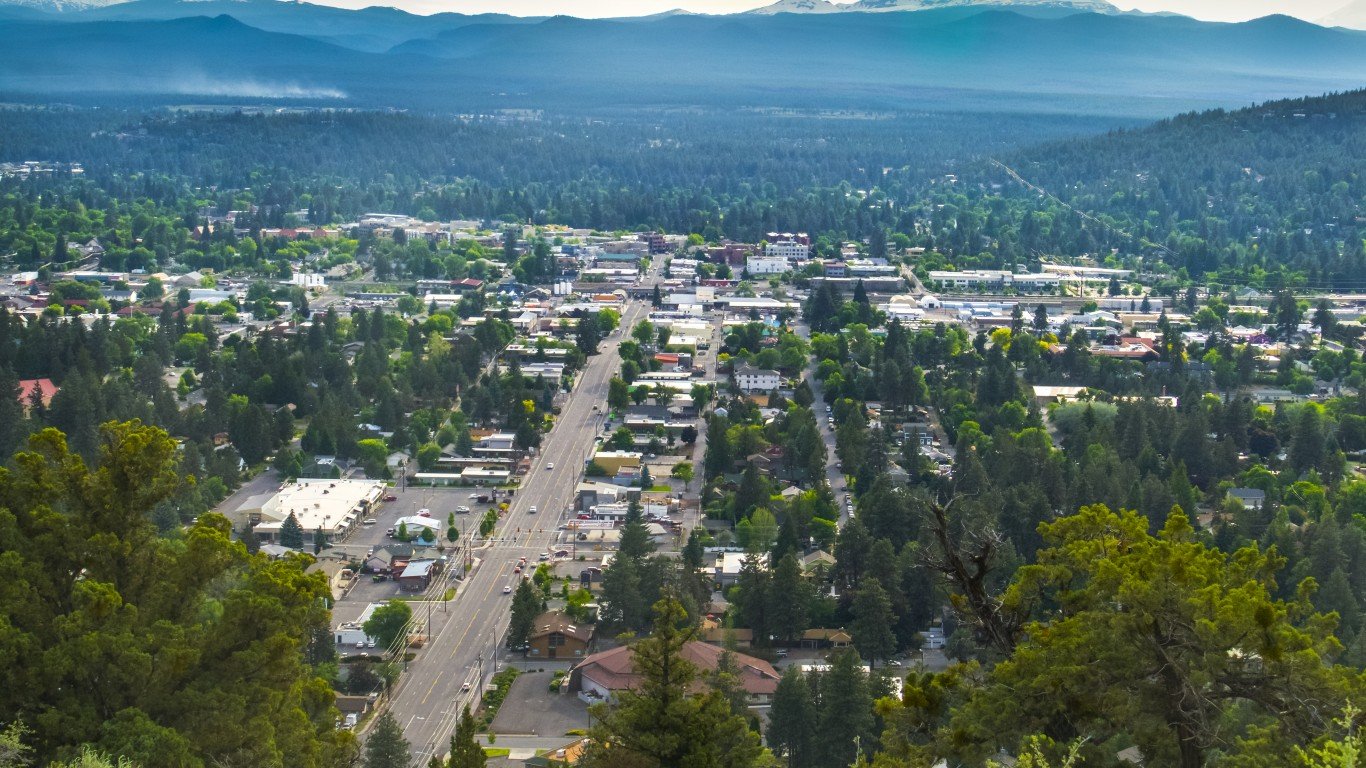
| 1 | Bend-Redmond, OR | 64.8 | 133,744 | 7.1 |
| 2 | Palm Bay-Melbourne-Titusville, FL | 41.6 | 106,139 | 16.4 |
| 3 | Crestview-Fort Walton Beach-Destin, FL | 39.4 | 185,011 | 8.1 |
| 4 | Austin-Round Rock, TX | 32.2 | 156,335 | 13.2 |
| 5 | Greeley, CO | 30.8 | 139,367 | 5.7 |
| 6 | Huntsville, AL | 30.6 | 190,484 | 17.6 |
| 7 | Salt Lake City, UT | 30.0 | 127,309 | 6.0 |
| 8 | Durham-Chapel Hill, NC | 28.3 | 206,318 | 8.9 |
| 9 | Ogden-Clearfield, UT | 28.0 | 142,561 | 5.3 |
| 10 | San Jose-Sunnyvale-Santa Clara, CA | 27.1 | 416,830 | 22.8 |
| 11 | Portland-South Portland, ME | 27.0 | 275,907 | 7.3 |
| 12 | Orlando-Kissimmee-Sanford, FL | 26.8 | 111,060 | 7.7 |
| 13 | Colorado Springs, CO | 24.8 | 218,891 | 9.1 |
| 14 | Phoenix-Mesa-Scottsdale, AZ | 24.8 | 140,259 | 5.2 |
| 15 | Nashville-Davidson–Murfreesboro–Franklin, TN | 24.5 | 111,854 | 7.9 |
| 16 | Tulsa, OK | 23.9 | 104,003 | 8.2 |
| 17 | Charleston-North Charleston, SC | 23.8 | 139,075 | 6.5 |
| 18 | California-Lexington Park, MD | 20.7 | 233,720 | 22.5 |
| 19 | Madison, WI | 20.4 | 512,047 | 7.0 |
| 20 | Boulder, CO | 19.9 | 146,158 | 25.0 |
| 21 | Boston-Cambridge-Newton, MA-NH | 19.0 | 177,997 | 14.8 |
| 22 | Denver-Aurora-Lakewood, CO | 18.9 | 141,713 | 14.1 |
| 23 | Trenton, NJ | 18.7 | 196,740 | 11.9 |
| 24 | Atlanta-Sandy Springs-Roswell, GA | 18.0 | 123,035 | 11.6 |
| 25 | San Francisco-Oakland-Hayward, CA | 17.7 | 229,896 | 19.7 |